
15 KiB
Name
多层波动带交易策略-Multi-Layer-Volatility-Band-Trading-Strategy
Author
ChaoZhang
Strategy Description
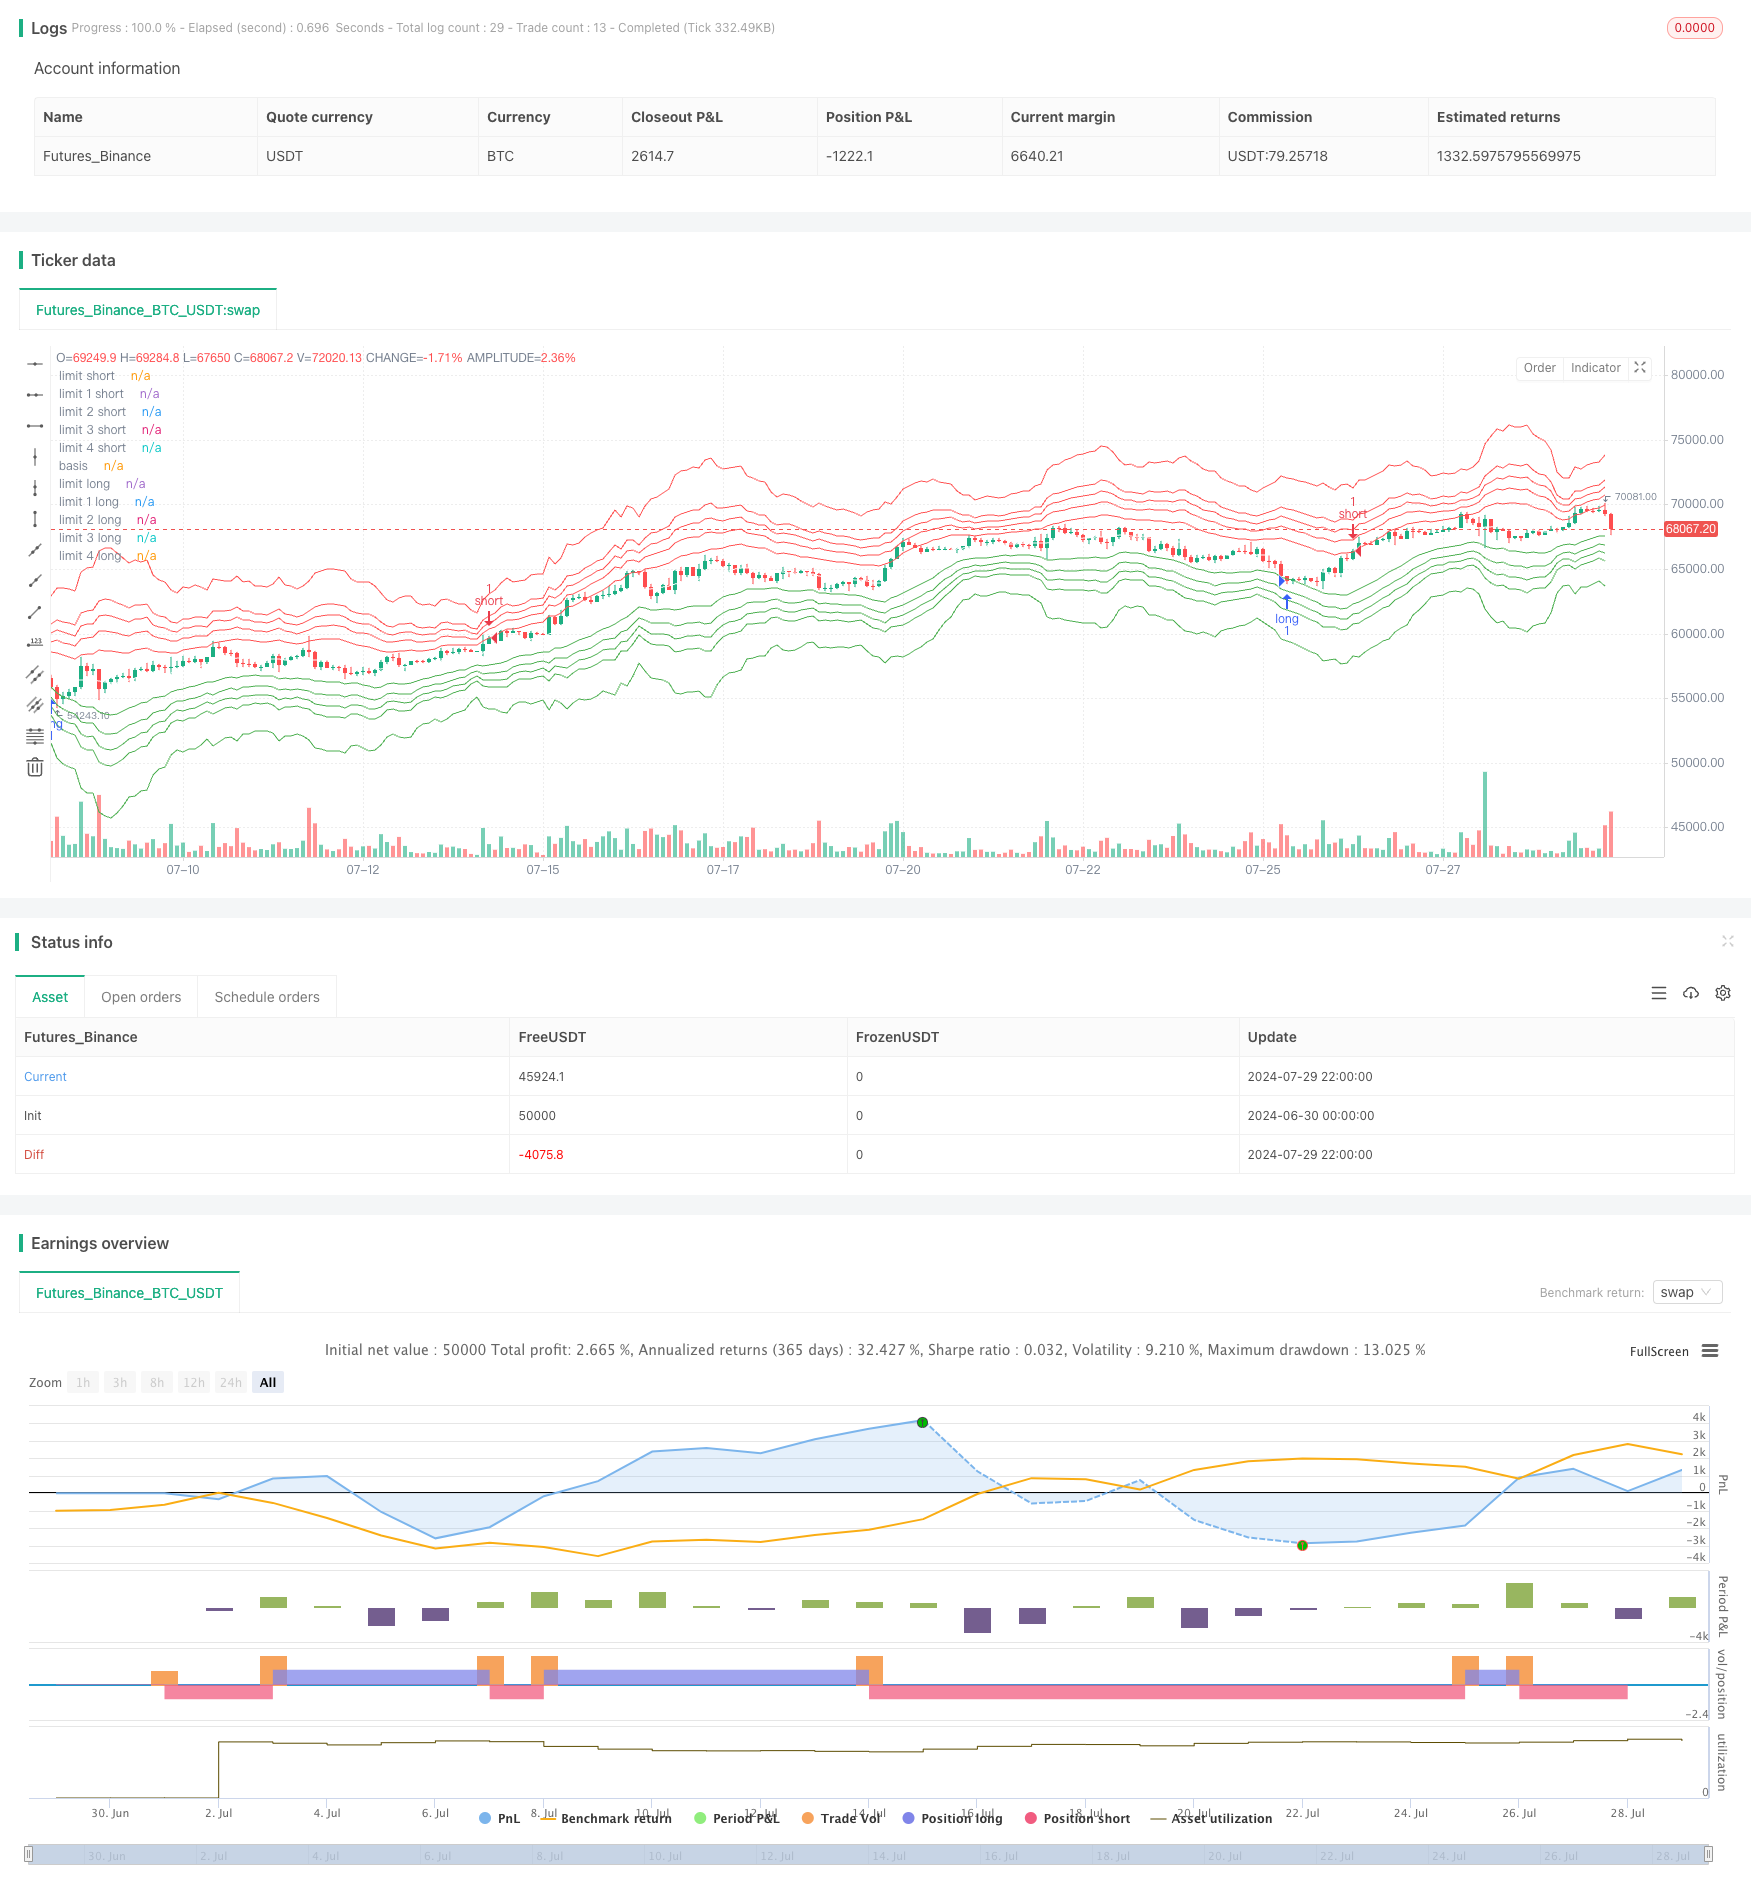
[trans]
概述
多层波动带交易策略是一种基于价格波动性的量化交易方法。该策略利用多个波动带来识别市场的超买和超卖区域,并在价格触及这些区域时进行交易。策略的核心思想是在价格偏离均值时建立头寸,并在价格回归时获利。这种方法借鉴了均值回归理论,同时结合了马丁格尔策略的理念,通过在不利走势中增加头寸来提高盈利机会。
策略原理
-
均线计算:策略使用可选的均线类型(SMA、EMA、SMMA、WMA、VWMA)计算基准线。
-
波动带设置:在基准线基础上,使用标准差乘以倍数来设置多层波动带。
-
斐波那契水平:利用斐波那契回撤水平(23.6%, 38.2%, 50%, 61.8%)来细分波动带,创建更多的交易机会。
-
动态调整:可选择使用动态倍数,根据ATR(平均真实波幅)来自动调整波动带宽度。
-
入场逻辑:当价格触及或穿越某一波动带时,策略在该方向上建立头寸。
-
加仓机制:如果价格继续朝不利方向移动,策略会在更远的波动带水平增加头寸,体现马丁格尔策略思想。
-
出场逻辑:当价格回归到基准线时,可选择平仓获利。也可设置在价格穿越基准线时平仓。
策略优势
-
多层次入场:通过设置多个波动带和斐波那契水平,策略提供了更多的交易机会,可以在不同价格水平捕捉市场波动。
-
灵活性强:策略允许用户选择不同的均线类型、周期和参数,以适应不同的市场环境和交易品种。
-
动态适应:可选的动态倍数功能使策略能够根据市场波动性自动调整,提高了策略的适应性。
-
风险管理:通过在不利走势中增加头寸,策略试图降低平均入场价格,提高最终盈利的可能性。
-
均值回归思想:策略基于价格终将回归均值的理念,这在许多市场和时间框架中都表现良好。
-
可定制性:用户可以根据自己的风险偏好和交易风格调整参数,如股数、斐波那契水平等。
策略风险
-
连续亏损风险:在强趋势市场中,价格可能持续突破多个波动带,导致连续加仓并累积大量亏损。
-
资金管理压力:马丁格尔式的加仓策略可能导致资金需求急剧增加,超出账户承受能力。
-
过度交易:多层波动带可能在震荡市场中产生过多的交易信号,增加交易成本。
-
参数敏感性:策略性能高度依赖于参数设置,不当的参数可能导致策略表现不佳。
-
滑点和流动性风险:在波动剧烈的市场中,可能面临严重的滑点,尤其是在加仓时。
-
回撤风险:虽然策略旨在通过加仓来降低平均成本,但在极端市场条件下仍可能面临大幅回撤。
策略优化方向
-
引入趋势过滤器:可以添加长期趋势指标,仅在趋势方向上开仓,避免在强趋势中频繁逆势交易。
-
动态仓位管理:根据账户规模和市场波动性动态调整每次交易的股数,以更好地控制风险。
-
优化出场机制:可以考虑引入trailing stop或基于波动率的动态止损,以更好地锁定利润和控制风险。
-
增加时间过滤:添加交易时间窗口限制,避开波动性较大或流动性较差的时段。
-
整合市场情绪指标:结合诸如VIX等波动率指标,在高波动期间调整策略参数或暂停交易。
-
引入机器学习:使用机器学习算法动态优化参数,提高策略对市场变化的适应性。
-
增加基本面过滤:结合基本面数据,在特定的基本面条件下才允许交易,提高交易质量。
总结
多层波动带交易策略是一种结合了技术分析、概率论和风险管理的复杂交易系统。它通过多层次的入场点和马丁格尔式的加仓方法,试图在价格波动中捕捉利润。策略的优势在于其灵活性和对均值回归的利用,但同时也面临着在强趋势市场中的风险。
要成功应用这一策略,交易者需要深入理解市场特性,谨慎设置参数,并实施严格的风险管理。通过持续的优化和回测,结合对市场的洞察,这一策略有潜力成为一个有效的交易工具。然而,鉴于其复杂性和潜在风险,建议在实盘交易前进行充分的模拟测试和风险评估。
总的来说,多层波动带交易策略为量化交易者提供了一个有趣且富有挑战性的框架,它的成功应用需要技术分析能力、风险管理技巧和持续的策略优化。
||
Overview
The Multi-Layer Volatility Band Trading Strategy is a quantitative trading approach based on price volatility. This strategy utilizes multiple volatility bands to identify overbought and oversold areas in the market, initiating trades when prices touch these areas. The core idea is to establish positions when prices deviate from the mean and profit when they revert. This method draws on mean reversion theory while incorporating elements of the Martingale strategy, increasing positions during adverse price movements to enhance profit opportunities.
Strategy Principles
-
Moving Average Calculation: The strategy uses selectable moving average types (SMA, EMA, SMMA, WMA, VWMA) to calculate the basis line.
-
Volatility Band Setup: Multiple volatility bands are set up based on the basis line, using standard deviation multiplied by a factor.
-
Fibonacci Levels: Fibonacci retracement levels (23.6%, 38.2%, 50%, 61.8%) are used to subdivide the volatility bands, creating more trading opportunities.
-
Dynamic Adjustment: An option to use dynamic multipliers based on ATR (Average True Range) to automatically adjust the width of volatility bands.
-
Entry Logic: Positions are established when the price touches or crosses a volatility band in the corresponding direction.
-
Position Scaling: If the price continues to move unfavorably, the strategy adds to the position at further volatility band levels, embodying the Martingale strategy concept.
-
Exit Logic: Profits are taken when the price reverts to the basis line. An option to close positions when the price crosses the basis line is also available.
Strategy Advantages
-
Multi-level Entry: By setting multiple volatility bands and Fibonacci levels, the strategy provides more trading opportunities, capturing market volatility at different price levels.
-
High Flexibility: The strategy allows users to choose different types of moving averages, periods, and parameters to adapt to various market environments and trading instruments.
-
Dynamic Adaptation: The optional dynamic multiplier feature enables the strategy to automatically adjust according to market volatility, enhancing adaptability.
-
Risk Management: By increasing positions during adverse price movements, the strategy attempts to lower the average entry price, increasing the probability of ultimate profitability.
-
Mean Reversion Concept: The strategy is based on the idea that prices will eventually revert to the mean, which performs well in many markets and timeframes.
-
Customizability: Users can adjust parameters such as share size and Fibonacci levels according to their risk preferences and trading style.
Strategy Risks
-
Consecutive Loss Risk: In strong trending markets, prices may continuously break through multiple volatility bands, leading to consecutive position increases and accumulating significant losses.
-
Capital Management Pressure: The Martingale-style position scaling can lead to rapidly increasing capital requirements, potentially exceeding account capacity.
-
Overtrading: Multiple volatility bands may generate excessive trading signals in range-bound markets, increasing transaction costs.
-
Parameter Sensitivity: Strategy performance is highly dependent on parameter settings; inappropriate parameters may lead to poor performance.
-
Slippage and Liquidity Risk: In highly volatile markets, significant slippage may be encountered, especially when scaling positions.
-
Drawdown Risk: Although the strategy aims to lower average costs through position scaling, it may still face substantial drawdowns under extreme market conditions.
Strategy Optimization Directions
-
Introduce Trend Filters: Add long-term trend indicators to open positions only in the trend direction, avoiding frequent counter-trend trades in strong trends.
-
Dynamic Position Sizing: Adjust the number of shares traded based on account size and market volatility to better control risk.
-
Optimize Exit Mechanisms: Consider introducing trailing stops or volatility-based dynamic stop-losses to better lock in profits and control risks.
-
Add Time Filters: Implement trading time window restrictions to avoid periods of high volatility or poor liquidity.
-
Integrate Market Sentiment Indicators: Incorporate volatility indicators like VIX to adjust strategy parameters or pause trading during high volatility periods.
-
Introduce Machine Learning: Use machine learning algorithms to dynamically optimize parameters, improving the strategy's adaptability to market changes.
-
Add Fundamental Filters: Incorporate fundamental data to allow trading only under specific fundamental conditions, improving trade quality.
Conclusion
The Multi-Layer Volatility Band Trading Strategy is a complex trading system combining technical analysis, probability theory, and risk management. It attempts to capture profits from price fluctuations through multi-level entry points and Martingale-style position scaling. The strategy's strengths lie in its flexibility and utilization of mean reversion, but it also faces risks in strong trending markets.
To successfully apply this strategy, traders need a deep understanding of market characteristics, careful parameter setting, and strict risk management implementation. Through continuous optimization and backtesting, combined with market insights, this strategy has the potential to become an effective trading tool. However, given its complexity and potential risks, it is advisable to conduct thorough simulated testing and risk assessment before live trading.
Overall, the Multi-Layer Volatility Band Trading Strategy provides an interesting and challenging framework for quantitative traders. Its successful application requires technical analysis skills, risk management techniques, and ongoing strategy optimization.
[/trans]
Source (PineScript)
/*backtest
start: 2024-06-30 00:00:00
end: 2024-07-30 00:00:00
period: 2h
basePeriod: 15m
exchanges: [{"eid":"Futures_Binance","currency":"BTC_USDT"}]
*/

// This Pine Script™ code is subject to the terms of the Mozilla Public License 2.0 at https://mozilla.org/MPL/2.0/
// © abtov

//@version=5
strategy("Spider Strategy", overlay=true)

ma(source, length, type) =>
    switch type
        "SMA" => ta.sma(source, length)
        "Bollinger Bands" => ta.sma(source, length)
        "EMA" => ta.ema(source, length)
        "SMMA (RMA)" => ta.rma(source, length)
        "WMA" => ta.wma(source, length)
        "VWMA" => ta.vwma(source, length)

stdev = input.int(56, "STDEV", group="Stdev")
mult = input.float(2.3, "Multiplier", group="Stdev")
ma_len = input.int(230, "Basis Length", group="Stdev")
ma_type = input.string("SMA", title="MA Type", options=["SMA", "Bollinger Bands", "EMA", "SMMA (RMA)", "WMA", "VWMA"], group="Stdev")
auto_mult = input.bool(true, "Dynamic Mult.", group="Stdev")
basis_exit = input.bool(false, "Basis Exit", group="Stdev")

col_int = input.int(12, "Collective Value", group="Collective")
col_input = input.bool(true, "Collective Input", group="Collective")


fib1 = input.float(0.236, "Fibonacci Level 1", group = "Fibonacci")
fib2 = input.float(0.382, "Fibonacci Level 2", group = "Fibonacci")
fib3 = input.float(0.5, "Fibonacci Level 3", group = "Fibonacci")
fib4 = input.float(0.618, "Fibonacci Level 4", group = "Fibonacci")

atr_len = input.int(30, "ATR", group="ATR")
atr_bias = input.float(0.72, "Bias", group="ATR")

shares = input.int(1, "Shares Amount", group="Strategy")

if(col_input == true)
    stdev := col_int
    ma_len := col_int
    atr_len := col_int

if(auto_mult == true)
    mult := ma(ta.tr(true), atr_len, ma_type) * atr_bias


basis = ma(close, ma_len, ma_type)
lower = basis - stdev * mult
upper = basis + stdev * mult

lower2 = basis - stdev * mult * fib1
upper2 = basis + stdev * mult * fib1

lower3 = basis - stdev * mult * fib2
upper3 = basis + stdev * mult * fib2

lower4 = basis - stdev * mult * fib3
upper4 = basis + stdev * mult * fib3

lower5 = basis - stdev * mult * fib4
upper5 = basis + stdev * mult * fib4


var lowerAct = false
var lower2Act = false
var lower3Act = false
var lower4Act = false
var lower5Act = false

var upperAct = false
var upper2Act = false
var upper3Act = false
var upper4Act = false
var upper5Act = false


plot(upper, "limit short", color.red)
plot(upper2, "limit 1 short", color.red)
plot(upper3, "limit 2 short", color.red)
plot(upper4, "limit 3 short", color.red)
plot(upper5, "limit 4 short", color.red)
plot(basis, "basis", color.white)
plot(lower, "limit long", color.green)
plot(lower2, "limit 1 long", color.green)
plot(lower3, "limit 2 long", color.green)
plot(lower4, "limit 3 long", color.green)
plot(lower5, "limit 4 long", color.green)


if(lowerAct == false)
    if(close < lower)
        strategy.entry("long", strategy.long, shares)
        lowerAct := true
else
    if(low > basis)
        lowerAct := false


if(lower2Act == false)
    if(close < lower2)
        strategy.entry("long", strategy.long, shares)
        lower2Act := true
else
    if(low > basis)
        lower2Act := false


if(lower3Act == false)
    if(close < lower3)
        strategy.entry("long", strategy.long, shares)
        lower3Act := true
else
    if(low > basis)
        lower3Act := false


if(lower4Act == false)
    if(close < lower4)
        strategy.entry("long", strategy.long, shares)
        lower4Act := true
else
    if(low > basis)
        lower4Act := false


if(lower5Act == false)
    if(close < lower5)
        strategy.entry("long", strategy.long, shares)
        lower5Act := true
else
    if(low > basis)
        lower5Act := false


if(upperAct == false)
    if(close > upper)
        strategy.entry("short", strategy.short, shares)
        upperAct := true
else
    if(high < basis)
        upperAct := false


if(upper2Act == false)
    if(close > upper2)
        strategy.entry("short", strategy.short, shares)
        upper2Act := true
else
    if(high < basis)
        upper2Act := false


if(upper3Act == false)
    if(close > upper3)
        strategy.entry("short", strategy.short, shares)
        upper3Act := true
else
    if(high < basis)
        upper3Act := false


if(upper4Act == false)
    if(close > upper4)
        strategy.entry("short", strategy.short, shares)
        upper4Act := true
else
    if(high < basis)
        upper4Act := false


if(upper5Act == false)
    if(close > upper5)
        strategy.entry("short", strategy.short, shares)
        upper5Act := true
else
    if(high < basis)
        upper5Act := false


if((ta.crossover(close, basis) and basis_exit == true))
    strategy.close("short")
    strategy.close("long")
Detail
https://www.fmz.com/strategy/458264
Last Modified
2024-07-31 14:08:36