
8.7 KiB
Name
多均线趋势反转量化策略基于EMA和SMA的组合信号系统-Multi-Moving-Average-Trend-Reversal-Quantitative-Strategy-Combined-EMA-and-SMA-Signal-System
Author
ianzeng123
Strategy Description
[trans]
概述
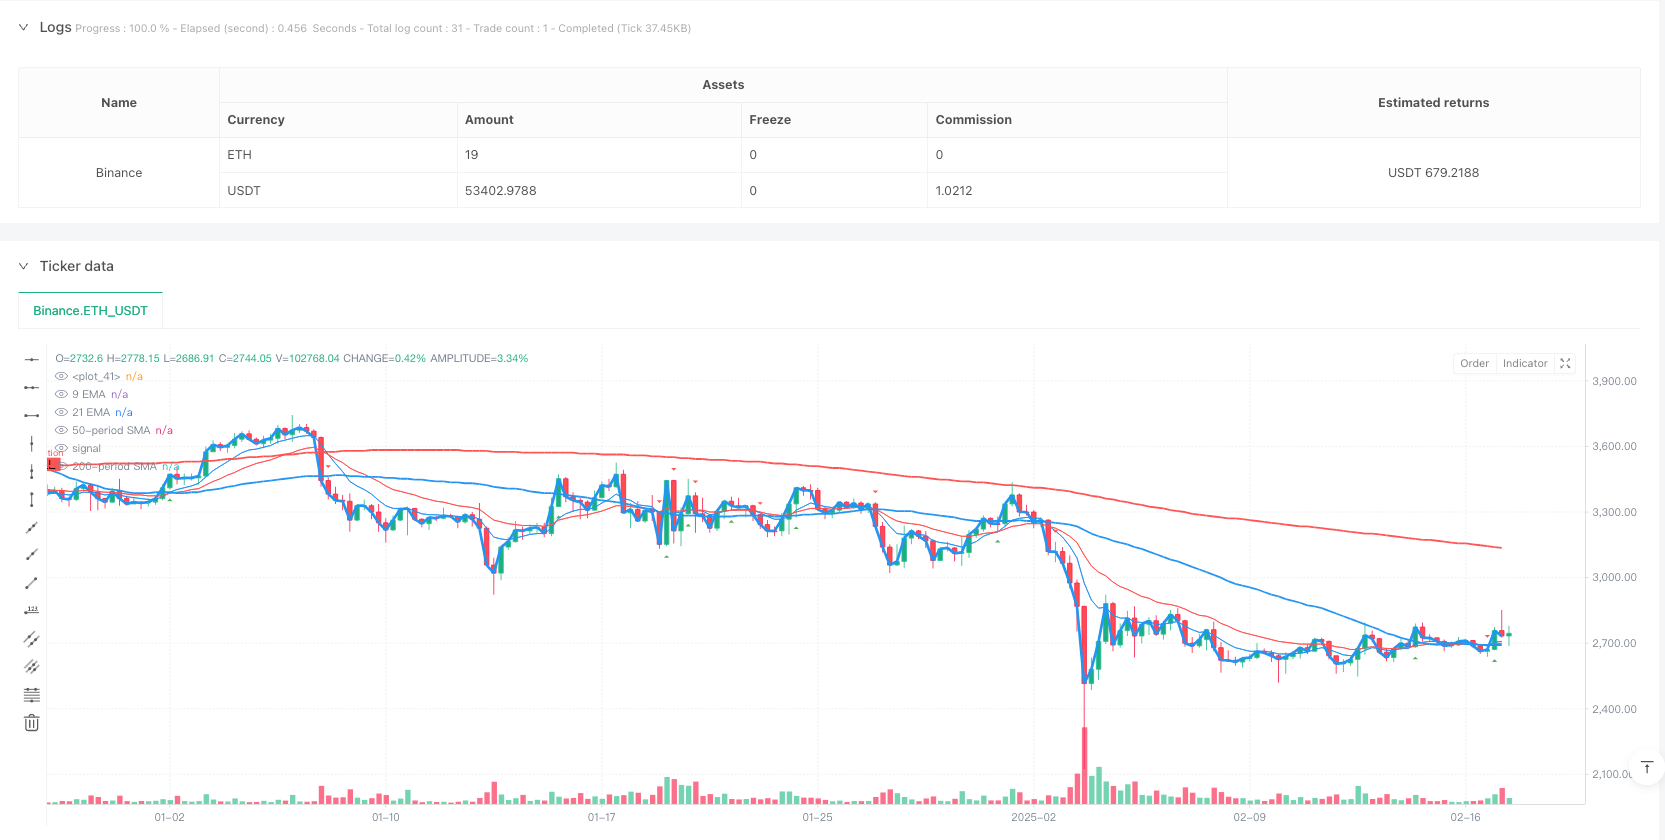
本策略是一个基于多重均线组合的趋势反转交易系统,结合了9周期、21周期、50周期和200周期的移动平均线,通过识别均线交叉信号来捕捉市场趋势的转折点。策略整合了短期和长期均线的优势,既能及时捕捉市场动量的变化,又能有效过滤虚假信号。
策略原理
策略的核心逻辑建立在多重时间框架的均线交叉系统之上。具体来说:
- 使用50周期和200周期的简单移动平均线(SMA)作为主要趋势判断指标
- 运用9周期和21周期的指数移动平均线(EMA)作为短期信号确认
- 通过设定回溯期(lookback)和阈值(threshold)参数来优化信号质量
- 结合关键价位支撑位和阻力位的判断,通过数据透视算法识别重要价格水平 当短期均线向上穿越长期均线时,系统发出做多信号;反之则发出做空信号。
策略优势
- 信号系统的可靠性:通过多重均线的交叉确认,显著降低了虚假信号的风险
- 趋势把握的及时性:短期均线的引入使策略能够快速响应市场变化
- 风险控制的全面性:支撑位和阻力位的识别有助于合理设置止损止盈位置
- 参数优化的灵活性:可根据不同市场环境调整回溯期和阈值参数
- 可视化效果的直观性:系统提供清晰的图形界面,便于交易决策
策略风险
- 震荡市场风险:在横盘整理阶段可能产生频繁的虚假信号
- 滞后性风险:移动平均线本质上是滞后指标,可能错过最佳入场时机
- 参数敏感性:不同参数组合可能导致策略表现差异较大
- 市场环境依赖:策略在趋势明显的市场中表现更好,而在剧烈波动时期可能表现欠佳
策略优化方向
- 引入量能指标:考虑将成交量作为信号确认的辅助指标
- 优化信号过滤:设计更严格的信号确认机制,如要求信号持续一定时间
- 动态参数调整:开发自适应参数系统,根据市场状态自动调整参数
- 完善风险控制:增加动态止损机制,保护已有盈利
- 加入市场环境判断:结合波动率指标,在不同市场环境下采用不同的参数设置
总结
该策略通过多重均线系统的协同作用,实现了对市场趋势转折点的有效识别。策略设计注重实用性和可操作性,通过参数的灵活调整可以适应不同的市场环境。虽然存在一定的局限性,但通过持续优化和完善,策略的整体表现具有较好的发展潜力。 ||
Overview
This strategy is a trend reversal trading system based on multiple moving average combinations, incorporating 9-period, 21-period, 50-period, and 200-period moving averages to identify market trend turning points through crossover signals. The strategy integrates the advantages of both short-term and long-term moving averages, enabling timely capture of market momentum changes while effectively filtering false signals.
Strategy Principles
The core logic is built on a multiple timeframe moving average crossover system. Specifically:
- Uses 50-period and 200-period Simple Moving Averages (SMA) as primary trend indicators
- Employs 9-period and 21-period Exponential Moving Averages (EMA) for short-term signal confirmation
- Optimizes signal quality through lookback period and threshold parameters
- Incorporates support and resistance level identification using pivot point algorithms The system generates buy signals when shorter-term averages cross above longer-term ones, and sell signals when the opposite occurs.
Strategy Advantages
- Signal Reliability: Multiple moving average confirmations significantly reduce false signal risks
- Timely Trend Capture: Short-term averages enable quick response to market changes
- Comprehensive Risk Control: Support and resistance identification aids in stop-loss and take-profit placement
- Parameter Flexibility: Adjustable lookback and threshold parameters for different market conditions
- Intuitive Visualization: Clear graphical interface facilitates trading decisions
Strategy Risks
- Choppy Market Risk: May generate frequent false signals during consolidation phases
- Lag Risk: Moving averages are inherently lagging indicators, potentially missing optimal entry points
- Parameter Sensitivity: Different parameter combinations may lead to varying strategy performance
- Market Environment Dependency: Strategy performs better in trending markets, may underperform during high volatility periods
Strategy Optimization Directions
- Volume Integration: Consider incorporating volume as a signal confirmation indicator
- Signal Filtering Enhancement: Design stricter signal confirmation mechanisms, such as requiring signal persistence
- Dynamic Parameter Adjustment: Develop adaptive parameter systems that automatically adjust based on market conditions
- Risk Control Improvement: Add dynamic stop-loss mechanisms to protect profits
- Market Context Integration: Incorporate volatility indicators to adapt parameters to different market environments
Summary
The strategy effectively identifies market trend turning points through the synergy of multiple moving average systems. The design emphasizes practicality and operability, with flexible parameter adjustment capabilities for different market conditions. While certain limitations exist, continuous optimization and refinement show promising potential for overall strategy performance.[/trans]
Source (PineScript)
/*backtest
start: 2024-11-11 00:00:00
end: 2025-02-18 08:00:00
period: 6h
basePeriod: 6h
exchanges: [{"eid":"Binance","currency":"ETH_USDT"}]
*/

//@version=6
//indicator("9/21 EMA Support & Resistance By DSW", overlay=true)
//indicator("Thick and Colorful Line", overlay=true)


// Define the price data
price = close

//@version=6
strategy("9/21/50/200 By DSW Trend Reversal for Options", overlay=true)

// Define the moving averages
short_term_sma = ta.sma(close, 50)  // 50-period SMA
long_term_sma = ta.sma(close, 200)  // 200-period SMA

// Plot the moving averages
plot(short_term_sma, color=color.blue, linewidth=2, title="50-period SMA")
plot(long_term_sma, color=color.red, linewidth=2, title="200-period SMA")

// Detect crossovers
bullish_reversal = ta.crossover(short_term_sma, long_term_sma)  // Short-term SMA crosses above long-term SMA
bearish_reversal = ta.crossunder(short_term_sma, long_term_sma)  // Short-term SMA crosses below long-term SMA

// Plot signals on the chart
plotshape(bullish_reversal, title="Bullish Reversal", location=location.belowbar, color=color.green, style=shape.labelup, text="BUY")
plotshape(bearish_reversal, title="Bearish Reversal", location=location.abovebar, color=color.red, style=shape.labeldown, text="SELL")

// Strategy to buy or sell based on the crossovers
if bullish_reversal
    strategy.entry("Buy Option", strategy.long)  // Buy Call for a bullish reversal

if bearish_reversal
    strategy.entry("Sell Option", strategy.short)  // Buy Put for a bearish reversal


// Define the color and line thickness
line_color = color.new(color.blue, 0)  // You can change this to any color you like
line_width = 3  // This controls the thickness of the line

// Plot the line
plot(price, color=line_color, linewidth=line_width)

// Input parameters
lookback = input.int(10, "Lookback Period")
threshold = input.float(0.5, "Threshold", minval=0, maxval=100, step=0.1)

// Calculate EMAs
ema9 = ta.ema(close, 9)
ema21 = ta.ema(close, 21)

// Plot EMAs
plot(ema9, color=color.blue, title="9 EMA")
plot(ema21, color=color.red, title="21 EMA")

// Function to find pivot highs and lows
pivotHigh = ta.pivothigh(high, lookback, lookback)
pivotLow = ta.pivotlow(low, lookback, lookback)

// EMA Crossover
crossover = ta.crossover(ema9, ema21)
crossunder = ta.crossunder(ema9, ema21)

// Plot crossover signals
plotshape(crossover, title="Bullish Crossover", location=location.belowbar, color=color.green, style=shape.triangleup, size=size.small)
// Plot bearish crossover signals
plotshape(crossunder, title="Bearish Crossover", location=location.abovebar, color=color.red, style=shape.triangledown, size=size.small)


// Alert conditions
if crossover
    alert("Bullish EMA Crossover", alert.freq_once_per_bar)

if crossunder
    alert("Bearish EMA Crossover", alert.freq_once_per_bar)
Detail
https://www.fmz.com/strategy/482788
Last Modified
2025-02-27 17:49:01