
24 KiB
Name
多均线交叉趋势跟踪与波动率过滤策略-Multi-Moving-Average-Crossover-Trend-Following-Strategy-with-Volatility-Filter
Author
ChaoZhang
Strategy Description
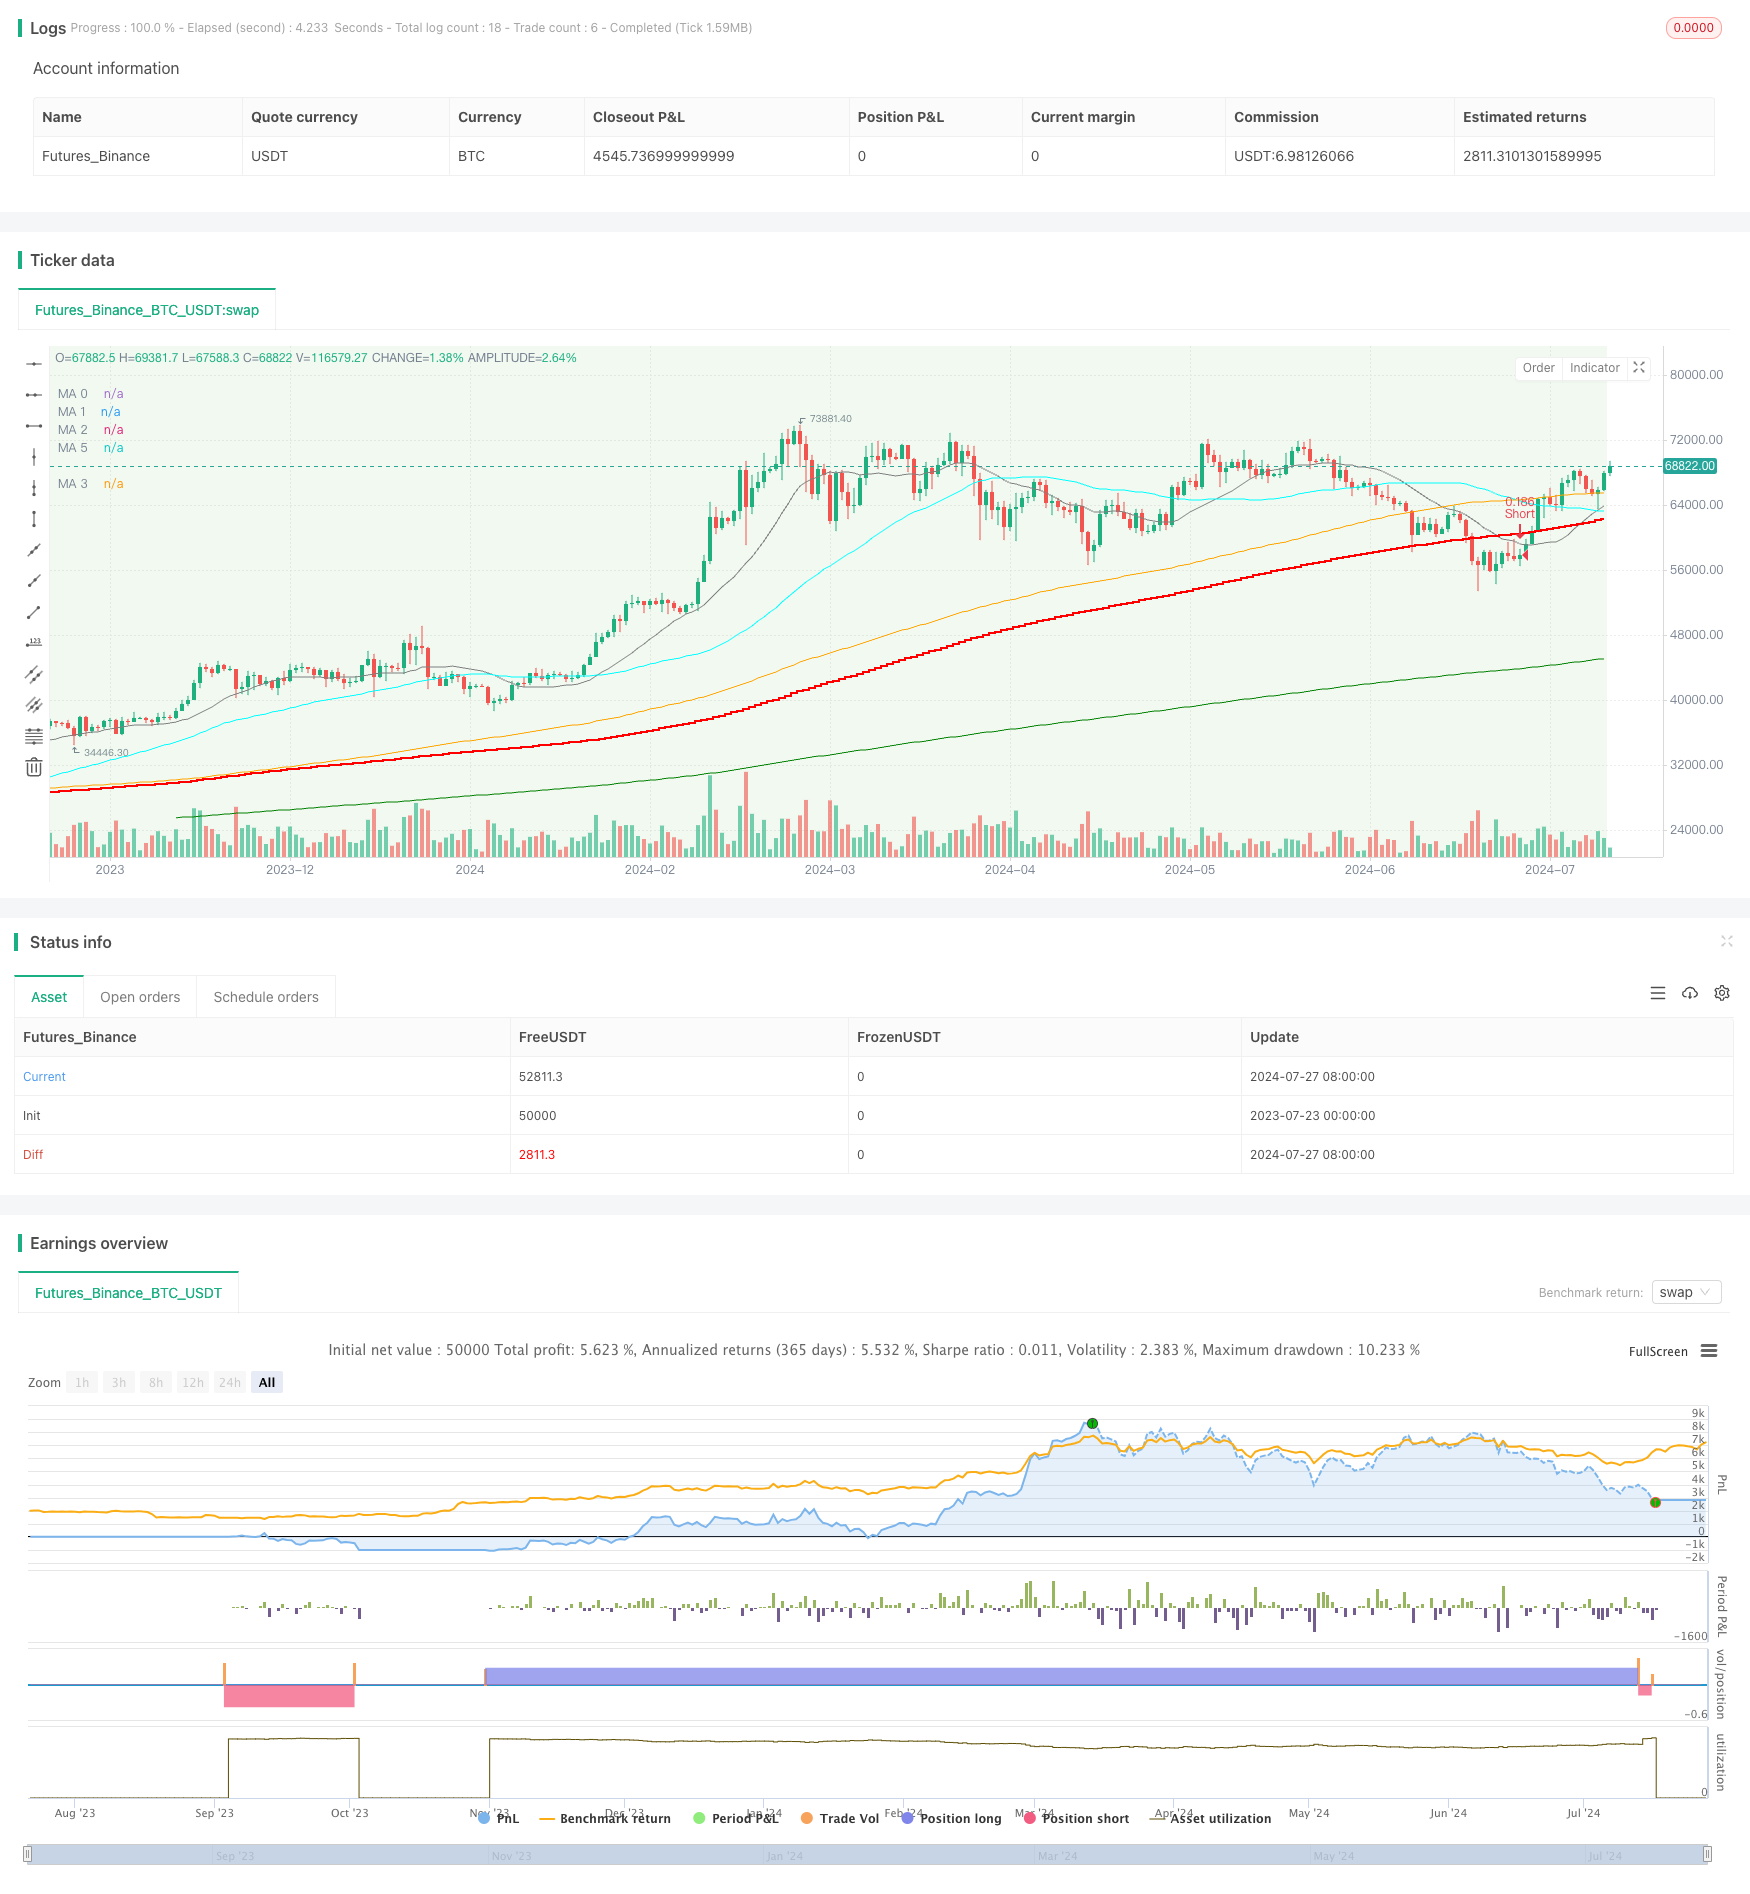
[trans]
概述
该策略是一个基于多重移动平均线交叉和波动率过滤的趋势跟踪交易系统。它利用三条不同周期的移动平均线来识别市场趋势,并使用第四条移动平均线作为牛熊市判断的基准。策略还引入了波动率指标作为交易过滤条件,以避免在低波动环境下进行交易。该策略支持做多和做空,并提供灵活的仓位管理和止损机制。
策略原理
-
移动平均线选择:策略使用三条主要的移动平均线(短期、中期和长期)来判断趋势。用户可以从六种预定义的移动平均线中选择,每种移动平均线都可以单独配置参数,包括计算周期、数据源和类型(如SMA、EMA等)。
-
趋势判断:
- 多头趋势:当短期均线高于长期均线,且中期均线向上穿越长期均线时。
- 空头趋势:当短期均线低于长期均线,且中期均线向下穿越长期均线时。
-
牛熊市判断:可选择使用第四条移动平均线作为牛熊市的分界线。当价格位于此线之上时,只允许做多;反之则只允许做空。
-
波动率过滤:使用一个基于最高价和最低价的波动率指标。只有当波动率超过用户设定的阈值时,策略才会发出交易信号。
-
入场逻辑:
- 多头入场:在多头趋势确认、波动率条件满足,且价格高于长期均线时开仓做多。
- 空头入场:在空头趋势确认、波动率条件满足,且价格低于长期均线时开仓做空。
-
出场逻辑:
- 部分平仓:当趋势反转(中期均线与长期均线再次交叉)时,平掉一定比例的仓位。
- 全部平仓:当价格穿越牛熊市分界线时,平掉所有相反方向的仓位。
-
止损:使用固定百分比止损,用户可自定义止损比例。
-
仓位管理:每次开仓使用账户权益的固定百分比,用户可自定义。
策略优势
-
多维度趋势分析:通过使用多条移动平均线,策略能够更全面地捕捉市场趋势,减少假信号。
-
灵活的参数配置:用户可以根据不同市场和交易品种的特性,灵活调整各项参数,包括均线类型、周期和数据源等。
-
波动率过滤:通过引入波动率指标,策略能够避免在低波动环境下交易,提高信号质量。
-
牛熊市适应:可选的牛熊市判断机制使策略能够更好地适应不同的市场环境,减少逆势交易。
-
动态仓位管理:基于账户权益的仓位管理方法,能够随着账户规模的变化自动调整交易规模。
-
多层次风险控制:包括波动率过滤、趋势确认、部分平仓和固定止损等多重风险控制机制。
-
双向交易:支持做多和做空,能够在各种市场环境下寻找交易机会。
-
可视化辅助:策略在图表上绘制了各条移动平均线和交易信号标签,便于直观分析和回测。
策略风险
-
滞后性:移动平均线本质上是滞后指标,可能导致入场和出场时机略有延迟,影响盈利能力。
-
震荡市表现欠佳:在横盘震荡市场中,策略可能频繁产生假信号,导致过度交易和亏损。
-
参数敏感性:策略的表现高度依赖于参数设置,不同市场和时间框架可能需要不同的参数组合。
-
回撤风险:在趋势反转时,策略可能无法及时全部出场,导致较大回撤。
-
过度依赖技术指标:策略完全基于技术指标,忽略了基本面因素,可能在重大新闻或事件发生时表现不佳。
-
资金管理风险:固定比例的仓位管理方法可能在连续亏损时导致过大的风险敞口。
-
止损设置:固定百分比止损可能不适用于所有市场环境,在高波动时期可能导致过早止损。
策略优化方向
-
自适应参数:引入自适应机制,根据市场状况动态调整移动平均线参数和波动率阈值。
-
多时间框架分析:结合更长和更短的时间框架信息,提高趋势判断的准确性。
-
波动率指标优化:考虑使用ATR或Bollinger带宽等更复杂的波动率指标,以更准确地评估市场状况。
-
引入动量指标:结合RSI或MACD等动量指标,优化入场和出场时机。
-
改进止损机制:实现跟踪止损或基于ATR的动态止损,以更好地适应市场波动。
-
整合市场情绪指标:引入VIX等市场情绪指标,优化策略在不同市场环境下的表现。
-
优化仓位管理:实现基于波动率或当前盈亏的动态仓位管理,更好地控制风险。
-
加入基本面过滤:考虑重要经济数据发布或公司财报等基本面因素,避免在高风险期间交易。
-
机器学习优化:使用机器学习算法优化参数组合和决策规则,提高策略的适应性。
-
回测与前向测试:进行更全面的回测,并在不同市场和时间段进行前向测试,以验证策略的稳健性。
总结
多均线交叉趋势跟踪与波动率过滤策略是一个全面且灵活的交易系统,它结合了多重移动平均线、波动率指标和趋势跟踪原理。通过多维度的趋势分析和严格的风险控制,该策略有潜力在各种市场环境下捕捉持续性趋势。然而,用户需要注意参数优化和市场适应性的问题,并考虑引入更多先进的技术指标和风险管理技术来进一步提升策略性能。总的来说,这是一个solid的策略框架,为进一步的研究和优化提供了良好的基础。
||
Overview
This strategy is a trend-following trading system based on multiple moving average crossovers and volatility filtering. It utilizes three moving averages of different periods to identify market trends and uses a fourth moving average as a benchmark for bull/bear market determination. The strategy also incorporates a volatility indicator as a trading filter to avoid trading in low volatility environments. It supports both long and short positions and provides flexible position management and stop-loss mechanisms.
Strategy Principles
-
Moving Average Selection: The strategy uses three main moving averages (short-term, medium-term, and long-term) to determine trends. Users can choose from six predefined moving averages, each of which can be individually configured with parameters including calculation period, data source, and type (e.g., SMA, EMA).
-
Trend Determination:
- Bullish Trend: When the short-term MA is above the long-term MA, and the medium-term MA crosses above the long-term MA.
- Bearish Trend: When the short-term MA is below the long-term MA, and the medium-term MA crosses below the long-term MA.
-
Bull/Bear Market Determination: An optional fourth moving average can be used as a dividing line for bull and bear markets. Only long positions are allowed when the price is above this line, and only short positions when below.
-
Volatility Filter: A volatility indicator based on highest and lowest prices is used. The strategy only generates trading signals when volatility exceeds a user-defined threshold.
-
Entry Logic:
- Long Entry: Enter a long position when a bullish trend is confirmed, volatility conditions are met, and the price is above the long-term MA.
- Short Entry: Enter a short position when a bearish trend is confirmed, volatility conditions are met, and the price is below the long-term MA.
-
Exit Logic:
- Partial Exit: Close a certain percentage of the position when the trend reverses (medium-term MA crosses the long-term MA again).
- Full Exit: Close all positions in the opposite direction when the price crosses the bull/bear market dividing line.
-
Stop Loss: Uses a fixed percentage stop loss, which can be customized by the user.
-
Position Management: Uses a fixed percentage of account equity for each trade, which can be customized by the user.
Strategy Advantages
-
Multi-dimensional Trend Analysis: By using multiple moving averages, the strategy can capture market trends more comprehensively, reducing false signals.
-
Flexible Parameter Configuration: Users can adjust various parameters flexibly according to the characteristics of different markets and trading instruments, including MA type, period, and data source.
-
Volatility Filtering: By incorporating a volatility indicator, the strategy can avoid trading in low volatility environments, improving signal quality.
-
Bull/Bear Market Adaptation: The optional bull/bear market determination mechanism allows the strategy to better adapt to different market environments, reducing counter-trend trades.
-
Dynamic Position Management: The equity-based position management method automatically adjusts trading size as the account size changes.
-
Multi-layered Risk Control: Includes multiple risk control mechanisms such as volatility filtering, trend confirmation, partial position closure, and fixed stop loss.
-
Bi-directional Trading: Supports both long and short positions, allowing for trading opportunities in various market conditions.
-
Visual Aids: The strategy plots various moving averages and trade signal labels on the chart, facilitating intuitive analysis and backtesting.
Strategy Risks
-
Lagging Nature: Moving averages are inherently lagging indicators, which may lead to slightly delayed entry and exit timing, affecting profitability.
-
Poor Performance in Ranging Markets: In sideways, choppy markets, the strategy may generate frequent false signals, leading to overtrading and losses.
-
Parameter Sensitivity: The strategy's performance is highly dependent on parameter settings, and different markets and timeframes may require different parameter combinations.
-
Drawdown Risk: During trend reversals, the strategy may not exit positions entirely in a timely manner, potentially leading to significant drawdowns.
-
Over-reliance on Technical Indicators: The strategy is entirely based on technical indicators, ignoring fundamental factors, which may lead to poor performance during major news or events.
-
Money Management Risk: The fixed percentage position sizing method may result in excessive risk exposure during consecutive losses.
-
Stop Loss Setting: The fixed percentage stop loss may not be suitable for all market environments and could lead to premature exits during high volatility periods.
Strategy Optimization Directions
-
Adaptive Parameters: Introduce adaptive mechanisms to dynamically adjust moving average parameters and volatility thresholds based on market conditions.
-
Multi-timeframe Analysis: Incorporate information from longer and shorter timeframes to improve trend determination accuracy.
-
Volatility Indicator Optimization: Consider using more sophisticated volatility indicators such as ATR or Bollinger Bandwidth for more accurate market condition assessment.
-
Momentum Indicator Integration: Combine momentum indicators like RSI or MACD to optimize entry and exit timing.
-
Improved Stop Loss Mechanism: Implement trailing stops or ATR-based dynamic stop losses to better adapt to market volatility.
-
Market Sentiment Integration: Incorporate market sentiment indicators like VIX to optimize strategy performance in different market environments.
-
Position Management Optimization: Implement dynamic position sizing based on volatility or current profit/loss for better risk control.
-
Fundamental Filter Addition: Consider fundamental factors such as important economic data releases or company earnings reports to avoid trading during high-risk periods.
-
Machine Learning Optimization: Use machine learning algorithms to optimize parameter combinations and decision rules, improving strategy adaptability.
-
Backtesting and Forward Testing: Conduct more comprehensive backtesting and forward testing in different markets and time periods to verify strategy robustness.
Conclusion
The Multi-Moving Average Crossover Trend Following Strategy with Volatility Filter is a comprehensive and flexible trading system that combines multiple moving averages, volatility indicators, and trend-following principles. Through multi-dimensional trend analysis and strict risk control, the strategy has the potential to capture persistent trends in various market environments. However, users need to pay attention to parameter optimization and market adaptability issues, and consider introducing more advanced technical indicators and risk management techniques to further enhance strategy performance. Overall, this is a solid strategy framework that provides a good foundation for further research and optimization.
[/trans]
Source (PineScript)
/*backtest
start: 2023-07-23 00:00:00
end: 2024-07-28 00:00:00
period: 1d
basePeriod: 1h
exchanges: [{"eid":"Futures_Binance","currency":"BTC_USDT"}]
*/

//@version=5
strategy(title="WODIsMA Strategy", shorttitle="WMA_Strategy", overlay=true, overlay=true, pyramiding=2, default_qty_value=6, default_qty_type=strategy.fixed, initial_capital=1000, currency=currency.USD)

// 用户输入参数
capital_pct = input.float(20, title="每笔订单使用的资金百分比(%)", minval=0.1, maxval=100, group="Position") / 100
close_pct = input.float(20, title="每次平仓使用的百分比(%)", minval=0, maxval=100, group="Position") / 100
stop_loss_user = input.float(10, title="止损百分比(%)", minval=0, maxval=100, group="Position") / 100
allow_long = input.bool(true, title="是否做多", group="Position")
allow_short = input.bool(true, title="是否做空", group="Position")

// 用户选择的移动平均线
short_term_ma = input.string("MA 0", title="短期趋势均线", options=["MA 0", "MA 1", "MA 2", "MA 3", "MA 4", "MA 5"], group="TrendIdentify")
mid_term_ma = input.string("MA 1", title="中期趋势均线", options=["MA 0", "MA 1", "MA 2", "MA 3", "MA 4", "MA 5"], group="TrendIdentify")
long_term_ma = input.string("MA 2", title="长期趋势均线", options=["MA 0", "MA 1", "MA 2", "MA 3", "MA 4", "MA 5"], group="TrendIdentify")
bull_bear_ma = input.string("MA 3", title="牛熊趋势均线", options=["MA 0", "MA 1", "MA 2", "MA 3", "MA 4", "MA 5"], group="TrendIdentify")
enable_bull_bear = input.bool(false, title="是否启用牛熊趋势线", group="TrendIdentify")
// 波动率指标参数
volatility_k = input.int(60, title="波动率数值K线数" , group="volatility")
volatility_threshold = input.float(1, minval=0, title="波动率值 0则不使用(%)", group="volatility")

// 定义不同类型的移动平均线函数
ma(source, length, type) =>
    switch type
        "SMA" => ta.sma(source, length)
        "EMA" => ta.ema(source, length)
        "SMMA (RMA)" => ta.rma(source, length)
        "WMA" => ta.wma(source, length)
        "VWMA" => ta.vwma(source, length)

// 定义每根均线的输入参数和颜色
length0 = input.int(16, minval=1, title="Length 0", group="MA 0")
source0 = input.source(hl2, title="Source 0", group="MA 0")
type0 = input.string("SMA", title="Type 0", options=["SMA", "EMA", "SMMA (RMA)", "WMA", "VWMA"], group="MA 0")
timeframe0 = input.timeframe("", title="Timeframe 0", group="MA 0")
color0 = input.color(color.gray, title="Color 0", group="MA 0")
show0 = input.bool(true, title="Show MA 0", group="MA 0")

length1 = input.int(48, minval=1, title="Length 1", group="MA 1")
source1 = input.source(hl2, title="Source 1", group="MA 1")
type1 = input.string("SMA", title="Type 1", options=["SMA", "EMA", "SMMA (RMA)", "WMA", "VWMA"], group="MA 1")
timeframe1 = input.timeframe("", title="Timeframe 1", group="MA 1")
color1 = input.color(color.aqua, title="Color 1", group="MA 1")
show1 = input.bool(true, title="Show MA 1", group="MA 1")

length2 = input.int(144, minval=1, title="Length 2", group="MA 2")
source2 = input.source(hl2, title="Source 2", group="MA 2")
type2 = input.string("SMA", title="Type 2", options=["SMA", "EMA", "SMMA (RMA)", "WMA", "VWMA"], group="MA 2")
timeframe2 = input.timeframe("", title="Timeframe 2", group="MA 2")
color2 = input.color(color.orange, title="Color 2", group="MA 2")
show2 = input.bool(true, title="Show MA 2", group="MA 2")

length3 = input.int(432, minval=1, title="Length 3", group="MA 3")
source3 = input.source(hl2, title="Source 3", group="MA 3")
type3 = input.string("SMA", title="Type 3", options=["SMA", "EMA", "SMMA (RMA)", "WMA", "VWMA"], group="MA 3")
timeframe3 = input.timeframe("", title="Timeframe 3", group="MA 3")
color3 = input.color(color.green, title="Color 3", group="MA 3")
show3 = input.bool(true, title="Show MA 3", group="MA 3")

length4 = input.int(91, minval=1, title="Length 4", group="MA 4")
source4 = input.source(hl2, title="Source 4", group="MA 4")
type4 = input.string("SMA", title="Type 4", options=["SMA", "EMA", "SMMA (RMA)", "WMA", "VWMA"], group="MA 4")
timeframe4 = input.timeframe("D", title="Timeframe 4", group="MA 4")
color4 = input.color(color.rgb(159, 110, 208), title="Color 4", group="MA 4") // 浅紫色
style4 = input.string("step", title="Style 4", options=["line", "step"], group="MA 4")
show4 = input.bool(false, title="Show MA 4", group="MA 4")

length5 = input.int(182, minval=1, title="Length 5", group="MA 5")
source5 = input.source(hl2, title="Source 5", group="MA 5")
type5 = input.string("SMA", title="Type 5", options=["SMA", "EMA", "SMMA (RMA)", "WMA", "VWMA"], group="MA 5")
timeframe5 = input.timeframe("D", title="Timeframe 5", group="MA 5")
color5 = input.color(color.red, title="Color 5", group="MA 5")
style5 = input.string("step", title="Style 5", options=["line", "step"], group="MA 5")
show5 = input.bool(true, title="Show MA 5", group="MA 5")

// 计算每根均线的值
value0 = request.security(syminfo.tickerid, timeframe0, ma(source0, length0, type0))
value1 = request.security(syminfo.tickerid, timeframe1, ma(source1, length1, type1))
value2 = request.security(syminfo.tickerid, timeframe2, ma(source2, length2, type2))
value3 = request.security(syminfo.tickerid, timeframe3, ma(source3, length3, type3))
value4 = request.security(syminfo.tickerid, timeframe4, ma(source4, length4, type4))
value5 = request.security(syminfo.tickerid, timeframe5, ma(source5, length5, type5))

// 绘制每根均线
plot(show0 ? value0 : na, title="MA 0", color=color0)
plot(show1 ? value1 : na, title="MA 1", color=color1)
plot(show2 ? value2 : na, title="MA 2", color=color2)
plot(show3 ? value3 : na, title="MA 3", color=color3)
plot(show4 ? value4 : na, title="MA 4", color=color4, style=style4 == "step" ? plot.style_stepline : plot.style_line, linewidth=2)
plot(show5 ? value5 : na, title="MA 5", color=color5, style=style5 == "step" ? plot.style_stepline : plot.style_line, linewidth=2)

// 添加策略部分

// 选择均线值
get_ma_value(ma_name) =>
    if (ma_name == "MA 0")
        value0
    else if (ma_name == "MA 1")
        value1
    else if (ma_name == "MA 2")
        value2
    else if (ma_name == "MA 3")
        value3
    else if (ma_name == "MA 4")
        value4
    else
        value5

short_ma_value = get_ma_value(short_term_ma)
mid_ma_value = get_ma_value(mid_term_ma)
long_ma_value = get_ma_value(long_term_ma)
bull_bear_ma_value = get_ma_value(bull_bear_ma)

// 计算波动率
high_close = ta.highest(high, volatility_k)
low_close = ta.lowest(low, volatility_k)
volatility = 100 * (high_close - low_close) / low_close

// 波动率条件背景色
volatilityCondition = (volatility > volatility_threshold)
volatilityConditionBG = (volatility > volatility_threshold) and volatility_threshold != 0

bgcolor(volatilityConditionBG ? color.new(color.green, 90) : na, title="Volatility Background")

// 策略信号
long_condition = (short_ma_value > long_ma_value and ta.crossover(mid_ma_value, long_ma_value))
short_condition = (short_ma_value < long_ma_value and ta.crossunder(mid_ma_value, long_ma_value))

var float stop_level_long = na
var float stop_level_short = na

// 执行策略
if (volatilityCondition and allow_long and (not enable_bull_bear or close > bull_bear_ma_value))
    if (long_condition and close > long_ma_value)  // 判断是否立即触发止损
        strategy.entry("Long", strategy.long, qty=capital_pct * strategy.equity / close)
        label.new(bar_index, low*0.996, text="BUY", color=color.green, textcolor=color.white, style=label.style_label_up, size=size.small)

if (volatilityCondition and allow_short and (not enable_bull_bear or close < bull_bear_ma_value))
    if (short_condition and close < long_ma_value)  // 判断是否立即触发止损
        strategy.entry("Short", strategy.short, qty=capital_pct * strategy.equity / close)
        label.new(bar_index, high*1.004, text="SELL", color=color.red, textcolor=color.white, style=label.style_label_down, size=size.small)

// 部分平仓逻辑
if (enable_bull_bear)
    // 当当前价格处在牛熊趋势均线之下时
    if (close < bull_bear_ma_value)
        // 平所有多仓
        if (strategy.position_size > 0)
            strategy.close("Long", comment="平所有多仓")
            label.new(bar_index, low*0.996, text="CLOSE", color=color.gray, textcolor=color.white, style=label.style_label_up, size=size.small)
        // 当短期均线在长期均线之上时,中期均线向上穿过长期均线,平空
        if (short_ma_value > long_ma_value and ta.crossover(mid_ma_value, long_ma_value) and volatilityCondition)
            if (strategy.position_size < 0)
                strategy.close("Short", qty=close_pct * strategy.position_size, comment="部分平空")
                label.new(bar_index, high*1.004, text="CLOSE", color=color.gray, textcolor=color.white, style=label.style_label_down, size=size.small)

    // 当当前价格处在牛熊趋势均线之上时
    if (close > bull_bear_ma_value)
        // 平所有空仓
        if (strategy.position_size < 0)
            strategy.close("Short", comment="平所有空仓")
            label.new(bar_index, high*1.004, text="CLOSE", color=color.gray, textcolor=color.white, style=label.style_label_up, size=size.small)
        // 当短期均线在长期均线之下时,中期均线向下穿过长期均线,平多
        if (short_ma_value < long_ma_value and ta.crossunder(mid_ma_value, long_ma_value) and volatilityCondition)
            if (strategy.position_size > 0)
                strategy.close("Long", qty=close_pct * strategy.position_size, comment="部分平多")
                label.new(bar_index, low*0.996, text="CLOSE", color=color.gray, textcolor=color.white, style=label.style_label_down, size=size.small)
else if (not enable_bull_bear and not (allow_long and allow_short))
    // 当短期均线在长期均线之上时,中期均线向上穿过长期均线,平空
    if (short_ma_value > long_ma_value and ta.crossover(mid_ma_value, long_ma_value) and volatilityCondition)
        if (strategy.position_size < 0)
            strategy.close("Short", qty=close_pct * strategy.position_size, comment="部分平空")
            label.new(bar_index, low*0.996, text="CLOSE", color=color.gray, textcolor=color.white, style=label.style_label_up, size=size.small)

    // 当短期均线在长期均线之下时,中期均线向下穿过长期均线,平多
    if (short_ma_value < long_ma_value and ta.crossunder(mid_ma_value, long_ma_value) and volatilityCondition)
        if (strategy.position_size > 0)
            strategy.close("Long", qty=close_pct * strategy.position_size, comment="部分平多")
            label.new(bar_index, high*1.004, text="CLOSE", color=color.gray, textcolor=color.white, style=label.style_label_down, size=size.small)

// 止损处理
if (strategy.position_size > 0)
    stop_level_long_user = strategy.position_avg_price * (1 - stop_loss_user)
    strategy.exit("Stop Loss", from_entry="Long", stop=stop_level_long_user)
else if (strategy.position_size < 0)
    stop_level_short_user = strategy.position_avg_price * (1 + stop_loss_user)
    strategy.exit("Stop Loss", from_entry="Short", stop=stop_level_short_user)
Detail
https://www.fmz.com/strategy/458029
Last Modified
2024-07-29 13:37:09