
10 KiB
Name
多因子融合策略Multi-factor-Fusion-Strategy-Multi-factor-Fusion-Strategy
Author
ChaoZhang
Strategy Description
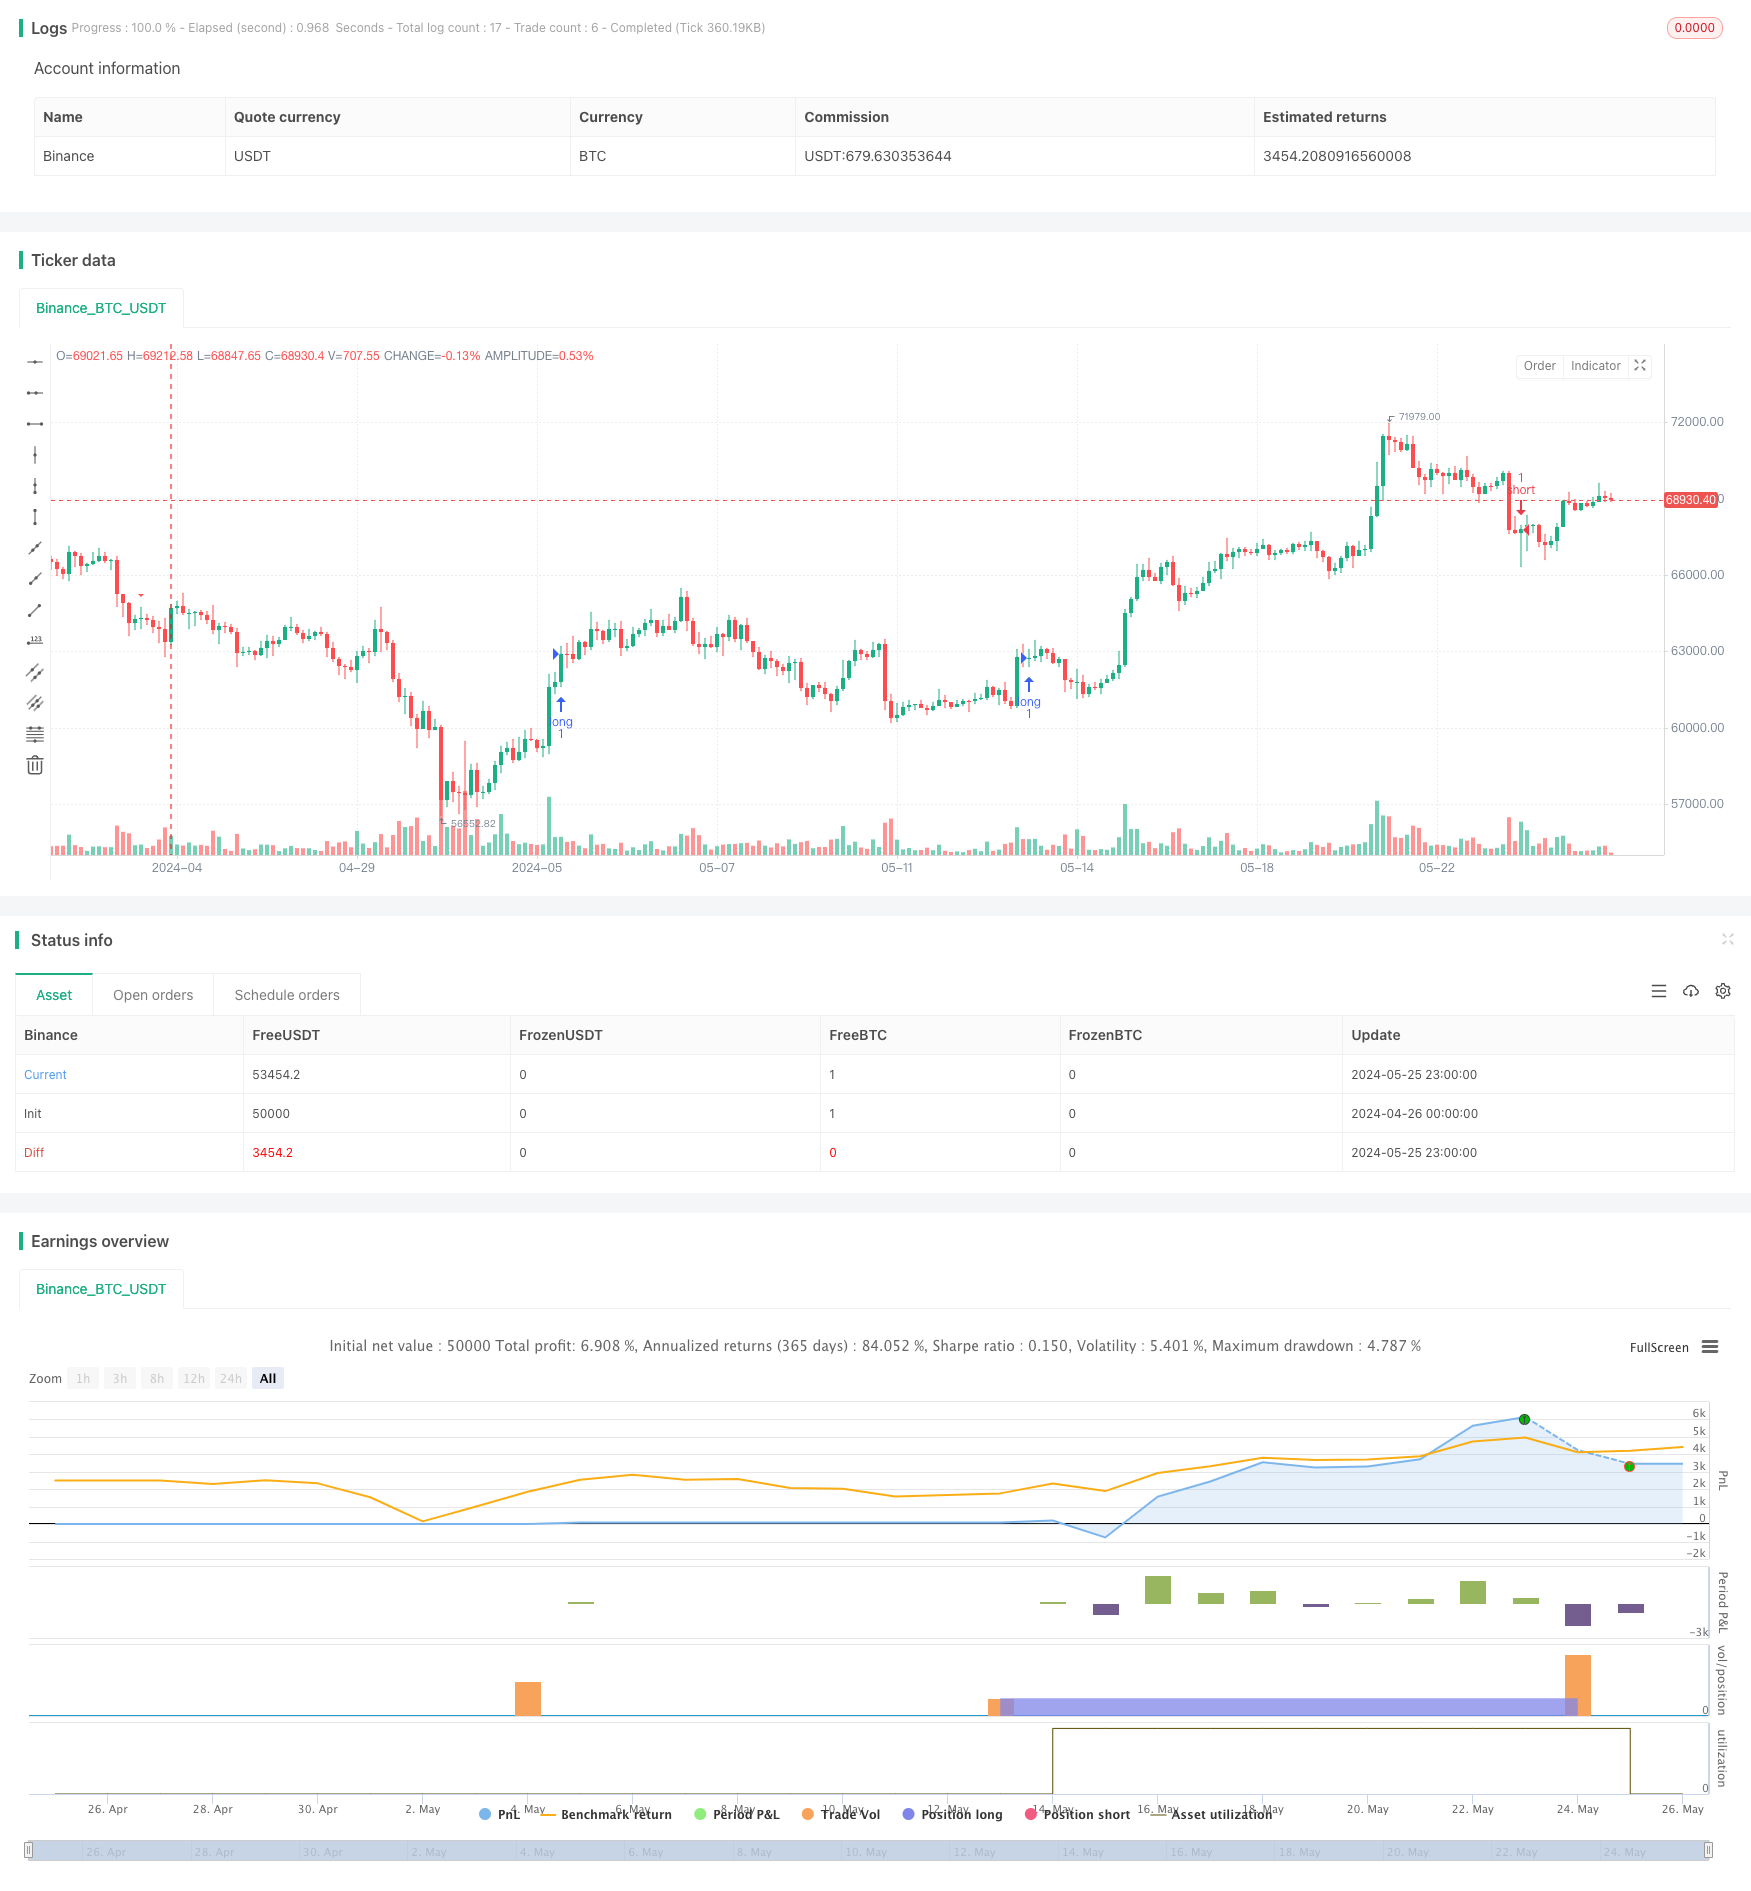
[trans]
概述
该策略是一个基于多个技术指标的交易策略,通过综合考虑Bollinger Bands (BB)、Moving Averages (MA)、MACD、RSI、Stochastic Oscillator (STOCH)和Volume Weighted Average Price (VWAP)等指标,在15分钟时间周期上生成买卖信号。当多个指标同时满足特定条件时,策略就会产生买入或卖出信号,同时设置止损和止盈价位来管理风险和锁定利润。
策略原理
- 使用15分钟的收盘价数据作为策略的主要分析对象。
- 计算Bollinger Bands指标,包括上轨、中轨和下轨。
- 计算两条不同周期的移动平均线(10周期和30周期)。
- 计算MACD指标,包括MACD线、信号线和MACD柱。
- 计算RSI指标。
- 计算Stochastic Oscillator指标,包括%K线和%D线。
- 计算VWAP指标。
- 当快速移动平均线上穿慢速移动平均线、MACD线大于信号线、RSI大于50、价格高于VWAP、%K线大于%D线时,产生买入信号。
- 当快速移动平均线下穿慢速移动平均线、MACD线小于信号线、RSI小于50、价格低于VWAP、%K线小于%D线时,产生卖出信号。
- 设置止损价和止盈价,控制风险和锁定利润。
优势分析
- 多因子融合,提高信号可靠性:该策略综合考虑了多个技术指标,这些指标从不同角度反映了市场趋势和动量,共同构成了一个更加可靠的交易信号。
- 趋势跟踪能力强:通过移动平均线的交叉和MACD指标,策略可以有效捕捉市场的主要趋势。
- 适应性强:通过RSI、Stochastic Oscillator等指标,策略可以适应不同的市场状态,在趋势和震荡行情中都有良好表现。
- 风险管理严格:策略设置了止损和止盈价位,能够有效控制单笔交易的风险敞口,同时锁定已获利润。
风险分析
- 参数优化风险:策略包含多个参数,如果参数设置不当,可能导致策略表现欠佳。因此,需要对参数进行优化和稳健性测试。
- 市场风险:策略在极端行情下可能出现失效的情况,如突发事件导致的剧烈波动等。
- 过拟合风险:如果策略参数过于优化,可能存在过拟合的风险,导致在样本外数据上表现不佳。
优化方向
- 动态止损和止盈:根据市场波动情况动态调整止损和止盈水平,以更好地适应市场。
- 引入更多因子:考虑引入更多有效的技术指标或基本面因子,如成交量、市场情绪等,以进一步提高信号的可靠性。
- 加入仓位管理:根据市场风险状况和信号强度,动态调整仓位大小,以更好地控制整体风险。
- 优化参数:定期对策略参数进行优化和调整,以适应不断变化的市场环境。
总结
该策略通过融合多个技术指标,在15分钟时间周期上产生可靠的交易信号。策略具有良好的趋势跟踪能力和风险管理措施,能够在不同市场状态下取得稳健的表现。但是,策略也存在一定的参数优化风险和过拟合风险,需要进一步优化和改进。未来可以考虑引入更多因子、动态止损止盈、仓位管理等措施,以提高策略的稳健性和盈利能力。
||
Overview
This strategy is a trading strategy based on multiple technical indicators. It generates buy and sell signals on a 15-minute time frame by comprehensively considering indicators such as Bollinger Bands (BB), Moving Averages (MA), MACD, RSI, Stochastic Oscillator (STOCH), and Volume Weighted Average Price (VWAP). When multiple indicators simultaneously meet specific conditions, the strategy generates a buy or sell signal, while setting stop-loss and take-profit levels to manage risk and lock in profits.
Strategy Principles
- Use 15-minute closing price data as the main analysis object of the strategy.
- Calculate the Bollinger Bands indicator, including upper, middle, and lower bands.
- Calculate two moving averages with different periods (10-period and 30-period).
- Calculate the MACD indicator, including MACD line, signal line, and MACD histogram.
- Calculate the RSI indicator.
- Calculate the Stochastic Oscillator indicator, including %K line and %D line.
- Calculate the VWAP indicator.
- Generate a buy signal when the fast moving average crosses above the slow moving average, MACD line is greater than the signal line, RSI is above 50, price is above VWAP, and %K line is above %D line.
- Generate a sell signal when the fast moving average crosses below the slow moving average, MACD line is less than the signal line, RSI is below 50, price is below VWAP, and %K line is below %D line.
- Set stop-loss and take-profit prices to control risk and lock in profits.
Advantage Analysis
- Multi-factor fusion improves signal reliability: The strategy comprehensively considers multiple technical indicators, which reflect market trends and momentum from different perspectives, together forming a more reliable trading signal.
- Strong trend-tracking ability: Through the crossover of moving averages and the MACD indicator, the strategy can effectively capture the main trends of the market.
- High adaptability: Through indicators such as RSI and Stochastic Oscillator, the strategy can adapt to different market states and perform well in both trending and oscillating markets.
- Strict risk management: The strategy sets stop-loss and take-profit levels, which can effectively control the risk exposure of a single transaction while locking in profits.
Risk Analysis
- Parameter optimization risk: The strategy contains multiple parameters. If the parameters are not set properly, it may lead to poor strategy performance. Therefore, parameters need to be optimized and tested for robustness.
- Market risk: The strategy may fail in extreme market conditions, such as violent fluctuations caused by sudden events.
- Overfitting risk: If the strategy parameters are overly optimized, there may be a risk of overfitting, leading to poor performance on out-of-sample data.
Optimization Directions
- Dynamic stop-loss and take-profit: Dynamically adjust stop-loss and take-profit levels according to market volatility conditions to better adapt to the market.
- Introduce more factors: Consider introducing more effective technical indicators or fundamental factors, such as trading volume, market sentiment, etc., to further improve the reliability of signals.
- Incorporate position management: Dynamically adjust position size based on market risk conditions and signal strength to better control overall risk.
- Optimize parameters: Regularly optimize and adjust strategy parameters to adapt to the constantly changing market environment.
Summary
By integrating multiple technical indicators, this strategy generates reliable trading signals on a 15-minute time frame. The strategy has good trend-tracking capabilities and risk management measures, and can achieve robust performance in different market states. However, the strategy also has certain parameter optimization risks and overfitting risks, and needs further optimization and improvement. In the future, we can consider introducing more factors, dynamic stop-loss and take-profit, position management, and other measures to improve the robustness and profitability of the strategy. [/trans]
Source (PineScript)
/*backtest
start: 2024-04-26 00:00:00
end: 2024-05-26 00:00:00
period: 3h
basePeriod: 15m
exchanges: [{"eid":"Binance","currency":"BTC_USDT"}]
*/

//@version=5
strategy("Gelişmiş Al-Sat Sinyalleri", overlay=true, process_orders_on_close=true)

// 15 dakikalık grafik verileri
fifteen_minute_close = request.security(syminfo.tickerid, "15", close)

// Stop loss ve take profit seviyelerini hesaplamak için kullanılacak oranlar
stop_loss_ratio = input.float(0.01, title="Stop Loss Oranı")
take_profit_ratio = input.float(0.02, title="Take Profit Oranı")

// Bollinger Bantları göstergesi
length = input.int(20, title="BB Dönemi")
mult = input.float(2.0, title="BB Çarpanı")
basis = ta.sma(fifteen_minute_close, length)
dev = mult * ta.stdev(fifteen_minute_close, length)
upper = basis + dev
lower = basis - dev

// Moving Averages (Hareketli Ortalamalar)
fast_ma = ta.sma(fifteen_minute_close, 10)
slow_ma = ta.sma(fifteen_minute_close, 30)

// MACD göstergesi
macd_line = ta.ema(fifteen_minute_close, 12) - ta.ema(fifteen_minute_close, 26)
macd_signal = ta.ema(macd_line, 9)
macd_hist = macd_line - macd_signal

// RSI göstergesi
rsi = ta.rsi(fifteen_minute_close, 14)

// Stochastic Oscillator (Stokastik Osilatör)
kPeriod = input.int(14, title="Stochastic %K Periyodu")
dPeriod = input.int(3, title="Stochastic %D Periyodu")
smoothK = input.int(3, title="Stochastic %K Düzleştirme")
k = ta.stoch(fifteen_minute_close, high, low, kPeriod)
d = ta.sma(k, dPeriod)

// Hacim ağırlıklı hareketli ortalamalar göstergesi (VWAP)
vwap_length = input.int(20, title="VWAP Dönemi")
vwap = ta.sma(volume * (high + low + fifteen_minute_close) / 3, vwap_length) / ta.sma(volume, vwap_length)

// Al-Sat Sinyallerini hesaplayın
long_signal = ta.crossover(fast_ma, slow_ma) and macd_line > macd_signal and rsi > 50 and fifteen_minute_close > vwap and k > d
short_signal = ta.crossunder(fast_ma, slow_ma) and macd_line < macd_signal and rsi < 50 and fifteen_minute_close < vwap and k < d

// Al ve Sat işaretlerini, yanlarında ok işaretleri olan üçgenlerle değiştirin
plotshape(series=long_signal, style=shape.triangleup, location=location.belowbar, color=color.green, size=size.small)
plotshape(series=short_signal, style=shape.triangledown, location=location.abovebar, color=color.red, size=size.small)

// Uzun ve kısa pozisyonlar için girişler
if (long_signal)
    strategy.entry("long", strategy.long)
    strategy.exit("exit_long", "long", stop=fifteen_minute_close * (1 - stop_loss_ratio), limit=fifteen_minute_close * (1 + take_profit_ratio))

if (short_signal)
    strategy.entry("short", strategy.short)
    strategy.exit("exit_short", "short", stop=fifteen_minute_close * (1 + stop_loss_ratio), limit=fifteen_minute_close * (1 - take_profit_ratio))
Detail
https://www.fmz.com/strategy/452616
Last Modified
2024-05-27 15:50:23