
17 KiB
Name
多因子均值回归策略结合随机相对强弱指标与布林带的均值回归交易系统-Multi-Factor-Mean-Reversion-Strategy-A-Mean-Reversion-Trading-System-Combining-Stochastic-RSI-and-Bollinger-Bands
Author
ianzeng123
Strategy Description
[trans]
概述
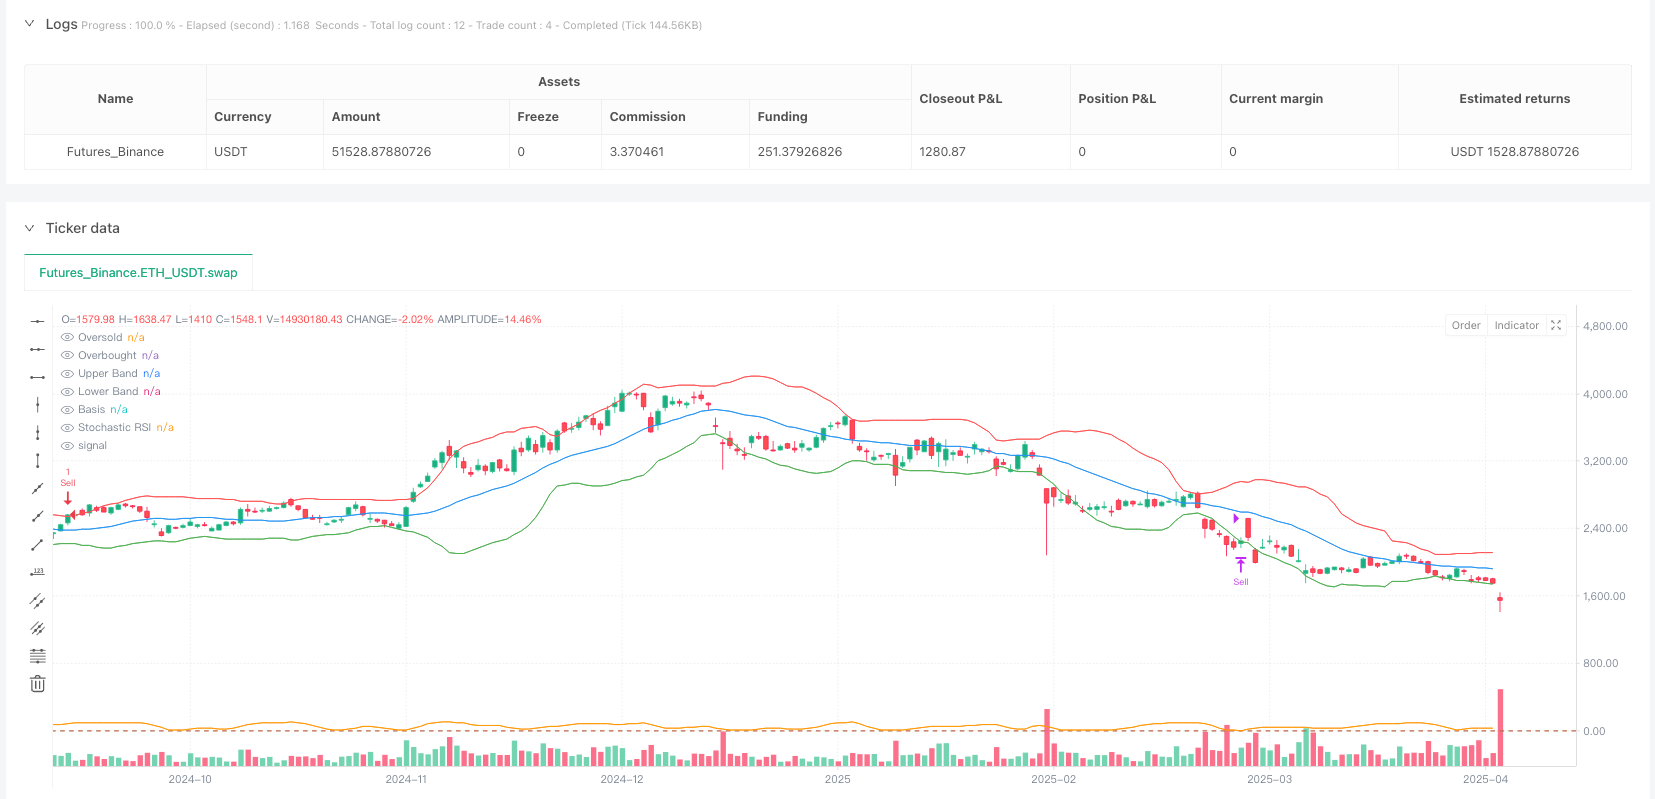
该策略是一个结合了随机相对强弱指标(Stochastic RSI)和布林带(Bollinger Bands)的多因子均值回归交易系统。它在5分钟时间框架上运行,主要用于捕捉市场超买超卖状态下的价格回归机会。策略核心思想是:当价格处于布林带下轨且随机RSI低于0.1的超卖区域时买入,当价格处于布林带上轨且随机RSI高于0.9的超买区域时卖出。这种多因子组合有效地增强了交易信号的可靠性,过滤了单一指标可能带来的虚假信号。
策略原理
该策略基于两个技术指标的结合:
-
随机相对强弱指标(Stochastic RSI):
- 首先计算基本RSI值:
rsi = ta.rsi(request.security(syminfo.tickerid, "5", close), length) - 然后基于RSI计算随机指标:
k = ta.sma(ta.stoch(rsi, rsi, rsi, length), smoothK) - 再计算K值的平滑均线:
d = ta.sma(k, smoothD) - 最终取K线和D线的平均值作为随机RSI指标:
stochRSI = (k + d) / 2
- 首先计算基本RSI值:
-
布林带(Bollinger Bands):
- 中轨(Basis):20周期简单移动平均线:
basis = ta.sma(request.security(syminfo.tickerid, "5", close), bbLength) - 标准差:
dev = bbStdDev * ta.stdev(request.security(syminfo.tickerid, "5", close), bbLength) - 上轨:中轨加上2倍标准差:
upperBand = basis + dev - 下轨:中轨减去2倍标准差:
lowerBand = basis - dev
- 中轨(Basis):20周期简单移动平均线:
交易逻辑:
- 买入条件:
stochRSI < 0.1 and close <= lowerBand(随机RSI低于0.1且价格触及或突破布林带下轨) - 卖出条件:
stochRSI > 0.9 and close >= upperBand(随机RSI高于0.9且价格触及或突破布林带上轨)
出场逻辑:
- 多头平仓:随机RSI上升至0.2以上:
exitBuyCondition = stochRSI > 0.2 - 空头平仓:随机RSI下降至0.8以下:
exitSellCondition = stochRSI < 0.8
该策略还设置了入场价格、止损和止盈参数,但在代码中止损值分别被设为0和1,止盈值分别被设为0.8和0.2,这些参数需要根据实际交易资产进行优化。
策略优势
-
多因子协同确认:通过结合随机RSI和布林带两个技术指标,策略能够更准确地识别超买超卖区域,减少假信号,提高交易效率。
-
均值回归理念:策略基于市场价格往往会回归均值的理论基础,这一理念在许多金融市场中得到验证,尤其适合波动中的横盘市场。
-
定量化的出入场标准:策略提供了明确的入场和出场条件,减少了主观判断,有助于交易者保持纪律性。
-
适应性强:策略中的各项参数(如RSI长度、布林带标准差倍数等)均可通过输入参数进行调整,使策略可以适应不同的市场环境和交易品种。
-
可视化支持:策略代码中包含了指标可视化的部分,便于交易者进行监控和分析。
-
5分钟时间框架:策略基于5分钟时间框架,能够捕捉短期交易机会,适合日内交易者使用。
策略风险
-
趋势市场下的风险:在强趋势市场中,均值回归策略可能会频繁出现错误信号,导致连续亏损。解决方法是增加趋势过滤器,仅在市场处于横盘状态时启用策略。
-
虚假突破风险:价格可能暂时突破布林带后又回归,导致错误信号。解决方法是增加确认机制,如要求价格在突破布林带后保持一定时间或幅度。
-
止损设置不合理:当前代码中的止损设置(0和1)可能不适用于实际交易。解决方法是根据交易品种的波动特性设置合理的止损比例。
-
参数优化过度:过度优化参数可能导致策略在历史数据上表现良好但在未来实盘中失效。解决方法是采用滚动窗口法进行参数优化,避免过拟合。
-
缺乏市场环境适应性:不同市场环境(如高波动率与低波动率)可能需要不同的参数设置。解决方法是建立波动率自适应机制,根据市场状况动态调整参数。
-
滑点和交易成本影响:高频交易策略受滑点和交易成本影响较大。解决方法是在回测和实盘中充分考虑这些因素,并可能需要提高信号门槛来减少交易次数。
策略优化方向
-
增加趋势过滤器:可以引入ADX(平均方向指数)等趋势指标,当ADX值高于特定阈值时(如25),表明市场处于强趋势中,此时可暂停均值回归策略或调整参数。
-
优化止损机制:当前策略的止损设置不够完善,可以考虑使用ATR(平均真实波幅)来设置动态止损,例如:
stopLoss = entryPrice - (atrValue * 1.5)(多头)或stopLoss = entryPrice + (atrValue * 1.5)(空头)。 -
增加交易量确认:在入场信号触发时,可以增加交易量确认条件,例如要求当前交易量高于前N个周期的平均交易量,以确保有足够的市场流动性支持价格反转。
-
时间过滤器:某些市场在特定时间段(如开盘和收盘前后)波动较大且不规则,可以添加时间过滤器避开这些时段。
-
引入机器学习优化:可以使用机器学习算法(如随机森林或神经网络)来优化各指标的权重或参数,使策略能够更好地适应不同市场环境。
-
增加回测稳健性测试:实施蒙特卡洛模拟或步进式回测,以评估策略在不同市场条件下的稳健性。
-
动态参数调整:根据市场波动率自动调整布林带的标准差倍数,在高波动率环境中使用更高的倍数,低波动率环境中使用更低的倍数。
总结
"多因子均值回归策略:结合随机相对强弱指标与布林带的均值回归交易系统"是一个基于技术分析的交易策略,通过结合随机RSI和布林带指标来识别市场的超买超卖状态,捕捉价格回归均值的交易机会。该策略的核心优势在于多因子确认机制和明确的定量化交易规则,但在实际应用中仍需注意趋势市场下的风险以及参数优化过度等问题。
通过增加趋势过滤器、优化止损机制、引入交易量确认和实施动态参数调整等方式,该策略有潜力在各种市场环境中取得更稳定的表现。对于追求均值回归交易机会的交易者来说,该策略提供了一个系统化的框架,但成功应用仍需交易者结合自身经验和风险管理能力进行个性化调整。 ||
Overview
This strategy is a multi-factor mean reversion trading system that combines the Stochastic Relative Strength Index (Stochastic RSI) and Bollinger Bands. It operates on a 5-minute timeframe, primarily designed to capture price reversion opportunities during market overbought and oversold conditions. The core concept of the strategy is to buy when the price is at the lower Bollinger Band and the Stochastic RSI is below 0.1 (oversold region), and to sell when the price is at the upper Bollinger Band and the Stochastic RSI is above 0.9 (overbought region). This multi-factor combination effectively enhances the reliability of trading signals, filtering out potential false signals that might arise from using a single indicator.
Strategy Principles
The strategy is based on the combination of two technical indicators:
-
Stochastic Relative Strength Index (Stochastic RSI):
- First, calculate the basic RSI value:
rsi = ta.rsi(request.security(syminfo.tickerid, "5", close), length) - Then calculate the stochastic based on RSI:
k = ta.sma(ta.stoch(rsi, rsi, rsi, length), smoothK) - Next, calculate the smoothed moving average of K:
d = ta.sma(k, smoothD) - Finally, take the average of K and D lines as the Stochastic RSI:
stochRSI = (k + d) / 2
- First, calculate the basic RSI value:
-
Bollinger Bands:
- Middle Band (Basis): 20-period simple moving average:
basis = ta.sma(request.security(syminfo.tickerid, "5", close), bbLength) - Standard Deviation:
dev = bbStdDev * ta.stdev(request.security(syminfo.tickerid, "5", close), bbLength) - Upper Band: Middle Band plus 2 times standard deviation:
upperBand = basis + dev - Lower Band: Middle Band minus 2 times standard deviation:
lowerBand = basis - dev
- Middle Band (Basis): 20-period simple moving average:
Trading Logic:
- Buy Condition:
stochRSI < 0.1 and close <= lowerBand(Stochastic RSI below 0.1 and price touching or breaking through the lower Bollinger Band) - Sell Condition:
stochRSI > 0.9 and close >= upperBand(Stochastic RSI above 0.9 and price touching or breaking through the upper Bollinger Band)
Exit Logic:
- Long Position Close: Stochastic RSI rises above 0.2:
exitBuyCondition = stochRSI > 0.2 - Short Position Close: Stochastic RSI falls below 0.8:
exitSellCondition = stochRSI < 0.8
The strategy also sets entry price, stop loss, and take profit parameters, but in the code, the stop loss values are set to 0 and 1, and take profit values are set to 0.8 and 0.2 respectively. These parameters need to be optimized based on the actual trading asset.
Strategy Advantages
-
Multi-Factor Collaborative Confirmation: By combining Stochastic RSI and Bollinger Bands, the strategy can more accurately identify overbought and oversold areas, reducing false signals and improving trading efficiency.
-
Mean Reversion Concept: The strategy is based on the theoretical foundation that market prices tend to revert to the mean, a concept that has been validated in many financial markets and is particularly suitable for ranging markets with oscillations.
-
Quantified Entry and Exit Criteria: The strategy provides clear entry and exit conditions, reducing subjective judgment and helping traders maintain discipline.
-
High Adaptability: The various parameters in the strategy (such as RSI length, Bollinger Bands standard deviation multiplier, etc.) can be adjusted through input parameters, allowing the strategy to adapt to different market environments and trading instruments.
-
Visual Support: The strategy code includes indicator visualization components, making it convenient for traders to monitor and analyze.
-
5-Minute Timeframe: The strategy is based on a 5-minute timeframe, capable of capturing short-term trading opportunities, making it suitable for intraday traders.
Strategy Risks
-
Risks in Trending Markets: In strong trending markets, mean reversion strategies may frequently generate false signals, leading to consecutive losses. The solution is to add a trend filter, enabling the strategy only when the market is ranging.
-
False Breakout Risk: Prices may temporarily break through the Bollinger Bands before reverting, causing erroneous signals. The solution is to add confirmation mechanisms, such as requiring the price to maintain a certain duration or magnitude after breaking through the Bollinger Bands.
-
Unreasonable Stop Loss Settings: The current stop loss settings in the code (0 and 1) may not be applicable to actual trading. The solution is to set reasonable stop loss percentages based on the volatility characteristics of the trading instrument.
-
Over-Optimization of Parameters: Excessive parameter optimization may cause the strategy to perform well on historical data but fail in future live trading. The solution is to use a rolling window method for parameter optimization to avoid overfitting.
-
Lack of Market Environment Adaptability: Different market environments (such as high volatility vs. low volatility) may require different parameter settings. The solution is to establish a volatility adaptive mechanism to dynamically adjust parameters based on market conditions.
-
Impact of Slippage and Trading Costs: High-frequency trading strategies are significantly affected by slippage and trading costs. The solution is to fully consider these factors in backtesting and live trading, and possibly raise signal thresholds to reduce the number of trades.
Strategy Optimization Directions
-
Add Trend Filters: Introduce trend indicators such as ADX (Average Directional Index). When the ADX value is above a specific threshold (e.g., 25), indicating that the market is in a strong trend, the mean reversion strategy can be paused or parameters adjusted.
-
Optimize Stop Loss Mechanism: The current stop loss settings in the strategy are not fully developed. Consider using ATR (Average True Range) to set dynamic stop losses, for example:
stopLoss = entryPrice - (atrValue * 1.5)(for long positions) orstopLoss = entryPrice + (atrValue * 1.5)(for short positions). -
Add Volume Confirmation: When entry signals are triggered, add volume confirmation conditions, such as requiring the current trading volume to be higher than the average trading volume of the previous N periods, to ensure sufficient market liquidity to support price reversal.
-
Time Filter: Some markets experience high and irregular volatility during specific time periods (such as around market open and close). Adding a time filter can help avoid these periods.
-
Introduce Machine Learning Optimization: Use machine learning algorithms (such as random forests or neural networks) to optimize the weights or parameters of various indicators, enabling the strategy to better adapt to different market environments.
-
Enhance Backtest Robustness Testing: Implement Monte Carlo simulations or walk-forward testing to evaluate the robustness of the strategy under different market conditions.
-
Dynamic Parameter Adjustment: Automatically adjust the standard deviation multiplier of Bollinger Bands based on market volatility, using higher multipliers in high-volatility environments and lower multipliers in low-volatility environments.
Summary
The "Multi-Factor Mean Reversion Strategy: A Mean Reversion Trading System Combining Stochastic RSI and Bollinger Bands" is a trading strategy based on technical analysis. It identifies market overbought and oversold conditions by combining Stochastic RSI and Bollinger Bands indicators to capture trading opportunities when prices revert to the mean. The core advantage of this strategy lies in its multi-factor confirmation mechanism and clear quantified trading rules. However, in practical application, attention still needs to be paid to risks in trending markets and issues such as parameter over-optimization.
By adding trend filters, optimizing stop loss mechanisms, introducing volume confirmation, and implementing dynamic parameter adjustments, this strategy has the potential to achieve more stable performance in various market environments. For traders pursuing mean reversion trading opportunities, this strategy provides a systematic framework, but successful application still requires traders to make personalized adjustments based on their own experience and risk management capabilities.[/trans]
Source (PineScript)
/*backtest
start: 2024-04-09 00:00:00
end: 2025-04-08 00:00:00
period: 1d
basePeriod: 1d
exchanges: [{"eid":"Futures_Binance","currency":"ETH_USDT"}]
*/

//@version=5
strategy("Stochastic RSI & Bollinger Bands Backtest (5 Min)", overlay=true)

// Input parameters
length = input.int(14, title="Stochastic RSI Length")
smoothK = input.int(3, title="Stochastic RSI %K")
smoothD = input.int(3, title="Stochastic RSI %D")
bbLength = input.int(20, title="Bollinger Bands Length")
bbStdDev = input.float(2.0, title="Bollinger Bands StdDev")

// Calculate Stochastic RSI on 5-minute timeframe
rsi = ta.rsi(request.security(syminfo.tickerid, "5", close), length)
k = ta.sma(ta.stoch(rsi, rsi, rsi, length), smoothK)
d = ta.sma(k, smoothD)
stochRSI = (k + d) / 2

// Calculate Bollinger Bands on 5-minute timeframe
basis = ta.sma(request.security(syminfo.tickerid, "5", close), bbLength)
dev = bbStdDev * ta.stdev(request.security(syminfo.tickerid, "5", close), bbLength)
upperBand = basis + dev
lowerBand = basis - dev

// Buy conditions
buyCondition = stochRSI < 0.1 and close <= lowerBand
sellCondition = stochRSI > 0.9 and close >= upperBand

// Plot Bollinger Bands
plot(upperBand, color=color.red, title="Upper Band")
plot(lowerBand, color=color.green, title="Lower Band")
plot(basis, color=color.blue, title="Basis")

// Plot Stochastic RSI
hline(0.1, "Oversold", color=color.green)
hline(0.9, "Overbought", color=color.red)
plot(stochRSI, color=color.orange, title="Stochastic RSI")

// Backtest logic
var float entryPrice = na
var float stopLoss = na
var float takeProfit = na

if (buyCondition and strategy.position_size == 0)
    entryPrice := close
    stopLoss := 0
    takeProfit := 0.8
    strategy.entry("Buy", strategy.long)

if (sellCondition and strategy.position_size == 0)
    entryPrice := close
    stopLoss := 1
    takeProfit := 0.2
    strategy.entry("Sell", strategy.short)

// Exit conditions
exitBuyCondition = stochRSI > 0.2
exitSellCondition = stochRSI < 0.8

if (exitBuyCondition and strategy.position_size > 0)
    strategy.close("Buy", when=exitBuyCondition)

if (exitSellCondition and strategy.position_size < 0)
    strategy.close("Sell", when=exitSellCondition)
Detail
https://www.fmz.com/strategy/489893
Last Modified
2025-04-09 17:05:23