
12 KiB
Name
多因子动量反转组合策略Multi-factor-Momentum-Reversal-Combo-Strategy
Author
ChaoZhang
Strategy Description
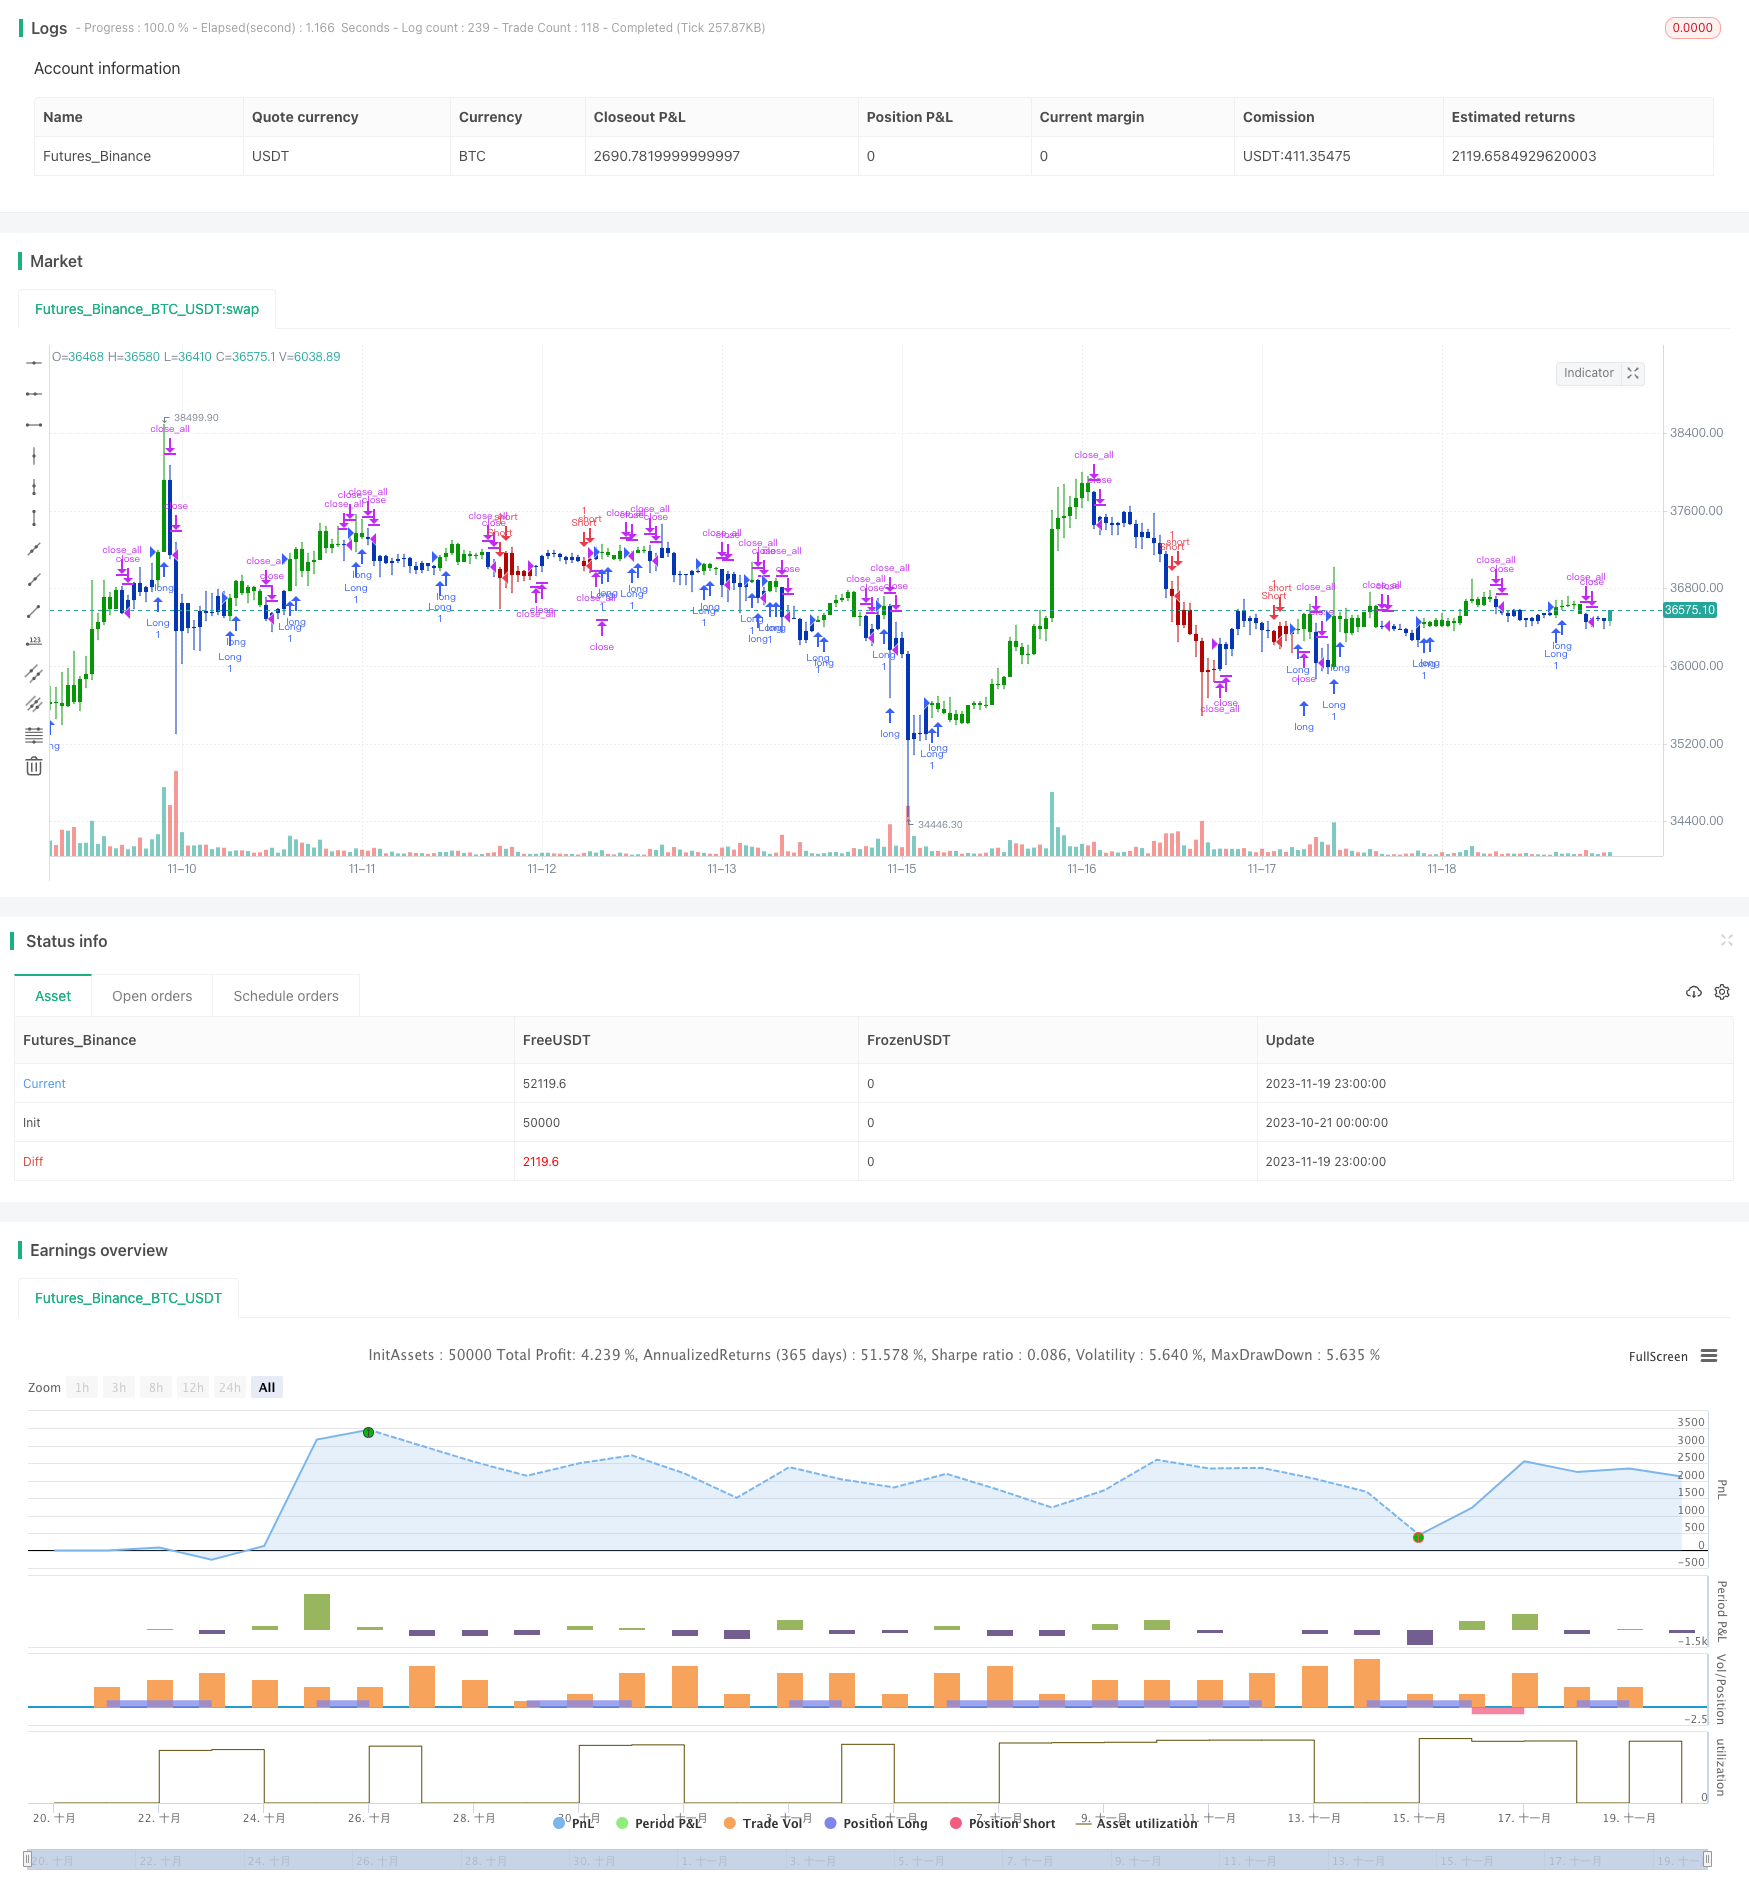
[trans]
概述
该策略是一个多因子组合策略,结合使用反转因子和动量因子,目的是发掘市场中的反转机会。策略首先使用久负反转因子识别盘整下跌后的反转机会,然后利用动量指标进行二次筛选,过滤掉大趋势下的反转假信号,从而锁定短线反转套利机会。
策略原理
该策略由两部分组成:
-
123反转因子
该部分运用日内反转思想,判断前一日收盘价与前二日收盘价的关系,配合慢速K线识别反转机会。具体逻辑是:
-
买入信号:连续两日收盘价下跌后当日收盘价上涨,且九日慢速K线低于50,则产生买入信号;
-
卖出信号:连续两日收盘价上涨后当日收盘价下跌,且九日快速K线高于50,则产生卖出信号。
-
-
埃尔格迪克动量震荡指标(ETSI)
该部分利用三EMA平滑价格动量的方法构建动量指标。指标公式如下:
xPrice1 = close - close[1]
xPrice2 = abs(close - close[1])
xSMA_R = EMA(EMA(EMA(xPrice1,r), s), u)
xSMA_aR = EMA(EMA(EMA(xPrice2, r), s), u)
xTSI = xSMA_R / xSMA_aR * 100
xEMA_TSI = EMA(xTSI, N)
其中,xSMA_R是价格动量的EMA平滑值,xSMA_aR是价格波动幅度的EMA平滑值,xTSI是两者的比值构成的动量指标,xEMA_TSI是xTSI的再次EMA平滑。该指标判断xTSI和xEMA_TSI的关系,作为交易信号方向。
最后,策略将两部分信号进行AND运算,只有当两部分因子同向发出信号时,才产生实际的交易指令。
策略优势
该策略最大的优势在于多因子设计,可以过滤假信号,发掘高质量交易机会。具体来说,主要有以下三点:
-
123反转因子可以识别盘整下跌后的短期反弹点位。
-
埃尔格迪克动量指标可以有效判断大趋势方向,避免反转信号发生在大趋势下,从而过滤假信号。
-
两部分信号采用AND运算,可以提高信号质量,增强策略稳定性。
策略风险
尽管策略采用多因子设计以控制风险,但仍存在以下主要风险:
-
反转信号可能发生在震荡趋势中,无法获利。
-
两因子之间参数设定存在主观性,可能过拟合特定品种。
-
反转后价格再次调头可能增加亏损风险。
这些风险可以通过优化参数以适应更多品种,控制反转后持仓时间,实时监控指标关系变化等方式加以缓解。
策略优化
该策略主要可以从以下几个方面进行优化:
-
调整两因子的参数,寻找更匹配的数据样本。
-
增加止损策略,控制单笔损失。
-
针对趋势品种和震荡品种使用不同参数组合。
-
增加因子权重机制,让表现更好的因子拥有更大权重。
-
增加机器学习算法,实现参数的自动优化和更新。
总结
该策略成功地结合反转因子和动量指标,实现多因子优化设计。它可以有效识别短期反转机会,并利用动量指标对信号进行二次验证,从而提高策略胜率。虽然策略仍存在一定改进空间,但其核心思路为量化策略的设计提供了良好参考。
||
Overview
This strategy is a multi-factor combo strategy that combines reversal factors and momentum factors to discover reversal opportunities in the market. The strategy first uses the long-term reversal factor to identify reversal opportunities after range-bound declines, and then uses momentum indicators for secondary screening to filter out false reversal signals under major trends, so as to lock in short-term reversal arbitrage opportunities.
Strategy Logic
The strategy consists of two parts:
-
123 Reversal Factor
This part uses the idea of intraday reversal to determine the relationship between the closing price of the previous day and the closing price of the 2 days ago to identify reversal opportunities with slow K-line. The specific logic is:
-
Buy signal: After two consecutive days of decline in the closing price, if the closing price rises on the current day, and the 9-day slow K-line is lower than 50, a buy signal is generated;
-
Sell signal: After two consecutive days of rise in the closing price, if the closing price declines on the current day, and the 9-day fast K-line is higher than 50, a sell signal is generated.
-
-
Ehlers Dynamic Momentum Oscillator (ETSI)
This part uses the three EMA smoothing price momentum method to construct a momentum indicator. The formula for the indicator is as follows:
xPrice1 = close - close[1]
xPrice2 = abs(close - close[1])
xSMA_R = EMA(EMA(EMA(xPrice1,r), s), u)
xSMA_aR = EMA(EMA(EMA(xPrice2, r), s), u)
xTSI = xSMA_R / xSMA_aR * 100
xEMA_TSI = EMA(xTSI, N)
Where xSMA_R is the EMA smoothed value of price momentum, xSMA_aR is the EMA smoothed value of price volatility, xTSI is the momentum indicator constructed from the ratio of the two, and xEMA_TSI is the secondary EMA smoothing of xTSI. The indicator determines the trading signal direction based on the relationship between xTSI and xEMA_TSI.
Finally, the strategy ANDs the signals from the two parts, and only issues actual trading orders when the signals from both factors agree.
Advantages of the Strategy
The biggest advantage of this strategy lies in its multi-factor design, which can filter out false signals and discover high-quality trading opportunities. Specifically, there are three main points:
-
The 123 reversal factor can identify short-term rebound points after range-bound declines.
-
The Ehlers momentum indicator can effectively determine the direction of the major trend to avoid reversal signals occurring under a major trend, thereby filtering out false signals.
-
The AND operation on the two signal parts can improve signal quality and enhance strategy stability.
Risks of the Strategy
Although the strategy adopts a multi-factor design to control risks, there are still the following main risks:
-
Reversal signals may occur in oscillating trends and fail to profit.
-
There is subjectivity in the parameter settings between the two factors, which may overfit specific products.
-
The risk of increased losses after the price reversal reverses again.
These risks can be mitigated by optimizing parameters to adapt to more varieties, controlling post-reversal positions, real-time monitoring of changes in indicator relationships, and other means.
Optimization Directions
The main aspects for optimizing this strategy include:
-
Adjusting the parameters of the two factors to find data samples that match better.
-
Increasing stop loss strategies to control single loss.
-
Using different parameter combinations for trending and oscillating varieties.
-
Increasing the factor weighting mechanism to give better performing factors greater weight.
-
Increasing machine learning algorithms to achieve automatic optimization and updating of parameters.
Conclusion
The strategy successfully combines reversal factors and momentum indicators to achieve multi-factor optimized design. It can effectively identify short-term reversal opportunities and use momentum indicators to conduct secondary verification of the signals, thereby improving the win rate of the strategy. Although there is still room for improvement in the strategy, its core idea provides a good reference for the design of quantitative strategies.
[/trans]
Strategy Arguments
| Argument | Default | Description |
|---|---|---|
| v_input_1 | 14 | Length |
| v_input_2 | true | KSmoothing |
| v_input_3 | 3 | DLength |
| v_input_4 | 50 | Level |
| v_input_5 | 4 | r |
| v_input_6 | 8 | s |
| v_input_7 | 6 | u |
| v_input_8 | 3 | SmthLen |
| v_input_9 | false | Trade reverse |
Source (PineScript)
/*backtest
start: 2023-10-21 00:00:00
end: 2023-11-20 00:00:00
period: 1h
basePeriod: 15m
exchanges: [{"eid":"Futures_Binance","currency":"BTC_USDT"}]
*/

//@version=4
////////////////////////////////////////////////////////////
//  Copyright by HPotter v1.0 30/07/2020
// This is combo strategies for get a cumulative signal.
//
// First strategy
// This System was created from the Book "How I Tripled My Money In The
// Futures Market" by Ulf Jensen, Page 183. This is reverse type of strategies.
// The strategy buys at market, if close price is higher than the previous close
// during 2 days and the meaning of 9-days Stochastic Slow Oscillator is lower than 50.
// The strategy sells at market, if close price is lower than the previous close price
// during 2 days and the meaning of 9-days Stochastic Fast Oscillator is higher than 50.
//
// Second strategy
// r - Length of first EMA smoothing of 1 day momentum        4
// s - Length of second EMA smoothing of 1 day smoothing      8
// u- Length of third EMA smoothing of 1 day momentum         6
// Length of EMA signal line                                  3
// Source of Ergotic TSI                                      Close
//
// This is one of the techniques described by William Blau in his book "Momentum,
// Direction and Divergence" (1995). If you like to learn more, we advise you to
// read this book. His book focuses on three key aspects of trading: momentum,
// direction and divergence. Blau, who was an electrical engineer before becoming
// a trader, thoroughly examines the relationship between price and momentum in
// step-by-step examples. From this grounding, he then looks at the deficiencies
// in other oscillators and introduces some innovative techniques, including a
// fresh twist on Stochastics. On directional issues, he analyzes the intricacies
// of ADX and offers a unique approach to help define trending and non-trending periods.
//
// WARNING:
// - For purpose educate only
// - This script to change bars colors.
////////////////////////////////////////////////////////////
Reversal123(Length, KSmoothing, DLength, Level) =>
    vFast = sma(stoch(close, high, low, Length), KSmoothing)
    vSlow = sma(vFast, DLength)
    pos = 0.0
    pos := iff(close[2] < close[1] and close > close[1] and vFast < vSlow and vFast > Level, 1,
	         iff(close[2] > close[1] and close < close[1] and vFast > vSlow and vFast < Level, -1, nz(pos[1], 0)))
	pos


ETSI(r,s,u,SmthLen) =>
    pos = 0
    xPrice = close
    xPrice1 = xPrice - xPrice[1]
    xPrice2 = abs(xPrice - xPrice[1])
    xSMA_R = ema(ema(ema(xPrice1,r), s),u)
    xSMA_aR = ema(ema(ema(xPrice2, r), s),u)
    Val1 = 100 * xSMA_R
    Val2 = xSMA_aR
    xTSI = iff (Val2 != 0, Val1 / Val2, 0)
    xEMA_TSI = ema(xTSI, SmthLen)
    pos:= iff(xTSI > xEMA_TSI, 1,
    	   iff(xTSI < xEMA_TSI, -1, nz(pos[1], 0)))
    pos

strategy(title="Combo Backtest 123 Reversal & Ergodic TSI", shorttitle="Combo", overlay = true)
Length = input(14, minval=1)
KSmoothing = input(1, minval=1)
DLength = input(3, minval=1)
Level = input(50, minval=1)
//-------------------------
r = input(4, minval=1)
s = input(8, minval=1)
u = input(6, minval=1)
SmthLen = input(3, minval=1)
reverse = input(false, title="Trade reverse")
posReversal123 = Reversal123(Length, KSmoothing, DLength, Level)
posETSI = ETSI(r,s,u,SmthLen)
pos = iff(posReversal123 == 1 and posETSI == 1 , 1,
	   iff(posReversal123 == -1 and posETSI == -1, -1, 0))
possig = iff(reverse and pos == 1, -1,
          iff(reverse and pos == -1 , 1, pos))
if (possig == 1)
    strategy.entry("Long", strategy.long)
if (possig == -1)
    strategy.entry("Short", strategy.short)
if (possig == 0)
    strategy.close_all()
barcolor(possig == -1 ? #b50404: possig == 1 ? #079605 : #0536b3 )
Detail
https://www.fmz.com/strategy/432757
Last Modified
2023-11-21 11:20:31