
11 KiB
Name
多周期趋势跟踪与ATR波动率管理策略-Multi-Timeframe-Trend-Following-Strategy-with-ATR-Volatility-Management
Author
ChaoZhang
Strategy Description
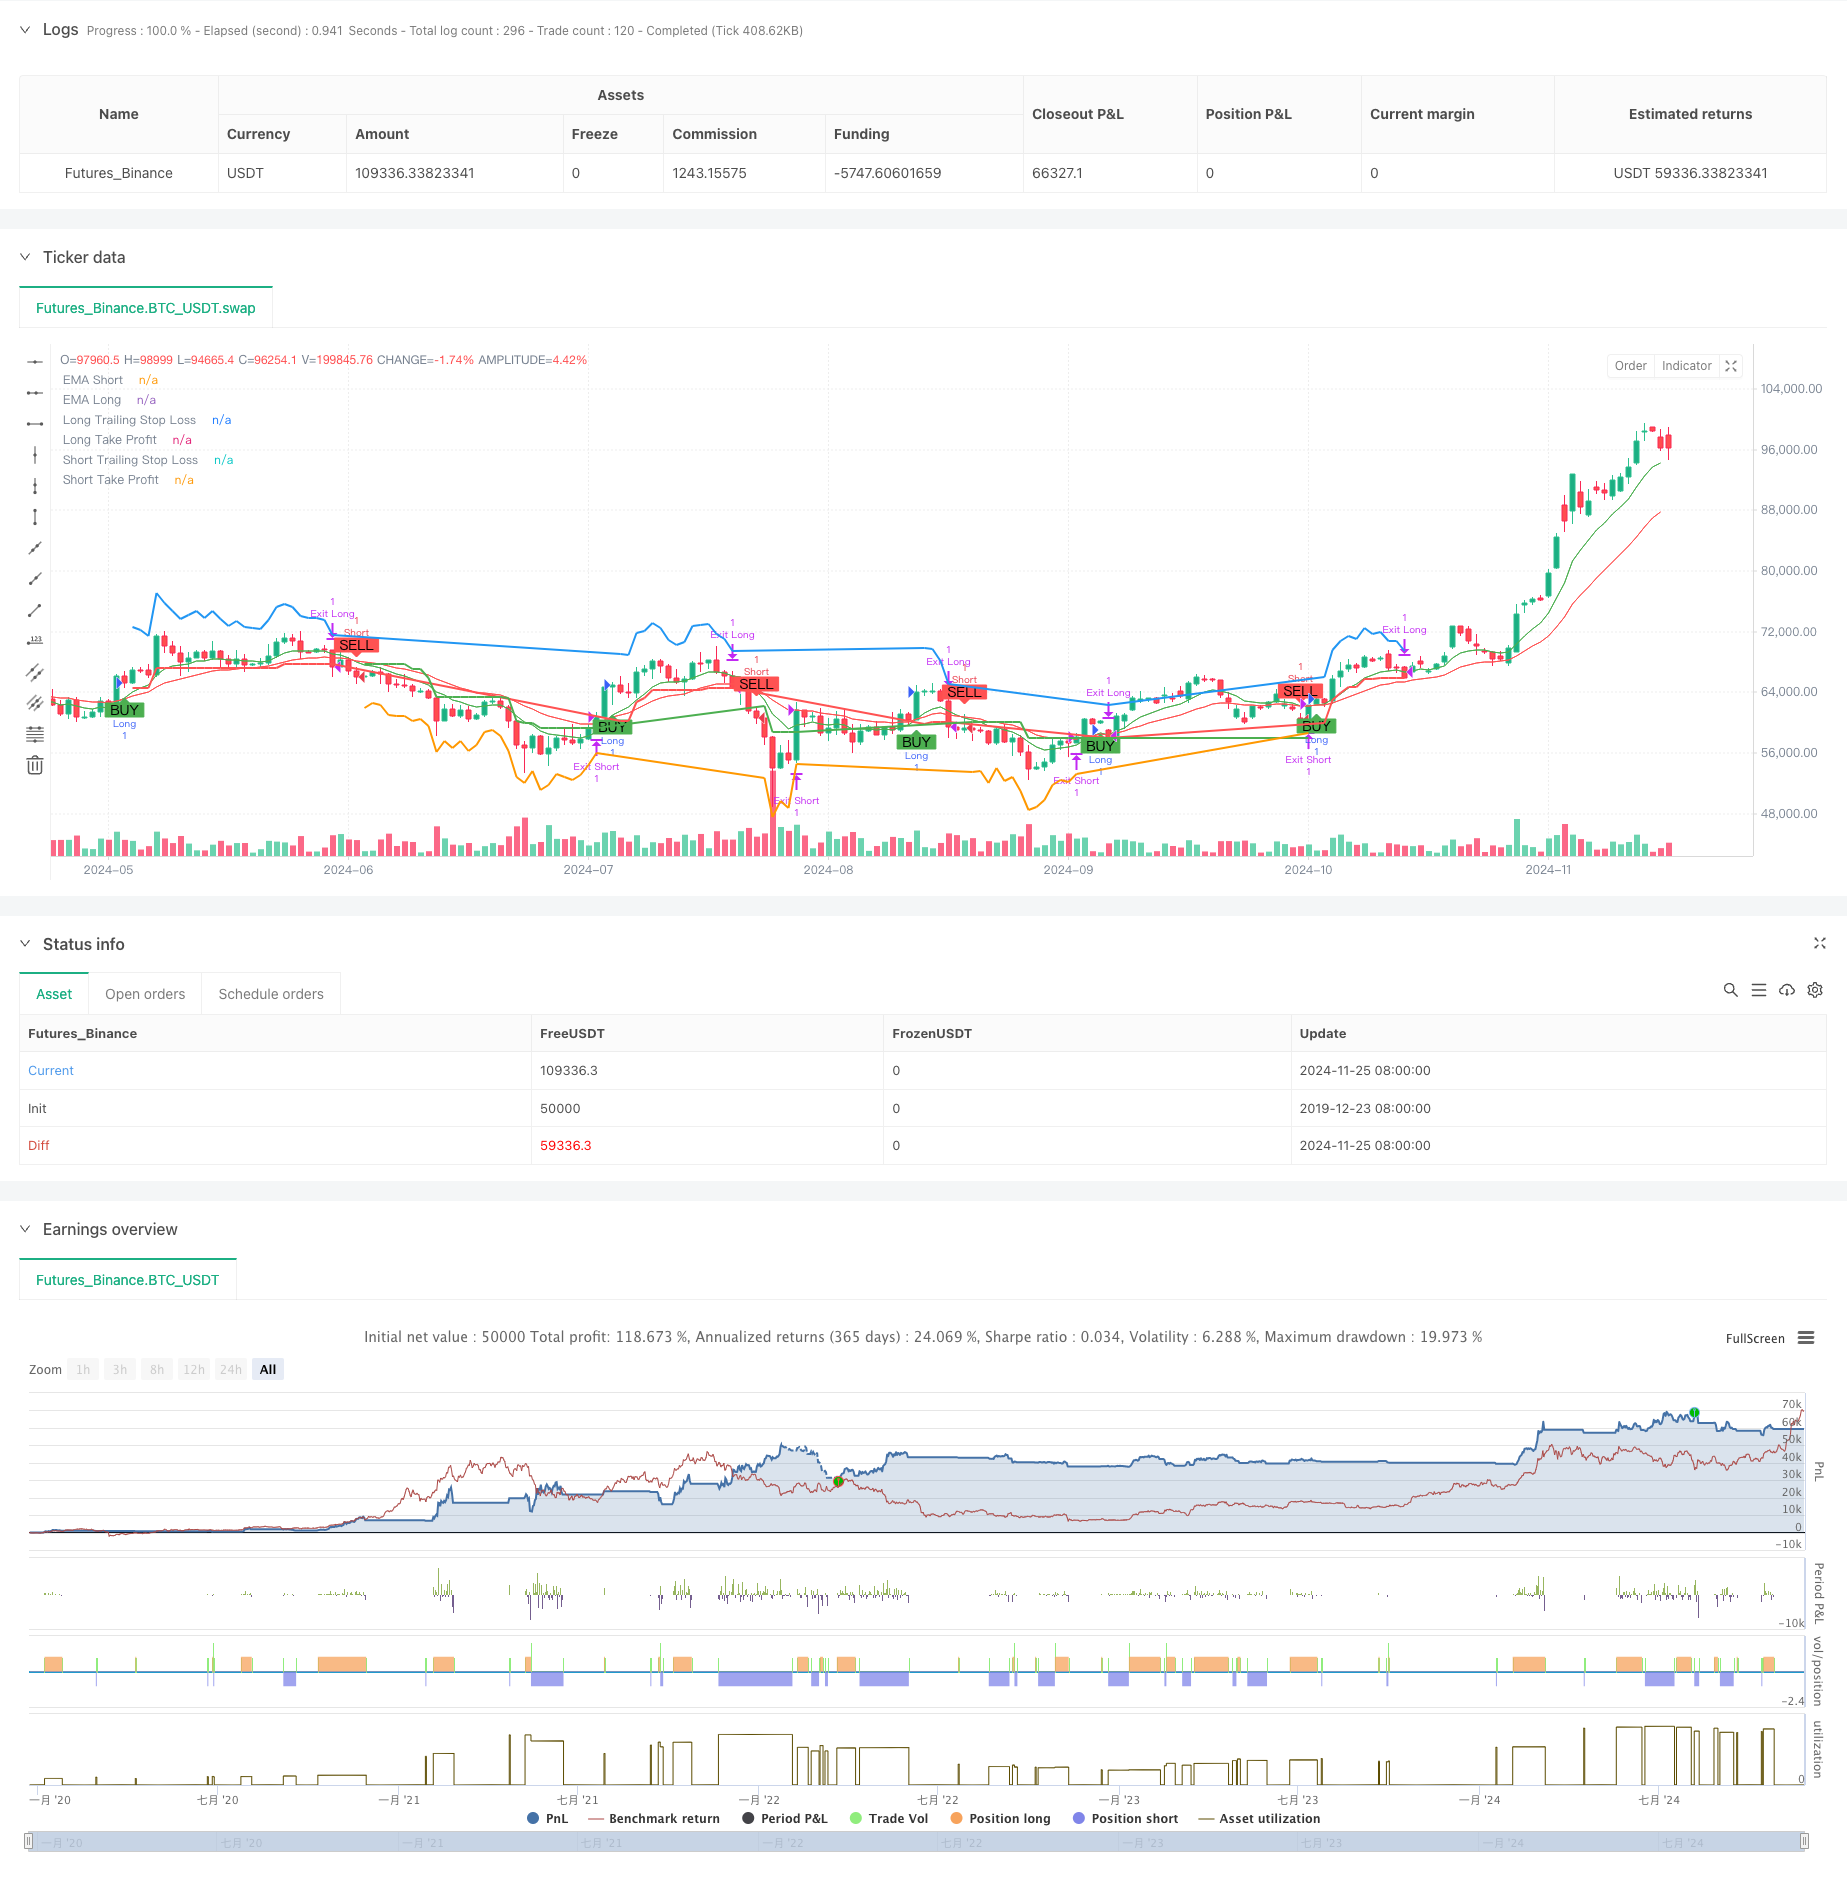
[trans]
概述
这是一个结合了多周期分析和波动率管理的趋势跟踪策略。策略核心采用双均线交叉判断趋势方向,通过RSI指标进行超买超卖过滤,引入更高时间周期EMA确认整体趋势,并利用ATR指标动态管理止损和获利目标。该策略通过多重技术指标的配合使用,既保证了交易信号的可靠性,又实现了对风险的有效控制。
策略原理
策略的核心交易逻辑分为以下几个关键部分:
- 趋势识别:使用短周期和长周期EMA的交叉来识别趋势变化,当短期EMA上穿长期EMA时产生做多信号,下穿时产生做空信号。
- 趋势确认:引入更高时间周期的EMA作为趋势过滤器,只有当价格位于高周期EMA之上时才允许做多,反之才允许做空。
- 波动率过滤:使用RSI指标进行超买超卖判断,防止在过度追涨杀跌的情况下入场。
- 仓位管理:基于ATR设置动态的止损和获利目标,随着价格变动自动调整止损位置,保护既有利润。
- 多维度防护:策略通过多个技术指标的综合运用,构建了一个完整的交易决策系统。
策略优势
- 信号可靠性高:通过多重技术指标的配合使用,显著提高了交易信号的可靠性。
- 风险控制完善:采用基于ATR的动态止损方案,能够根据市场波动性自适应调整止损位置。
- 趋势把握准确:利用多周期分析方法,提高了对主要趋势的判断准确度。
- 获利目标灵活:take-profit设置也基于ATR动态调整,在保证盈利的同时不会过早离场。
- 适应性强:策略参数可调整性强,能够适应不同市场环境。
策略风险
- 震荡市场风险:在横盘震荡行情下可能频繁交易导致亏损。
- 滑点风险:在波动剧烈时期,实际成交价格可能与理论价格存在较大偏差。
- 假突破风险:可能在短期突破后出现反转,导致止损出场。
- 参数敏感性:不同参数组合对策略表现影响较大,需要充分测试。
策略优化方向
- 市场环境识别:可以添加趋势强度指标,在震荡市场自动降低仓位或暂停交易。
- 入场时机优化:可以结合成交量指标,提高入场信号的可靠性。
- 动态参数调整:可以根据市场波动率自动调整EMA周期和ATR倍数。
- 分批建仓方案:可以设计分批建仓和减仓机制,降低单一价格点位的风险。
- 仓位管理优化:可以基于账户风险和市场波动性动态调整持仓规模。
总结
这是一个设计完善的趋势跟踪策略,通过多周期分析和波动率管理实现了较好的风险收益特征。策略的核心优势在于多重技术指标的有机结合,既保证了交易的可靠性,又实现了风险的有效控制。虽然存在一些潜在风险,但通过持续优化和完善,策略的整体表现仍有提升空间。要充分重视参数优化和回测验证,在实盘交易中严格执行风险控制措施。 ||
Overview
This is a trend following strategy that combines multi-timeframe analysis and volatility management. The strategy core uses dual EMA crossover for trend direction, RSI indicator for overbought/oversold filtering, incorporates higher timeframe EMA for overall trend confirmation, and utilizes ATR indicator for dynamic stop-loss and profit target management. Through the coordinated use of multiple technical indicators, the strategy ensures both signal reliability and effective risk control.
Strategy Principles
The core trading logic consists of the following key components:
- Trend Identification: Uses crossovers of short-period and long-period EMAs to identify trend changes, generating long signals when short EMA crosses above long EMA and short signals when it crosses below.
- Trend Confirmation: Incorporates higher timeframe EMA as a trend filter, allowing long positions only when price is above the higher timeframe EMA and short positions when below.
- Volatility Filtering: Uses RSI indicator for overbought/oversold judgment to prevent entry during excessive momentum.
- Position Management: Sets dynamic stop-loss and profit targets based on ATR, automatically adjusting stop-loss positions as price moves to protect existing profits.
- Multi-dimensional Protection: Constructs a complete trading decision system through the comprehensive use of multiple technical indicators.
Strategy Advantages
- High Signal Reliability: Significantly improves trading signal reliability through the combination of multiple technical indicators.
- Comprehensive Risk Control: Adopts ATR-based dynamic stop-loss strategy that adaptively adjusts stop positions based on market volatility.
- Accurate Trend Capture: Improves major trend judgment accuracy through multi-timeframe analysis.
- Flexible Profit Targets: Take-profit levels also dynamically adjust based on ATR, ensuring profits while avoiding premature exits.
- Strong Adaptability: Strategy parameters are highly adjustable to adapt to different market environments.
Strategy Risks
- Ranging Market Risk: May result in frequent trading losses during sideways consolidation periods.
- Slippage Risk: Actual execution prices may significantly deviate from theoretical prices during highly volatile periods.
- False Breakout Risk: May exit on stop-loss after short-term breakouts followed by reversals.
- Parameter Sensitivity: Different parameter combinations significantly impact strategy performance, requiring thorough testing.
Strategy Optimization Directions
- Market Environment Recognition: Can add trend strength indicators to automatically reduce position size or pause trading in ranging markets.
- Entry Timing Optimization: Can incorporate volume indicators to improve entry signal reliability.
- Dynamic Parameter Adjustment: Can automatically adjust EMA periods and ATR multipliers based on market volatility.
- Scaled Position Building: Can design scaled entry and exit mechanisms to reduce single price point risk.
- Position Management Optimization: Can dynamically adjust position size based on account risk and market volatility.
Summary
This is a well-designed trend following strategy that achieves favorable risk-reward characteristics through multi-timeframe analysis and volatility management. The core advantage lies in the organic combination of multiple technical indicators, ensuring both trading reliability and effective risk control. While some potential risks exist, the strategy's overall performance still has room for improvement through continuous optimization and refinement. It's crucial to focus on parameter optimization and backtesting validation while strictly implementing risk control measures in live trading.[/trans]
Source (PineScript)
/*backtest
start: 2019-12-23 08:00:00
end: 2024-11-26 00:00:00
period: 1d
basePeriod: 1d
exchanges: [{"eid":"Futures_Binance","currency":"BTC_USDT"}]
*/

//@version=5
strategy("Trend Following with ATR and MTF Confirmation", overlay=true)

// Parameters
emaShortPeriod = input.int(9, title="Short EMA Period", minval=1)
emaLongPeriod = input.int(21, title="Long EMA Period", minval=1)
rsiPeriod = input.int(14, title="RSI Period", minval=1)
rsiOverbought = input.int(70, title="RSI Overbought", minval=50)
rsiOversold = input.int(30, title="RSI Oversold", minval=1)
atrPeriod = input.int(14, title="ATR Period", minval=1)
atrMultiplier = input.float(1.5, title="ATR Multiplier", minval=0.1)
takeProfitATRMultiplier = input.float(2.0, title="Take Profit ATR Multiplier", minval=0.1)

// Multi-timeframe settings
htfEMAEnabled = input.bool(true, title="Use Higher Timeframe EMA Confirmation?", inline="htf")
htfEMATimeframe = input.timeframe("D", title="Higher Timeframe", inline="htf")

// Select trade direction
tradeDirection = input.string("Both", title="Trade Direction", options=["Both", "Long", "Short"])

// Calculating indicators
emaShort = ta.ema(close, emaShortPeriod)
emaLong = ta.ema(close, emaLongPeriod)
rsiValue = ta.rsi(close, rsiPeriod)
atrValue = ta.atr(atrPeriod)

// Higher timeframe EMA confirmation
htfEMALong = request.security(syminfo.tickerid, htfEMATimeframe, ta.ema(close, emaLongPeriod))

// Trading conditions
longCondition = ta.crossover(emaShort, emaLong) and rsiValue < rsiOverbought and (not htfEMAEnabled or close > htfEMALong)
shortCondition = ta.crossunder(emaShort, emaLong) and rsiValue > rsiOversold and (not htfEMAEnabled or close < htfEMALong)

// Plotting EMAs
plot(emaShort, title="EMA Short", color=color.green)
plot(emaLong, title="EMA Long", color=color.red)

// Trailing Stop-Loss and Take-Profit levels
var float trailStopLoss = na
var float trailTakeProfit = na

// Exit conditions
var bool exitLongCondition = na
var bool exitShortCondition = na

if (strategy.position_size != 0)
    if (strategy.position_size > 0) // Long Position
        trailStopLoss := na(trailStopLoss) ? close - atrValue * atrMultiplier : math.max(trailStopLoss, close - atrValue * atrMultiplier)
        trailTakeProfit := close + atrValue * takeProfitATRMultiplier
        exitLongCondition := close <= trailStopLoss or close >= trailTakeProfit
        strategy.exit("Exit Long", "Long", stop=trailStopLoss, limit=trailTakeProfit, when=exitLongCondition)
    else // Short Position
        trailStopLoss := na(trailStopLoss) ? close + atrValue * atrMultiplier : math.min(trailStopLoss, close + atrValue * atrMultiplier)
        trailTakeProfit := close - atrValue * takeProfitATRMultiplier
        exitShortCondition := close >= trailStopLoss or close <= trailTakeProfit
        strategy.exit("Exit Short", "Short", stop=trailStopLoss, limit=trailTakeProfit, when=exitShortCondition)

// Strategy Entry
if (longCondition and (tradeDirection == "Both" or tradeDirection == "Long"))
    strategy.entry("Long", strategy.long)

if (shortCondition and (tradeDirection == "Both" or tradeDirection == "Short"))
    strategy.entry("Short", strategy.short)

// Plotting Buy/Sell signals
plotshape(series=longCondition, title="Buy Signal", location=location.belowbar, color=color.green, style=shape.labelup, text="BUY")
plotshape(series=shortCondition, title="Sell Signal", location=location.abovebar, color=color.red, style=shape.labeldown, text="SELL")

// Plotting Trailing Stop-Loss and Take-Profit levels
plot(strategy.position_size > 0 ? trailStopLoss : na, title="Long Trailing Stop Loss", color=color.red, linewidth=2, style=plot.style_line)
plot(strategy.position_size < 0 ? trailStopLoss : na, title="Short Trailing Stop Loss", color=color.green, linewidth=2, style=plot.style_line)
plot(strategy.position_size > 0 ? trailTakeProfit : na, title="Long Take Profit", color=color.blue, linewidth=2, style=plot.style_line)
plot(strategy.position_size < 0 ? trailTakeProfit : na, title="Short Take Profit", color=color.orange, linewidth=2, style=plot.style_line)

// Alerts
alertcondition(longCondition, title="Buy Alert", message="Buy Signal Triggered")
alertcondition(shortCondition, title="Sell Alert", message="Sell Signal Triggered")
alertcondition(exitLongCondition, title="Long Exit Alert", message="Long Position Closed")
alertcondition(exitShortCondition, title="Short Exit Alert", message="Short Position Closed")
Detail
https://www.fmz.com/strategy/473154
Last Modified
2024-11-27 16:39:41