
8.3 KiB
Name
多周期趋势跟踪与成交量确认策略-Multi-Period-Trend-Following-with-Volume-Confirmation-Strategy
Author
ianzeng123
Strategy Description
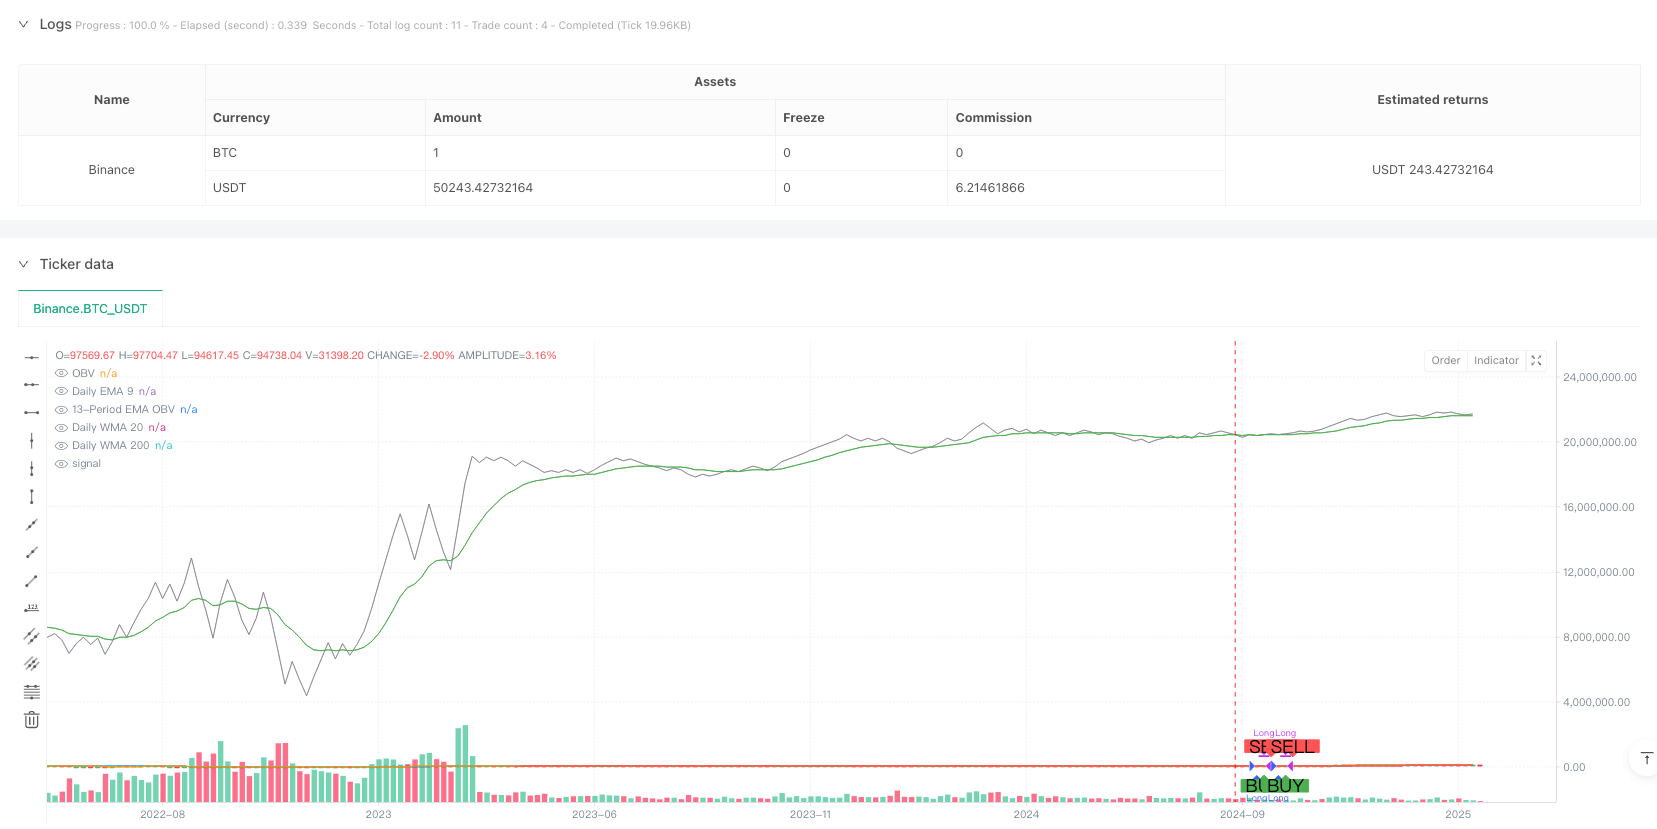
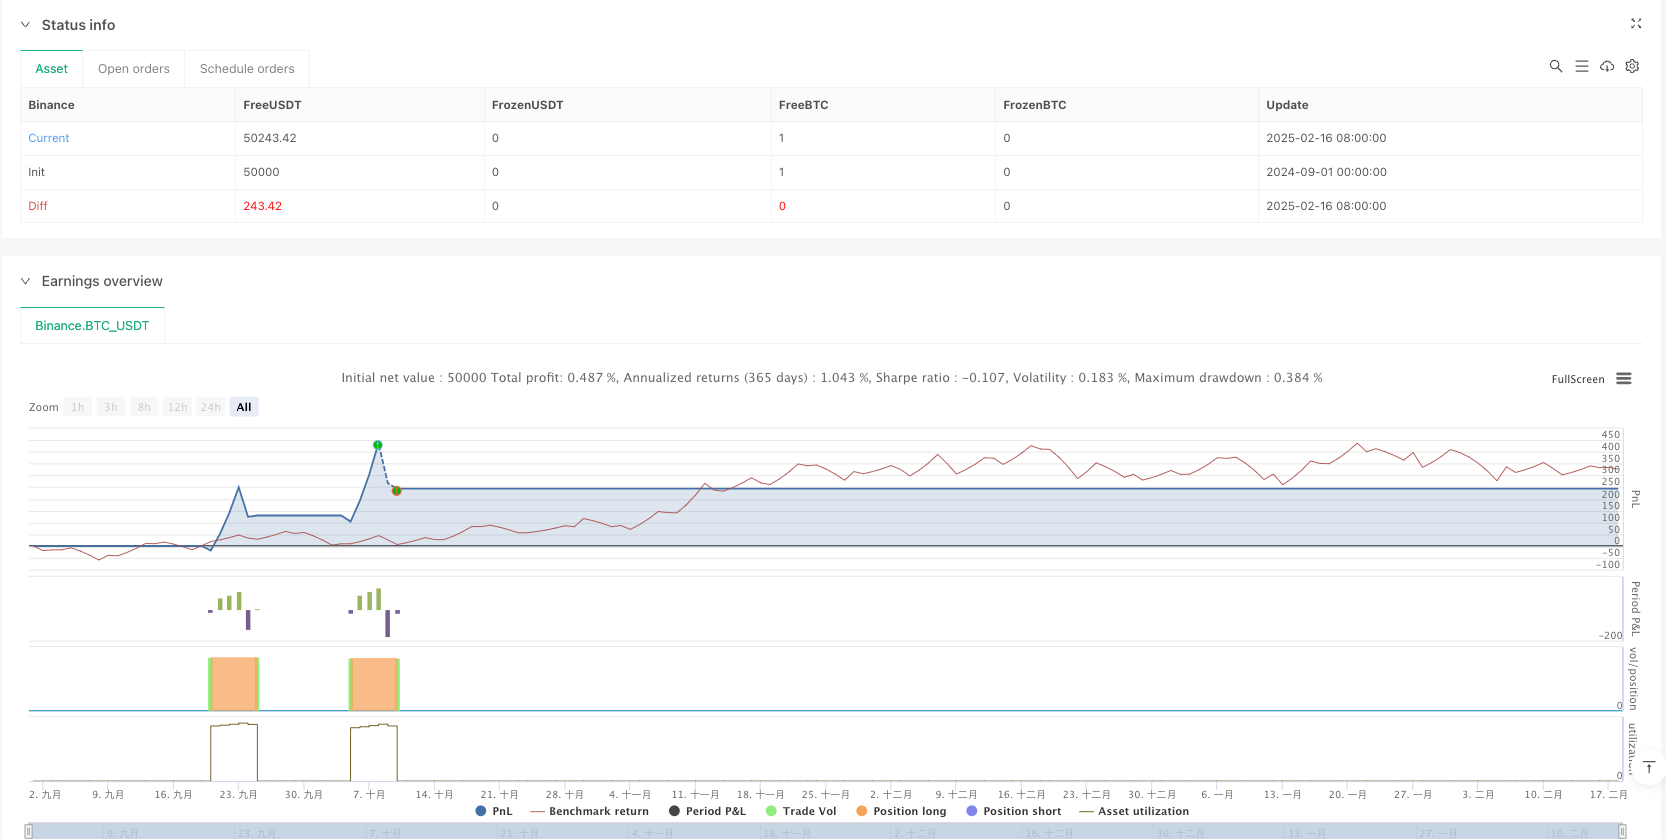
[trans]
概述
该策略是一个结合了多周期移动平均线和成交量分析的趋势跟踪系统。策略通过日线周期的EMA9、WMA20和WMA200三条均线来确认整体趋势,同时引入OBV(On Balance Volume)指标及其EMA进行交易量确认,实现更稳健的趋势跟踪交易。
策略原理
策略运作基于两个核心条件:
- 趋势确认 - 通过判断三条日线均线(EMA9、WMA20、WMA200)是否都处于上升状态来确认趋势方向。当三条均线都向上倾斜时,表明各个时间周期都呈现多头趋势。
- 成交量确认 - 使用OBV指标及其13周期EMA进行成交量分析。当OBV的EMA位于OBV之上时,表明成交量支撑价格上涨,确认趋势有效性。 只有当这两个条件同时满足时,策略才会产生做多信号。当任一条件不成立时,策略会平仓退出。
策略优势
- 多重时间框架分析 - 通过综合考虑短期(EMA9)、中期(WMA20)和长期(WMA200)趋势,降低假突破风险。
- 成交量支撑 - 引入OBV指标分析,确保价格走势得到成交量的配合支撑。
- 风险控制完善 - 采用百分比仓位管理和手续费考虑,更符合实际交易环境。
- 可视化支持 - 通过清晰的图形标记帮助交易者理解入场和出场时机。
策略风险
- 趋势反转滞后 - 由于使用多条均线确认,可能在趋势反转初期反应较慢。
- 震荡市不适用 - 在横盘整理阶段,频繁的假突破可能导致过多交易。
- 资金成本考虑 - 0.1%的手续费在高频交易中可能显著影响收益。
策略优化方向
- 引入波动率指标 - 可考虑添加ATR等波动率指标,在不同市场环境下动态调整仓位。
- 完善止损机制 - 建议增加跟踪止损功能,更好地保护盈利。
- 市场环境过滤 - 可添加市场环境判断指标,在震荡市中降低交易频率或暂停交易。
- 优化参数选择 - 考虑针对不同市场和品种,对均线周期和OBV参数进行优化。
总结
该策略通过结合多周期趋势分析和成交量确认,构建了一个相对完整的趋势跟踪系统。策略逻辑清晰,风险控制合理,但仍有优化空间。建议交易者在实盘中谨慎测试,根据具体市场特点进行参数调整。 ||
Overview
This strategy is a trend-following system that combines multi-period moving averages with volume analysis. It uses daily EMA9, WMA20, and WMA200 to confirm overall trends, while incorporating OBV (On Balance Volume) indicator and its EMA for volume confirmation, achieving more robust trend-following trading.
Strategy Principles
The strategy operates based on two core conditions:
- Trend Confirmation - Determines trend direction by checking if three daily moving averages (EMA9, WMA20, WMA200) are all in upward trends. When all three moving averages are sloping upward, it indicates bullish trends across different time periods.
- Volume Confirmation - Uses OBV indicator and its 13-period EMA for volume analysis. When OBV's EMA is above OBV, it confirms the trend's validity through volume support. The strategy generates long signals only when both conditions are met simultaneously. Positions are closed when either condition fails.
Strategy Advantages
- Multi-timeframe Analysis - Reduces false breakout risks by considering short-term (EMA9), medium-term (WMA20), and long-term (WMA200) trends.
- Volume Support - Incorporates OBV indicator analysis to ensure price movements are supported by volume.
- Comprehensive Risk Control - Implements percentage-based position management and considers commission costs, better reflecting real trading conditions.
- Visual Support - Helps traders understand entry and exit timing through clear graphical markers.
Strategy Risks
- Trend Reversal Lag - May respond slowly to trend reversals due to multiple moving average confirmations.
- Ineffective in Ranging Markets - Frequent false breakouts during consolidation phases may lead to excessive trading.
- Capital Cost Consideration - 0.1% commission may significantly impact returns in high-frequency trading.
Strategy Optimization Directions
- Incorporate Volatility Indicators - Consider adding ATR or similar indicators for dynamic position sizing in different market conditions.
- Improve Stop Loss Mechanism - Recommend adding trailing stop loss functionality for better profit protection.
- Market Environment Filtering - Add market environment assessment indicators to reduce trading frequency or pause trading during ranging markets.
- Optimize Parameters - Consider optimizing moving average periods and OBV parameters for different markets and instruments.
Summary
This strategy builds a relatively complete trend-following system by combining multi-period trend analysis with volume confirmation. The strategy logic is clear and risk control is reasonable, though there remains room for optimization. Traders are advised to test carefully in live trading and adjust parameters according to specific market characteristics.[/trans]
Source (PineScript)
/*backtest
start: 2024-09-01 00:00:00
end: 2025-02-18 08:00:00
period: 5d
basePeriod: 5d
exchanges: [{"eid":"Binance","currency":"BTC_USDT"}]
*/

//@version=6
strategy("Strategy: Daily MAs + OBV", overlay=true, initial_capital=10000, default_qty_type=strategy.percent_of_equity, default_qty_value=10, commission_type=strategy.commission.percent, commission_value=0.1)

//=== Daily Moving Averages Calculation =========================
// Get daily timeframe values using request.security.
dailyEMA9   = request.security(syminfo.tickerid, "D", ta.ema(close, 9))
dailyWMA20  = request.security(syminfo.tickerid, "D", ta.wma(close, 20))
dailyWMA200 = request.security(syminfo.tickerid, "D", ta.wma(close, 200))

// Check if each moving average is trending upward (current > previous).
ema9_up   = dailyEMA9   > nz(dailyEMA9[1])
wma20_up  = dailyWMA20  > nz(dailyWMA20[1])
wma200_up = dailyWMA200 > nz(dailyWMA200[1])

trend_condition = ema9_up and wma20_up and wma200_up

//=== OBV and its 13-period EMA Calculation ================================
// Calculate OBV manually using a cumulative sum.
obv_val = ta.cum(close > close[1] ? volume : (close < close[1] ? -volume : 0))
// 13-period EMA of the OBV.
ema13_obv = ta.ema(obv_val, 13)

// Condition: 13-period EMA of OBV must be above the OBV value.
obv_condition = ema13_obv > obv_val

//=== Entry Condition ===================================================
// Both trend and OBV conditions must be met.
buy_condition = trend_condition and obv_condition

//=== Entry and Exit Orders =============================================
// Enter a long position when the buy condition is met and no position is open.
if buy_condition and strategy.position_size <= 0
    strategy.entry("Long", strategy.long)

// Exit the position when the condition is no longer met.
if not buy_condition and strategy.position_size > 0
    strategy.close("Long")

//=== Explicit Entry and Exit Markers ====================================
// Determine the exact bar where entry and exit occur.
entry_signal = (strategy.position_size > 0 and (strategy.position_size[1] <= 0))
exit_signal  = (strategy.position_size == 0 and (strategy.position_size[1] > 0))

plotshape(entry_signal, title="Entry Signal", location=location.belowbar, style=shape.labelup, text="BUY", color=color.new(color.green, 0), size=size.normal)
plotshape(exit_signal, title="Exit Signal", location=location.abovebar, style=shape.labeldown, text="SELL", color=color.new(color.red, 0), size=size.normal)

//=== Plots for Visualization ===============================================
// Plot daily moving averages.
plot(dailyEMA9, color=color.blue, title="Daily EMA 9")
plot(dailyWMA20, color=color.orange, title="Daily WMA 20")
plot(dailyWMA200, color=color.red, title="Daily WMA 200")

// Plot OBV and its 13-period EMA using color.new() to specify transparency.
plot(obv_val, color=color.new(color.gray, 30), title="OBV")
plot(ema13_obv, color=color.new(color.green, 0), title="13-Period EMA OBV")
Detail
https://www.fmz.com/strategy/482795
Last Modified
2025-02-20 11:23:31