
14 KiB
Name
多周期超级趋势百分比风控策略-Multi-Period-Supertrend-Percentage-Risk-Management-Strategy
Author
ianzeng123
Strategy Description
[trans]## 概述
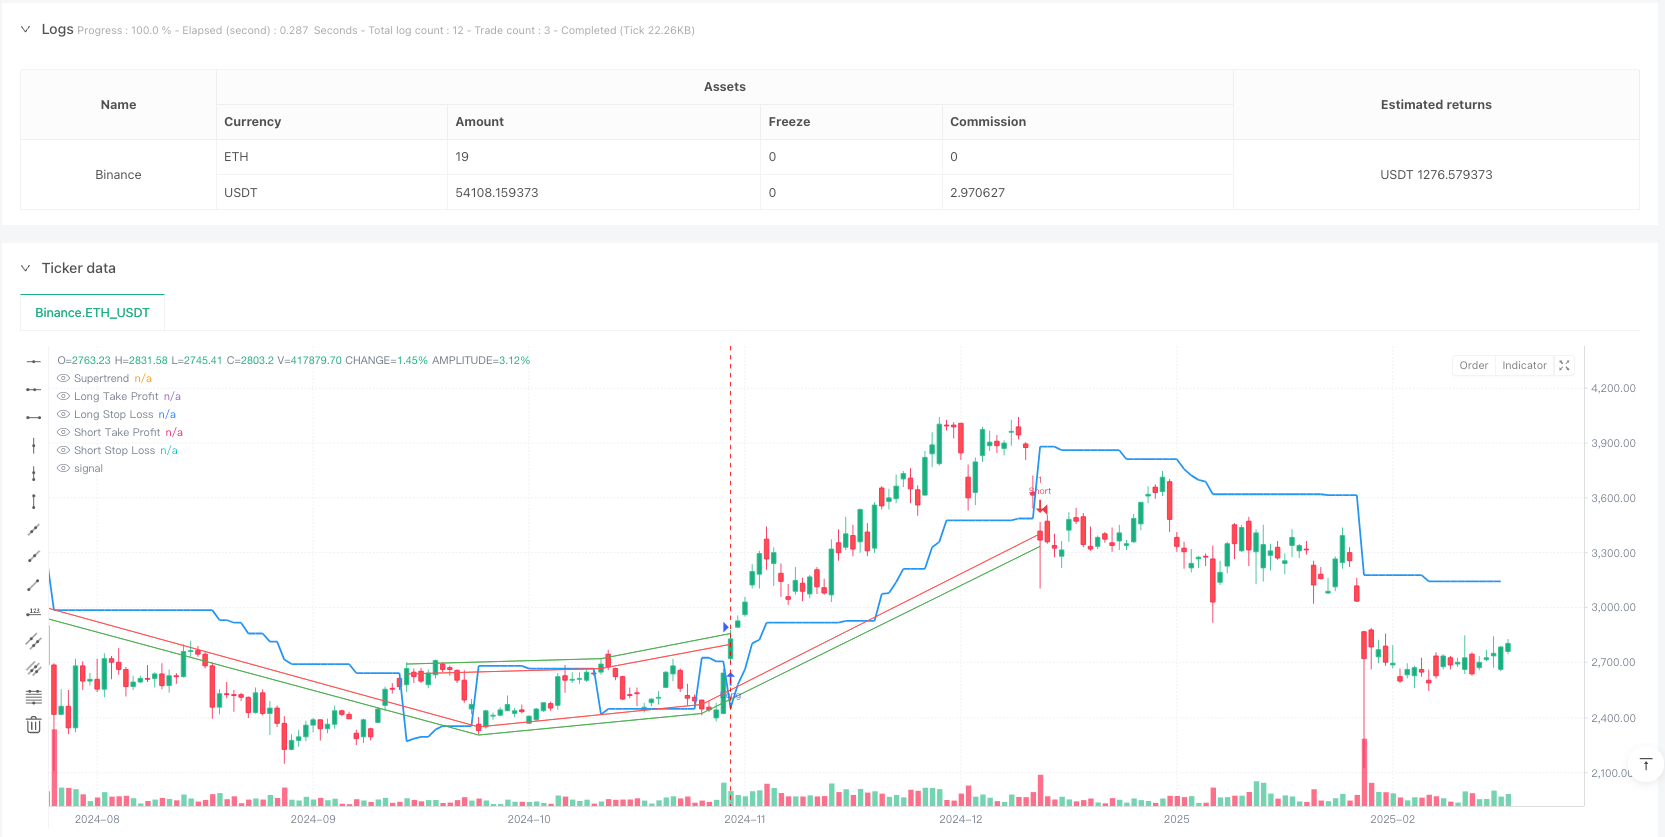
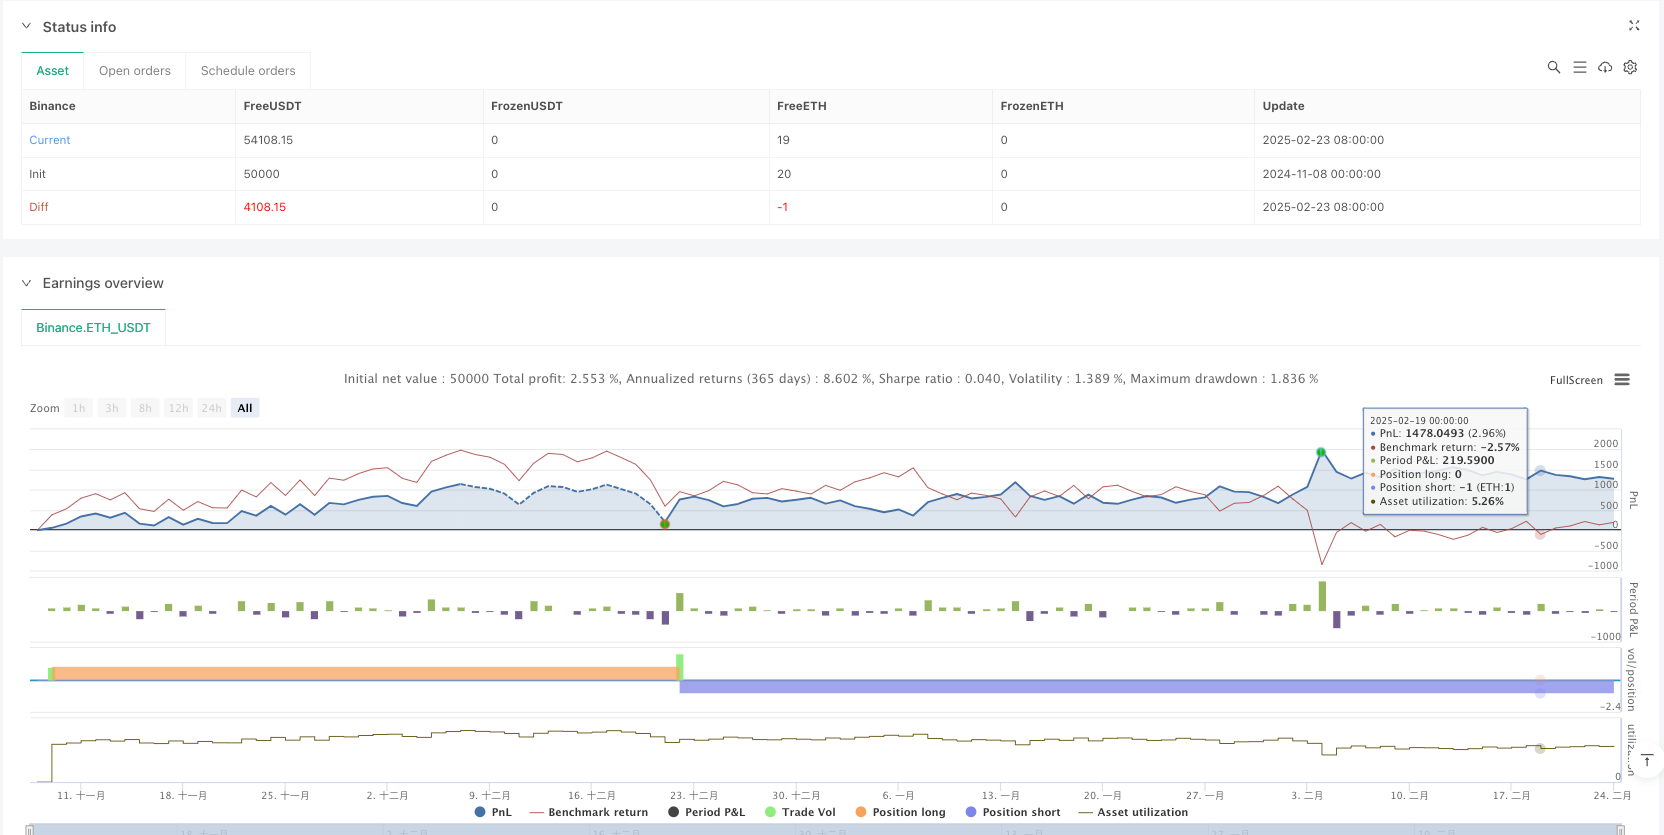
该策略是一个基于超级趋势指标(Supertrend)的量化交易系统,结合了精确的风险管理机制。策略核心利用价格与超级趋势线的交叉关系判断入场时机,同时为每笔交易设置1%的止盈和1%的止损,实现风险收益的精确控制。超级趋势指标通过平均真实波幅(ATR)和自定义因子计算得出,能够有效识别市场趋势变化,帮助交易者在趋势形成初期进场,并在趋势逆转时及时离场,从而提高交易的成功率和稳定性。
策略原理
该策略的核心原理基于超级趋势指标(Supertrend)的计算和应用:
-
超级趋势指标计算:
- 策略首先计算平均真实波幅(ATR),默认周期为14
- 将ATR乘以自定义因子(默认为3.0)获得波动带宽
- 基于价格和波动带宽计算超级趋势线
-
入场信号生成:
- 多头信号:当价格向上穿越超级趋势线时(ta.crossover函数)
- 空头信号:当价格向下穿越超级趋势线时(ta.crossunder函数)
-
风险管理机制:
- 多头交易:入场价格下方1%设置止损,上方1%设置止盈
- 空头交易:入场价格上方1%设置止损,下方1%设置止盈
- 使用strategy.entry函数的stop和limit参数实现自动止损和止盈
-
可视化辅助:
- 在图表上绘制超级趋势线,帮助识别当前趋势方向
- 显示止损和止盈水平线,提高交易的可视化程度
该策略使用Pine Script 5.0编写,通过函数ta.supertrend直接获取超级趋势指标值和方向,简化了代码结构,提高了计算效率。
策略优势
-
趋势跟踪优势:
- 超级趋势指标能够有效识别市场趋势,减少假突破带来的损失
- 指标对噪音具有较强的过滤能力,提高信号质量
-
风险管理精确化:
- 固定百分比的止盈止损设置,使风险控制更加精确和一致
- 每笔交易的风险可预先计算,便于资金管理
-
参数可调优:
- ATR周期和乘数因子可以根据不同市场条件进行调整
- 止盈止损百分比可根据个人风险偏好和市场波动性进行定制
-
可视化交易过程:
- 图表上直观显示超级趋势线、止盈和止损水平
- 增强交易决策的透明度和信心
-
代码简洁高效:
- 利用Pine Script 5.0的内置函数,代码结构清晰
- 计算逻辑直观,易于理解和维护
策略风险
-
区间震荡风险:
- 在横盘市场中,价格频繁穿越超级趋势线会导致连续亏损
- 解决方法:增加过滤条件,如结合方向性指标(如ADX)确认趋势强度
-
固定百分比风险:
- 1%的止盈止损在不同波动性市场可能过大或过小
- 解决方法:将止盈止损百分比与市场波动性(如ATR)动态关联
-
趋势反转延迟:
- 超级趋势指标属于滞后指标,可能在趋势反转初期未能及时发出信号
- 解决方法:结合领先指标如动量指标优化入场时机
-
参数敏感性:
- ATR周期和乘数因子的选择对策略性能影响较大
- 解决方法:进行全面的参数优化和回测,找到最适合特定市场的参数组合
-
止盈水平较近:
- 1%的止盈可能过早锁定利润,无法享受大趋势带来的收益
- 解决方法:实施移动止损或部分止盈策略,保留部分仓位跟踪趋势
策略优化方向
-
动态止盈止损:
- 将固定的1%止盈止损改为基于ATR的动态止盈止损
- 优化理由:使风险管理更好地适应市场波动性,提高策略的适应性
-
多周期确认:
- 增加更高时间框架的趋势确认机制
- 优化理由:减少假信号,提高交易质量,避免与主趋势逆向操作
-
智能仓位管理:
- 根据市场波动性和信号强度动态调整仓位大小
- 优化理由:在高确信度信号出现时增加风险敞口,提高资金利用效率
-
添加过滤条件:
- 结合交易量、动量指标或波动率指标过滤交易信号
- 优化理由:减少低质量信号,提高策略的稳定性和胜率
-
优化超级趋势参数:
- 实施自适应参数调整机制,根据市场状态动态调整ATR周期和乘数
- 优化理由:提高指标对不同市场环境的适应能力,减少过度拟合风险
总结
"多周期超级趋势百分比风控策略"是一个结合了趋势跟踪和精确风险管理的量化交易系统。策略通过超级趋势指标捕捉市场趋势变化,并使用固定百分比的止盈止损控制风险。
该策略的主要优势在于操作规则明确、风险可控、参数可调,适合作为基础的交易系统使用。同时,策略也存在震荡市场表现不佳、固定百分比风险不够灵活等缺点。
为了进一步提升策略性能,可以考虑引入动态止盈止损、多周期确认、智能仓位管理等优化措施。通过这些改进,策略有望在保持原有优势的基础上,进一步提高胜率和风险调整后收益率。
该策略适合中长期趋势交易者使用,特别是那些重视风险管理、追求稳定收益的交易者。通过合理的参数调整和策略优化,它可以成为一个可靠的交易系统组件。 || ## Overview
This strategy is a quantitative trading system based on the Supertrend indicator, combined with precise risk management mechanisms. The core of the strategy uses the crossover relationship between price and the Supertrend line to determine entry timing, while setting a 1% take profit and 1% stop loss for each trade, achieving precise control of risk and reward. The Supertrend indicator is calculated using the Average True Range (ATR) and a custom factor, effectively identifying market trend changes, helping traders enter at the early stages of trend formation and exit promptly when trends reverse, thereby improving the success rate and stability of trades.
Strategy Principles
The core principles of this strategy are based on the calculation and application of the Supertrend indicator:
-
Supertrend Indicator Calculation:
- The strategy first calculates the Average True Range (ATR), with a default period of 14
- Multiplies the ATR by a custom factor (default 3.0) to obtain the volatility band width
- Calculates the Supertrend line based on price and volatility band width
-
Entry Signal Generation:
- Long signal: When price crosses above the Supertrend line (ta.crossover function)
- Short signal: When price crosses below the Supertrend line (ta.crossunder function)
-
Risk Management Mechanism:
- Long trades: 1% stop loss below entry price, 1% take profit above entry price
- Short trades: 1% stop loss above entry price, 1% take profit below entry price
- Implements automatic stop loss and take profit using the stop and limit parameters of the strategy.entry function
-
Visual Assistance:
- Plots the Supertrend line on the chart to help identify current trend direction
- Displays stop loss and take profit levels, increasing trade visualization
This strategy is written in Pine Script 5.0, using the ta.supertrend function to directly obtain Supertrend indicator values and direction, simplifying code structure and improving computational efficiency.
Strategy Advantages
-
Trend Following Advantages:
- The Supertrend indicator effectively identifies market trends, reducing losses from false breakouts
- The indicator has strong noise filtering capability, improving signal quality
-
Precise Risk Management:
- Fixed percentage stop loss and take profit settings make risk control more precise and consistent
- Risk for each trade can be calculated in advance, facilitating capital management
-
Adjustable Parameters:
- ATR period and multiplier factor can be adjusted according to different market conditions
- Take profit and stop loss percentages can be customized according to individual risk preferences and market volatility
-
Visualized Trading Process:
- Intuitively displays Supertrend line, take profit, and stop loss levels on the chart
- Enhances transparency and confidence in trading decisions
-
Concise and Efficient Code:
- Utilizes built-in functions of Pine Script 5.0, with clear code structure
- Calculation logic is intuitive, easy to understand and maintain
Strategy Risks
-
Range-Bound Market Risk:
- In sideways markets, frequent price crossovers of the Supertrend line may lead to consecutive losses
- Solution: Add filtering conditions, such as combining directional indicators (like ADX) to confirm trend strength
-
Fixed Percentage Risk:
- 1% stop loss and take profit may be too large or too small in markets with different volatility
- Solution: Dynamically link stop loss and take profit percentages with market volatility (such as ATR)
-
Trend Reversal Delay:
- The Supertrend indicator is a lagging indicator and may not signal promptly at the beginning of trend reversals
- Solution: Combine leading indicators such as momentum indicators to optimize entry timing
-
Parameter Sensitivity:
- The selection of ATR period and multiplier factor has a significant impact on strategy performance
- Solution: Conduct comprehensive parameter optimization and backtesting to find the most suitable parameter combinations for specific markets
-
Close Take Profit Level:
- 1% take profit may lock in profits too early, missing out on benefits from major trends
- Solution: Implement trailing stop loss or partial take profit strategies, retaining some positions to follow trends
Strategy Optimization Directions
-
Dynamic Stop Loss and Take Profit:
- Change the fixed 1% stop loss and take profit to ATR-based dynamic levels
- Optimization rationale: Better adapt risk management to market volatility, improving strategy adaptability
-
Multi-Period Confirmation:
- Add trend confirmation mechanisms from higher timeframes
- Optimization rationale: Reduce false signals, improve trade quality, avoid operating against the main trend
-
Intelligent Position Management:
- Dynamically adjust position size based on market volatility and signal strength
- Optimization rationale: Increase risk exposure when high-confidence signals appear, improving capital utilization efficiency
-
Add Filtering Conditions:
- Combine volume, momentum indicators, or volatility indicators to filter trading signals
- Optimization rationale: Reduce low-quality signals, improve strategy stability and win rate
-
Optimize Supertrend Parameters:
- Implement adaptive parameter adjustment mechanisms, dynamically adjusting ATR period and multiplier based on market conditions
- Optimization rationale: Improve the indicator's adaptability to different market environments, reduce overfitting risk
Summary
The "Multi-Period Supertrend Percentage Risk Management Strategy" is a quantitative trading system that combines trend following with precise risk management. The strategy captures market trend changes through the Supertrend indicator and controls risk using fixed percentage take profit and stop loss levels.
The main advantages of this strategy include clear operational rules, controllable risk, and adjustable parameters, making it suitable for use as a basic trading system. At the same time, the strategy also has disadvantages such as poor performance in oscillating markets and inflexible fixed percentage risk.
To further enhance strategy performance, consider introducing dynamic stop loss and take profit, multi-period confirmation, intelligent position management, and other optimization measures. Through these improvements, the strategy has the potential to further increase win rate and risk-adjusted returns while maintaining its original advantages.
This strategy is suitable for medium to long-term trend traders, especially those who value risk management and pursue stable returns. With reasonable parameter adjustments and strategy optimization, it can become a reliable trading system component.[/trans]
Source (PineScript)
/*backtest
start: 2024-11-08 00:00:00
end: 2025-02-24 08:00:00
period: 1d
basePeriod: 1d
exchanges: [{"eid":"Binance","currency":"ETH_USDT"}]
*/

//@version=5
strategy("Supertrend with 1% Target and 1% Stoploss", overlay=true)

// Input parameters
atr_length = input.int(14, title="ATR Length")
factor = input.float(3.0, title="Factor")
target_pct = input.float(1.0, title="Target Percentage", minval=0.1) / 100
stoploss_pct = input.float(1.0, title="Stop Loss Percentage", minval=0.1) / 100

// Supertrend calculation
[supertrend, direction] = ta.supertrend(factor, atr_length)

// Plot the Supertrend line
plot(supertrend, color=color.blue, linewidth=2, title="Supertrend")

// Long and Short conditions
long_condition = ta.crossover(close, supertrend)
short_condition = ta.crossunder(close, supertrend)

// Calculate stop loss and take profit levels
long_stop_loss = close * (1 - stoploss_pct)
long_take_profit = close * (1 + target_pct)

short_stop_loss = close * (1 + stoploss_pct)
short_take_profit = close * (1 - target_pct)

// Long position entry
if long_condition
    strategy.entry("Long", strategy.long, stop=long_stop_loss, limit=long_take_profit)

// Short position entry
if short_condition
    strategy.entry("Short", strategy.short, stop=short_stop_loss, limit=short_take_profit)

// Plot stoploss and take profit levels for visual reference
plot(long_condition ? long_take_profit : na, color=color.green, style=plot.style_line, linewidth=1, title="Long Take Profit")
plot(long_condition ? long_stop_loss : na, color=color.red, style=plot.style_line, linewidth=1, title="Long Stop Loss")

plot(short_condition ? short_take_profit : na, color=color.green, style=plot.style_line, linewidth=1, title="Short Take Profit")
plot(short_condition ? short_stop_loss : na, color=color.red, style=plot.style_line, linewidth=1, title="Short Stop Loss")
Detail
https://www.fmz.com/strategy/483792
Last Modified
2025-02-26 10:01:53