
17 KiB
Name
多周期指数均线与MACD协同多空趋势量化交易策略-Multi-Timeframe-EMA-and-MACD-Enhanced-Trend-Quantification-Trading-Strategy
Author
ianzeng123
Strategy Description
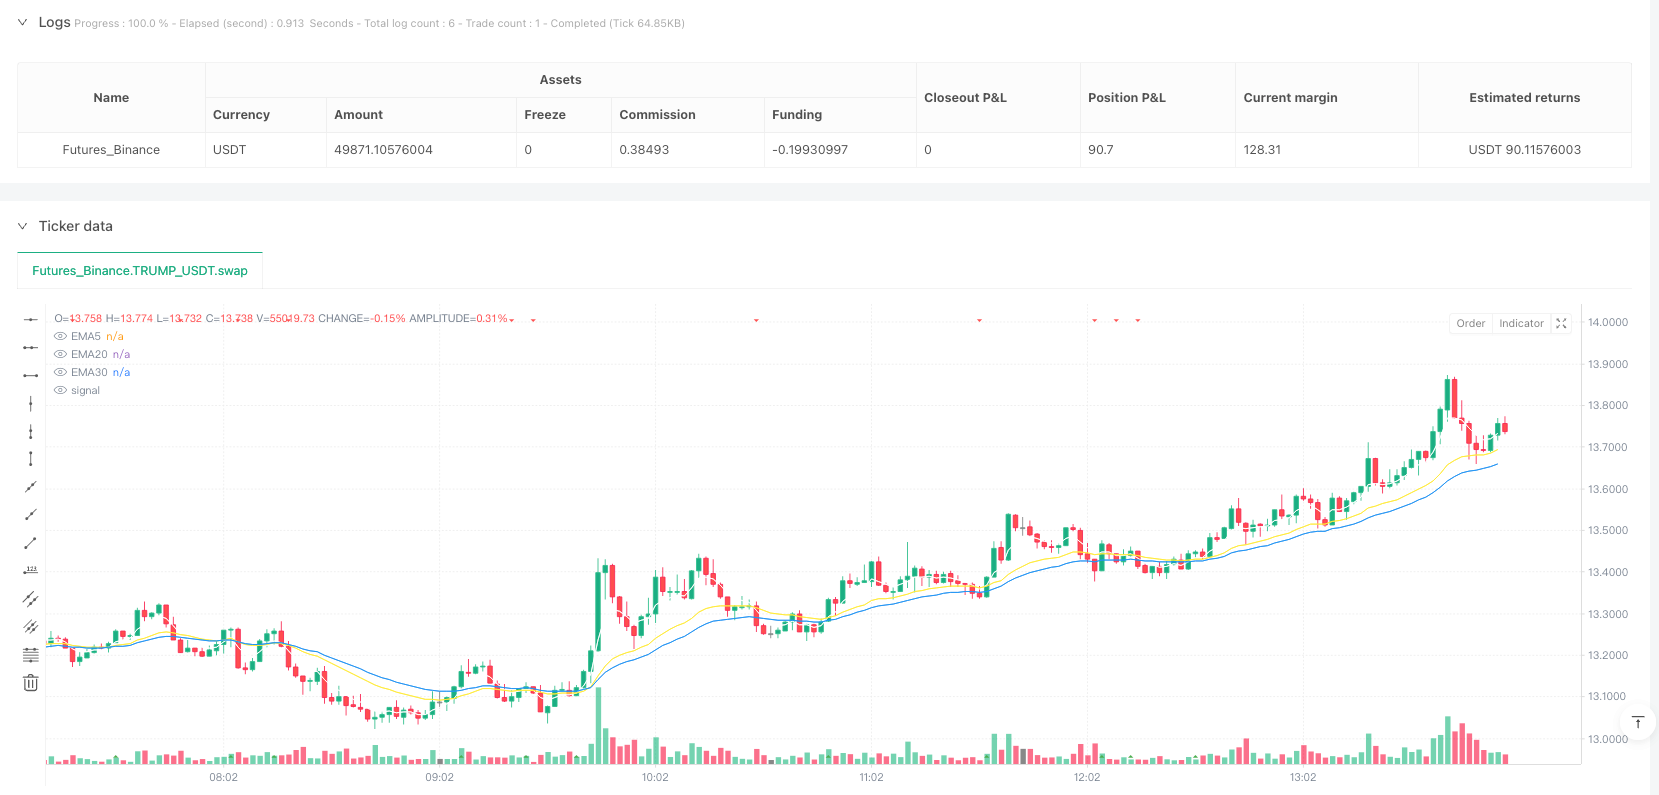

[trans]## 概述
本策略是一种基于指数移动平均线(EMA)和移动平均线趋同背离指标(MACD)结合的量化交易系统。该策略主要利用5日EMA和20日EMA的金叉信号作为入场依据,同时结合价格与30日EMA的位置关系和市场交易时间条件进行过滤,形成了一套完整的短线交易系统。策略设计上注重趋势确认和风险控制,通过固定金额的止盈和止损设置,使交易决策更加客观和纪律化。
策略原理
该策略核心逻辑基于三条不同周期的指数移动平均线(5日、20日和30日EMA),通过观察它们之间的交叉关系和相对位置来判断趋势方向。具体来说,当短周期的5日EMA向上穿越中周期的20日EMA,且价格保持在长周期30日EMA之上时,系统产生做多信号。这一设计充分考虑了多重时间框架分析原理,确保交易方向与主趋势保持一致。
此外,策略还加入了交易时间过滤条件,只在美国东部时间上午9:30至下午4:00的常规交易时段内执行交易。这一时间过滤机制有助于避开市场流动性较差和波动性异常的时段,提高交易成功率。
在资金管理方面,策略采用固定数量的头寸进入市场,并通过固定金额的止盈和止损比例来管理风险。系统设置了2000美元的固定盈利目标和1000点的止损水平,这种设计使得每笔交易的风险回报特征保持一致,有利于长期稳定的绩效表现。
策略优势
-
多重确认机制:通过结合短、中、长三周期EMA的协同作用,该策略能有效过滤假突破和市场噪音,确保交易信号的可靠性。当5日EMA上穿20日EMA且价格在30日EMA之上时,表明短期、中期和长期趋势均呈上升态势,增加了交易成功的概率。
-
精确的市场时间过滤:策略仅在正常交易时段内运行,避开了盘前盘后等流动性受限的时段,减少了滑点和不利成交的可能性。这一特点对日内短线交易尤为重要,可有效避免市场波动性异常带来的风险。
-
明确的风险管理框架:通过固定金额的止盈和止损设置,每笔交易的风险暴露得到严格控制。这种方法相比百分比止损更适合特定市场环境,尤其是在价格波动剧烈的情况下,能更好地保护资金安全。
-
视觉化交易信号:策略通过图形标记清晰显示EMA交叉点和入场信号,使交易者能直观地识别潜在交易机会,提高决策效率。这些视觉辅助功能对于实时交易监控非常有价值。
-
策略逻辑简洁高效:相比复杂的多指标系统,该策略保持了逻辑简洁性,减少了过度拟合的风险,同时提供了足够的市场洞察力。简洁的设计也意味着更少的计算负担,适合高频交易环境。
策略风险
-
均线交叉滞后性:EMA交叉信号本质上是滞后指标,在快速变化的市场中可能导致入场时机偏晚,错过最佳价格区域。特别是在高波动市场中,等待5日EMA与20日EMA交叉确认可能使入场价格已远离理想区域。
-
固定止损风险:策略采用固定金额止损而非根据市场波动性动态调整,在市场环境变化时可能导致止损过紧或过松。例如,在波动性突然扩大的情况下,固定止损点可能被轻易触发,导致不必要的损失。
-
市场条件依赖性:该策略在明确趋势市场中表现最佳,但在区间震荡或高度波动的市场环境中可能产生频繁的假信号。当市场缺乏方向性时,均线交叉可能导致连续的亏损交易。
-
缺乏交易量确认:尽管策略代码中有绘制成交量相关的信号条件,但实际交易决策中并未将成交量作为过滤条件,可能导致在低交易量的环境下进入弱势趋势。
-
单一方向交易限制:当前策略设计仅优化了做多条件,缺乏对做空市场的完整支持,限制了在熊市环境中的应用范围。
策略优化方向
-
引入动态止损机制:可以基于市场波动性指标(如ATR)动态调整止损水平,使止损更加智能化和适应性强。例如,可以将止损设置为ATR的倍数,在高波动时期自动增加止损距离,低波动时期收紧止损。
-
整合成交量条件:建议将成交量突破作为额外的确认条件,只有当EMA交叉发生在放量背景下时才触发交易信号。具体实现可以通过比较当前成交量与N日平均成交量的关系来判断。
-
添加趋势强度过滤器:引入ADX(平均趋向指数)等趋势强度指标,只在趋势足够强劲时(如ADX>25)才允许入场,有助于避免在弱趋势或震荡市场中产生的假信号。
-
完善多空策略平衡:扩展策略以支持做空交易,当5日EMA下穿20日EMA且价格低于30日EMA时生成空头信号,实现全市场条件下的交易能力。
-
加入回测优化框架:引入参数优化机制,自动测试不同EMA周期、止损和止盈水平的组合,找出在不同市场环境下的最优参数设置。例如,可以测试3-8日范围的短周期EMA和15-30日范围的中周期EMA的各种组合效果。
-
整合市场情绪指标:考虑将VIX等市场情绪指标作为额外过滤条件,在极端市场情绪时期调整或暂停交易,以避免在异常市场环境中承担过高风险。
总结
这种基于多周期指数均线与市场时间过滤的量化交易策略,通过5日EMA与20日EMA的金叉结合价格位置判断,形成了一套逻辑清晰、执行明确的交易系统。该策略特别适合中短期趋势交易,其优势在于信号确认机制完善、风险控制框架明确,但同时也存在均线滞后性和市场条件依赖等固有局限。
通过引入动态止损、成交量确认、趋势强度过滤等优化措施,该策略有望进一步提升稳定性和适应性。对于量化交易者而言,这一策略框架提供了良好的起点,可以根据个人风险偏好和市场环境进行相应调整和扩展,形成更加个性化和高效的交易系统。策略的简洁设计和清晰逻辑也使其成为学习量化交易的理想教学工具,帮助交易者理解趋势跟踪和风险管理的基本原则。 || ## Overview
This strategy is a quantitative trading system based on the combination of Exponential Moving Averages (EMA) and Moving Average Convergence Divergence (MACD). The strategy primarily uses the golden cross signal between the 5-day EMA and 20-day EMA as the entry basis, while incorporating the price's position relative to the 30-day EMA and market trading time conditions as filters, forming a complete short-term trading system. The strategy design focuses on trend confirmation and risk control, making trading decisions more objective and disciplined through fixed-amount take-profit and stop-loss settings.
Strategy Principles
The core logic of this strategy is based on three different period Exponential Moving Averages (5-day, 20-day, and 30-day EMA), judging trend direction by observing their crossover relationships and relative positions. Specifically, when the short-period 5-day EMA crosses above the medium-period 20-day EMA, and the price remains above the long-period 30-day EMA, the system generates a long signal. This design fully considers the principles of multi-timeframe analysis, ensuring that the trading direction remains consistent with the main trend.
Additionally, the strategy incorporates trading time filter conditions, only executing trades during regular trading hours from 9:30 AM to 4:00 PM Eastern Time in the United States. This time filtering mechanism helps to avoid periods of poor market liquidity and abnormal volatility, improving the success rate of trades.
In terms of fund management, the strategy adopts a fixed quantity of positions to enter the market and manages risk through fixed-amount take-profit and stop-loss ratios. The system sets a fixed profit target of $2,000 and a stop-loss level of 1,000 points, which ensures that the risk-reward characteristics of each trade remain consistent, contributing to long-term stable performance.
Strategy Advantages
-
Multiple Confirmation Mechanisms: By combining the synergistic effects of short, medium, and long-period EMAs, the strategy can effectively filter out false breakouts and market noise, ensuring the reliability of trading signals. When the 5-day EMA crosses above the 20-day EMA and the price is above the 30-day EMA, it indicates that short-term, medium-term, and long-term trends are all rising, increasing the probability of successful trades.
-
Precise Market Time Filtering: The strategy only operates during normal trading hours, avoiding limited liquidity periods such as pre-market and after-hours, reducing the possibility of slippage and unfavorable executions. This feature is particularly important for intraday short-term trading and can effectively avoid risks brought by abnormal market volatility.
-
Clear Risk Management Framework: Through fixed-amount take-profit and stop-loss settings, the risk exposure of each trade is strictly controlled. This method is more suitable for specific market environments compared to percentage-based stop-losses, especially in situations of violent price fluctuations, better protecting fund safety.
-
Visualized Trading Signals: The strategy clearly displays EMA crossover points and entry signals through graphic markers, allowing traders to intuitively identify potential trading opportunities and improve decision-making efficiency. These visual aids are valuable for real-time trading monitoring.
-
Concise and Efficient Strategy Logic: Compared to complex multi-indicator systems, this strategy maintains logical simplicity, reducing the risk of overfitting while providing sufficient market insight. The concise design also means less computational burden, suitable for high-frequency trading environments.
Strategy Risks
-
Lagging Nature of Moving Average Crossovers: EMA crossover signals are inherently lagging indicators, which may lead to delayed entry timing in rapidly changing markets, missing the optimal price zones. Especially in highly volatile markets, waiting for confirmation of the 5-day EMA crossing the 20-day EMA may result in entry prices far from the ideal area.
-
Fixed Stop-Loss Risk: The strategy employs a fixed-amount stop-loss rather than dynamically adjusting based on market volatility, which may result in stop-losses that are too tight or too loose when market conditions change. For example, in cases of suddenly expanded volatility, fixed stop-loss points may be easily triggered, causing unnecessary losses.
-
Market Condition Dependency: This strategy performs best in clearly trending markets but may generate frequent false signals in range-bound or highly volatile market environments. When the market lacks directionality, moving average crossovers may lead to consecutive losing trades.
-
Lack of Volume Confirmation: Although there are volume-related signal conditions plotted in the strategy code, trading decisions do not use volume as a filter condition, potentially leading to entries into weak trends in low-volume environments.
-
Single-Direction Trading Limitation: The current strategy design is only optimized for long conditions, lacking complete support for short markets, limiting its application range in bearish market environments.
Strategy Optimization Directions
-
Introduce Dynamic Stop-Loss Mechanism: Stop-loss levels can be dynamically adjusted based on market volatility indicators (such as ATR), making the stop-loss more intelligent and adaptive. For example, the stop-loss can be set as a multiple of ATR, automatically increasing the stop-loss distance during high-volatility periods and tightening it during low-volatility periods.
-
Integrate Volume Conditions: It is recommended to use volume breakouts as an additional confirmation condition, triggering trading signals only when EMA crossovers occur against a background of increased volume. This can be specifically implemented by comparing the relationship between current volume and N-day average volume.
-
Add Trend Strength Filters: Introduce trend strength indicators such as ADX (Average Directional Index), only allowing entries when the trend is strong enough (e.g., ADX > 25), helping to avoid false signals generated in weak trends or oscillating markets.
-
Perfect Long-Short Strategy Balance: Extend the strategy to support short trading, generating short signals when the 5-day EMA crosses below the 20-day EMA and the price is below the 30-day EMA, achieving trading capabilities under all market conditions.
-
Add Backtesting Optimization Framework: Introduce parameter optimization mechanisms to automatically test combinations of different EMA periods, stop-loss, and take-profit levels, finding optimal parameter settings under different market environments. For example, testing various combinations of short-period EMAs in the range of 3-8 days and medium-period EMAs in the range of 15-30 days.
-
Integrate Market Sentiment Indicators: Consider using market sentiment indicators such as VIX as additional filter conditions, adjusting or suspending trading during periods of extreme market sentiment to avoid taking excessive risks in abnormal market environments.
Summary
This quantitative trading strategy based on multi-period exponential moving averages and market time filtering forms a logically clear and precisely executable trading system through the golden cross of the 5-day EMA and 20-day EMA combined with price position judgment. The strategy is particularly suitable for medium to short-term trend trading, with advantages in comprehensive signal confirmation mechanisms and clear risk control frameworks, but also inherent limitations such as moving average lag and market condition dependency.
By introducing optimization measures such as dynamic stop-losses, volume confirmation, and trend strength filtering, the strategy has the potential to further enhance stability and adaptability. For quantitative traders, this strategy framework provides a good starting point that can be adjusted and expanded according to personal risk preferences and market environments to form a more personalized and efficient trading system. The concise design and clear logic of the strategy also make it an ideal educational tool for learning quantitative trading, helping traders understand the basic principles of trend following and risk management.[/trans]
Source (PineScript)
/*backtest
start: 2025-03-06 00:00:00
end: 2025-03-06 14:00:00
period: 2m
basePeriod: 2m
exchanges: [{"eid":"Futures_Binance","currency":"TRUMP_USDT"}]
*/

//@version=5
strategy("EMA MACD Long Scalper", overlay=true)

// Input parameters
ema1Length = input.int(5, "EMA1", minval=1)
ema2Length = input.int(20, "EMA2", minval=1)
ema3Length = input.int(30, "EMA3", minval=1)
positionSize = input.int(100, "Position Size (Shares)", minval=1)
stopLossPct = 1000// 0.5% stop loss

takeProfitDollar = 2000// Take profit at $1,000
marketHoursCondition = hour(time, "America/New_York") >= 9 and minute(time, "America/New_York") >=30 and hour(time, "America/New_York") < 16


// Calculate EMA and SMA
ema1 = ta.ema(close, ema1Length)
ema2 = ta.ema(close, ema2Length)
ema3 = ta.ema(close, ema3Length)

// Cross Shape Conditions
EMABullcross = ta.crossover(ema1, ema2)
EMABearCross = ta.crossunder (ema1, ema2)

//Plot EMA
plot(ema1, "EMA5", color=color.white, linewidth=1, transp=0)
plot(ema2, "EMA20", color=color.yellow, linewidth=1, transp=0)
plot(ema3, "EMA30", color=color.blue, linewidth=1, transp=0)
plotshape(EMABullcross ? low : na, title='EMA Crossover Above', style=shape.triangleup, color=color.new(color.green, 0), location=location.bottom, size=size.tiny)
plotshape(EMABearCross ? low : na, title='EMA Crossover Above', style=shape.triangledown, color=color.new(color.red, 0), location=location.top, size=size.tiny)
// Crossover signals
longCondition = ta.crossover(ema1, ema2) and close > ema3 and marketHoursCondition


// Variables to track entry prices
var float entryPrice = na

// Strategy execution
if (longCondition)
    entryPrice := close
    strategy.entry("Long", strategy.long, qty=positionSize)


// Take profit calculation
longTakeProfitLevel = entryPrice + (takeProfitDollar / positionSize)
shortTakeProfitLevel = entryPrice - (takeProfitDollar / positionSize)

// Stop loss calculation
longStopLossLevel = entryPrice - (stopLossPct / positionSize)
shortStopLossLevel = entryPrice * (1 + stopLossPct / 100)

// Exit conditions
strategy.exit("TP Long", from_entry="Long", limit=longTakeProfitLevel, stop=longStopLossLevel)
strategy.exit("TP Short", from_entry="Short", limit=shortTakeProfitLevel, stop=shortStopLossLevel)

// Plot signals
plotshape(longCondition, title="Long Signal", location=location.belowbar, color=color.green, style=shape.triangleup, size=size.small)
Detail
https://www.fmz.com/strategy/486563
Last Modified
2025-03-14 09:24:01