
8.5 KiB
Name
多周期技术指标动态交易系统策略-Multi-Period-Technical-Indicator-Dynamic-Trading-System-Strategy
Author
ChaoZhang
Strategy Description
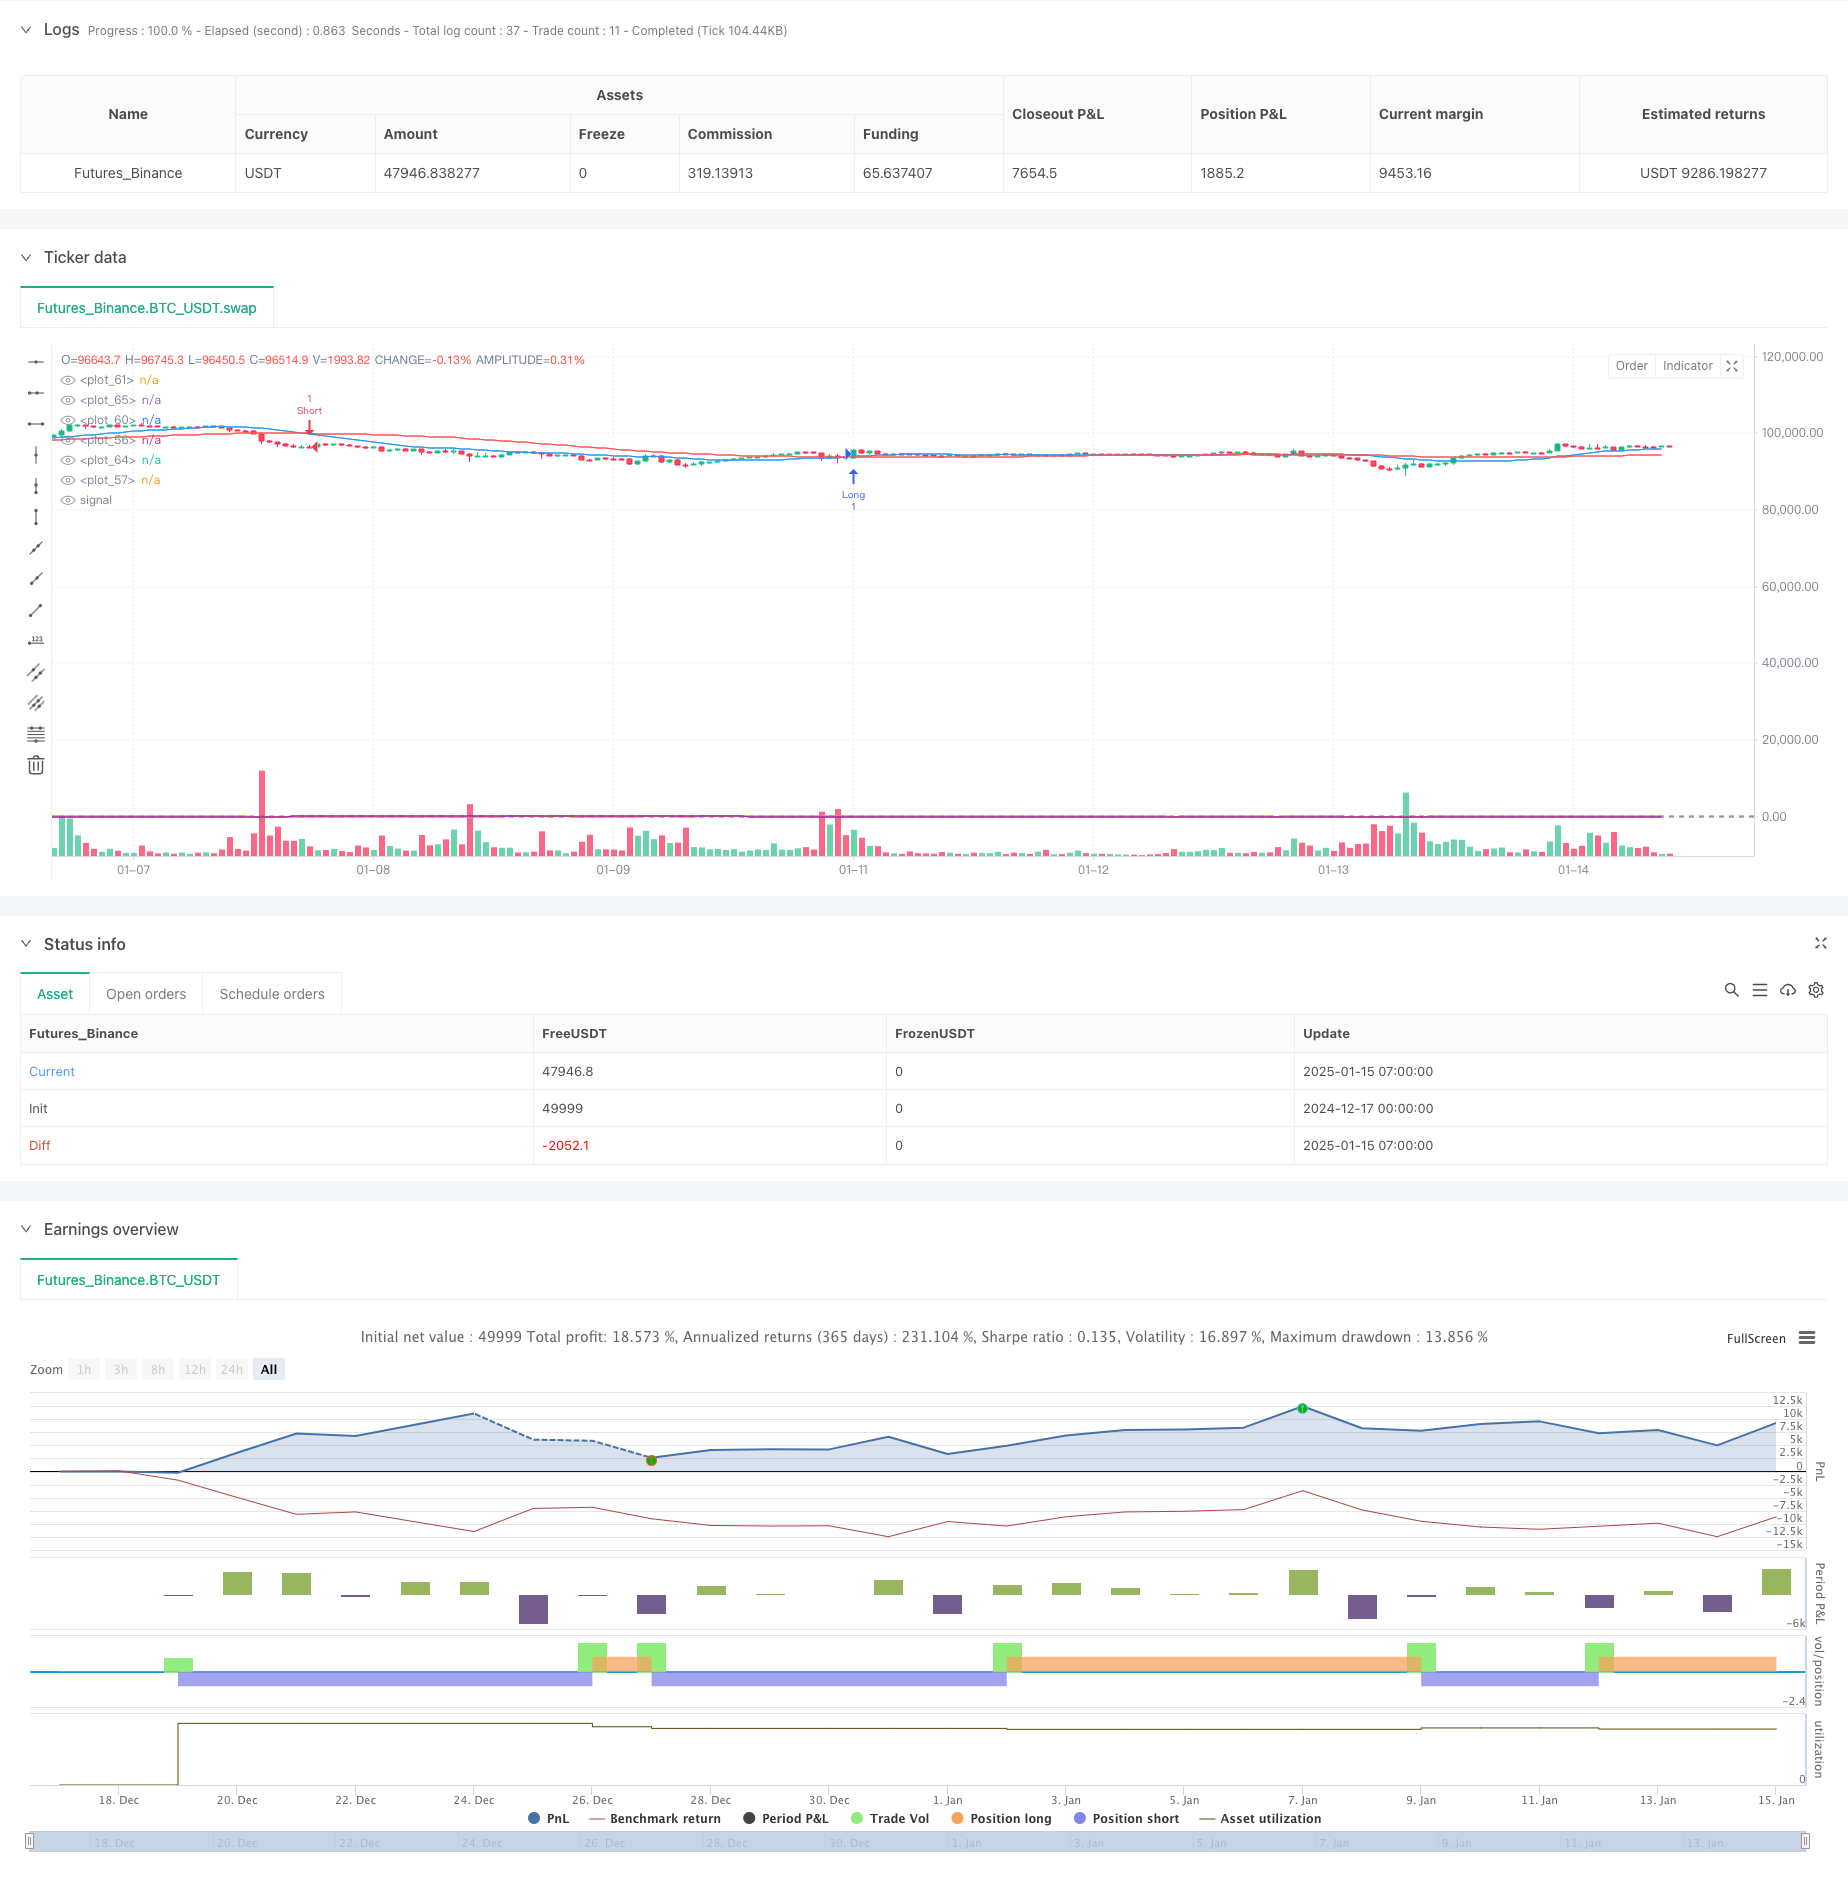
[trans]
概述
该策略是一个结合了多个技术指标的综合交易系统,主要利用移动平均线(MA)、相对强弱指标(RSI)和平均趋向指数(ADX)三个指标来识别市场趋势和动量,并通过真实波幅指标(ATR)来动态设置止损和止盈位置。系统采用多周期分析方法,通过不同时间周期的指标交叉来确认交易信号,既保证了交易的准确性,又能有效控制风险。
策略原理
策略采用三层验证机制来确认交易信号:
- 趋势识别层:使用20周期和50周期两条移动平均线的交叉来判断趋势方向,快线上穿慢线视为上升趋势,反之为下降趋势。
- 动量确认层:使用14周期RSI指标来确认价格动量,RSI大于50表示上升动量,小于50表示下降动量。
- 趋势强度过滤层:使用14周期ADX指标来衡量趋势强度,只有ADX大于25时才确认趋势足够强劲可以交易。
同时,策略使用基于ATR的动态止损止盈系统:
- 止损设置为2倍ATR
- 止盈设置为4倍ATR,保持1:2的风险收益比
策略优势
- 多重确认机制:通过三个不同维度的技术指标互相验证,大大降低了虚假信号的影响。
- 动态风险管理:基于ATR的动态止损止盈设置,能够根据市场波动性自适应调整,避免固定点位带来的不合理风险。
- 趋势跟踪性强:通过MA系统识别趋势,并用ADX确认趋势强度,能够有效捕捉大趋势行情。
- 操作规范清晰:入场、止损、止盈等关键点位都有明确的量化标准,降低了主观判断带来的干扰。
策略风险
- 震荡市场风险:在横盘震荡市场中,均线频繁交叉可能导致虚假信号增多。
- 滞后性风险:技术指标都具有一定滞后性,可能在剧烈波动时错过最佳入场点。
- 参数敏感性:策略效果对参数设置较为敏感,不同市场环境可能需要调整参数。
- 系统性风险:在市场突发性重大事件影响下,技术指标可能失效。
策略优化方向
- 引入成交量指标:可以考虑增加成交量指标来辅助验证趋势的有效性。
- 优化参数自适应:可以开发自适应参数系统,根据不同的市场环境动态调整指标参数。
- 增加市场情绪指标:引入VIX等市场情绪指标,在高波动期间调整仓位或暂停交易。
- 完善止损机制:可以考虑增加追踪止损功能,更好地锁定利润。
总结
该策略通过多重技术指标的协同作用,构建了一个相对完整的交易系统。策略的核心优势在于其多层验证机制和动态风险管理系统,但也需要注意在不同市场环境下的适应性问题。通过持续优化和完善,该策略有望在实际交易中取得稳定的收益。
||
Overview
This strategy is a comprehensive trading system that combines multiple technical indicators, primarily utilizing Moving Average (MA), Relative Strength Index (RSI), and Average Directional Index (ADX) to identify market trends and momentum. It uses the Average True Range (ATR) to dynamically set stop-loss and take-profit levels. The system employs a multi-period analysis approach, confirming trading signals through indicator crossovers across different time periods, ensuring both trading accuracy and effective risk control.
Strategy Principles
The strategy employs a three-layer verification mechanism to confirm trading signals:
- Trend Identification Layer: Uses crossovers of 20-period and 50-period moving averages to determine trend direction, with fast MA crossing above slow MA indicating an uptrend and vice versa.
- Momentum Confirmation Layer: Uses 14-period RSI to confirm price momentum, with RSI above 50 indicating upward momentum and below 50 indicating downward momentum.
- Trend Strength Filter Layer: Uses 14-period ADX to measure trend strength, only confirming trades when ADX is above 25, indicating sufficient trend strength.
Additionally, the strategy implements an ATR-based dynamic stop-loss and take-profit system:
- Stop-loss is set at 2 times ATR
- Take-profit is set at 4 times ATR, maintaining a 1:2 risk-reward ratio
Strategy Advantages
- Multiple Confirmation Mechanism: Validates signals through three different technical indicators, significantly reducing the impact of false signals.
- Dynamic Risk Management: ATR-based dynamic stop-loss and take-profit settings adapt to market volatility, avoiding unreasonable risks from fixed levels.
- Strong Trend Following: Effectively captures major trend movements through MA system and ADX confirmation.
- Clear Operational Standards: Key points such as entry, stop-loss, and take-profit have clear quantitative standards, reducing interference from subjective judgment.
Strategy Risks
- Sideways Market Risk: Frequent MA crossovers in ranging markets may increase false signals.
- Lag Risk: Technical indicators have inherent lag, potentially missing optimal entry points during volatile movements.
- Parameter Sensitivity: Strategy performance is sensitive to parameter settings, requiring adjustment in different market environments.
- Systemic Risk: Technical indicators may fail under sudden major market events.
Strategy Optimization Directions
- Volume Indicator Integration: Consider adding volume indicators to help validate trend validity.
- Parameter Adaptation: Develop adaptive parameter systems that dynamically adjust indicator parameters based on market conditions.
- Market Sentiment Integration: Incorporate market sentiment indicators like VIX to adjust positions or pause trading during high volatility periods.
- Enhanced Stop-Loss Mechanism: Consider adding trailing stop-loss functionality for better profit protection.
Summary
This strategy constructs a relatively complete trading system through the synergy of multiple technical indicators. Its core strengths lie in its multi-layer verification mechanism and dynamic risk management system, though attention must be paid to its adaptability in different market environments. Through continuous optimization and improvement, this strategy shows promise for achieving stable returns in actual trading. [/trans]
Source (PineScript)
/*backtest
start: 2024-12-17 00:00:00
end: 2025-01-15 08:00:00
period: 1h
basePeriod: 1h
exchanges: [{"eid":"Futures_Binance","currency":"BTC_USDT","balance":49999}]
*/

//@version=6
strategy("Daily Trading Strategy", overlay=true)

// --- Indikator ---
// Kombinasi MA untuk trend
fastMA = ta.sma(close, 20)
slowMA = ta.sma(close, 50)

// RSI untuk momentum
rsi = ta.rsi(close, 14)

// --- Fungsi untuk menghitung ADX ---
adx(length) =>
    up = ta.change(high)
    down = -ta.change(low)
    plusDM = na(up) ? na : (up > down and up > 0 ? up : 0)
    minusDM = na(down) ? na : (down > up and down > 0 ? down : 0)
    trur = ta.rma(ta.tr, length)
    plus = fixnan(100 * ta.rma(plusDM, length) / trur)
    minus = fixnan(100 * ta.rma(minusDM, length) / trur)
    sum = plus + minus
    adx = 100 * ta.rma(math.abs(plus - minus) / (sum == 0 ? 1 : sum), length)

// ADX untuk kekuatan trend
adxValue = adx(14)

// --- Kondisi Entry Long ---
longEntry = ta.crossover(fastMA, slowMA) and rsi > 50 and adxValue > 25

// --- Kondisi Entry Short ---
shortEntry = ta.crossunder(fastMA, slowMA) and rsi < 50 and adxValue > 25

// --- Stop Loss dan Take Profit ---
// Fungsi untuk menghitung stop loss dan take profit
getSLTP(entryPrice, isLong) =>
    atr = ta.atr(14)
    sl = isLong ? entryPrice - atr * 2 : entryPrice + atr * 2
    tp = isLong ? entryPrice + atr * 4 : entryPrice - atr * 4
    [sl, tp]

// Hitung SL dan TP untuk posisi Long
[longSL, longTP] = getSLTP(close, true)

// Hitung SL dan TP untuk posisi Short
[shortSL, shortTP] = getSLTP(close, false)

// --- Eksekusi Order ---
if (longEntry)
    strategy.entry("Long", strategy.long, stop=longSL, limit=longTP)

if (shortEntry)
    strategy.entry("Short", strategy.short, stop=shortSL, limit=shortTP)

// --- Plot Indikator ---
// MA
plot(fastMA, color=color.blue)
plot(slowMA, color=color.red)

// RSI
plot(rsi, color=color.orange)
hline(50, color=color.gray)

// ADX
plot(adxValue, color=color.purple)
hline(25, color=color.gray)

// --- Alert ---
alertcondition(longEntry, title="Long Entry", message="Long Entry")
alertcondition(shortEntry, title="Short Entry", message="Short Entry")
Detail
https://www.fmz.com/strategy/478688
Last Modified
2025-01-17 14:26:19