
11 KiB
Name
多周期技术分析与市场情绪结合的交易策略-Multi-Period-Technical-Analysis-and-Market-Sentiment-Trading-Strategy
Author
ChaoZhang
Strategy Description
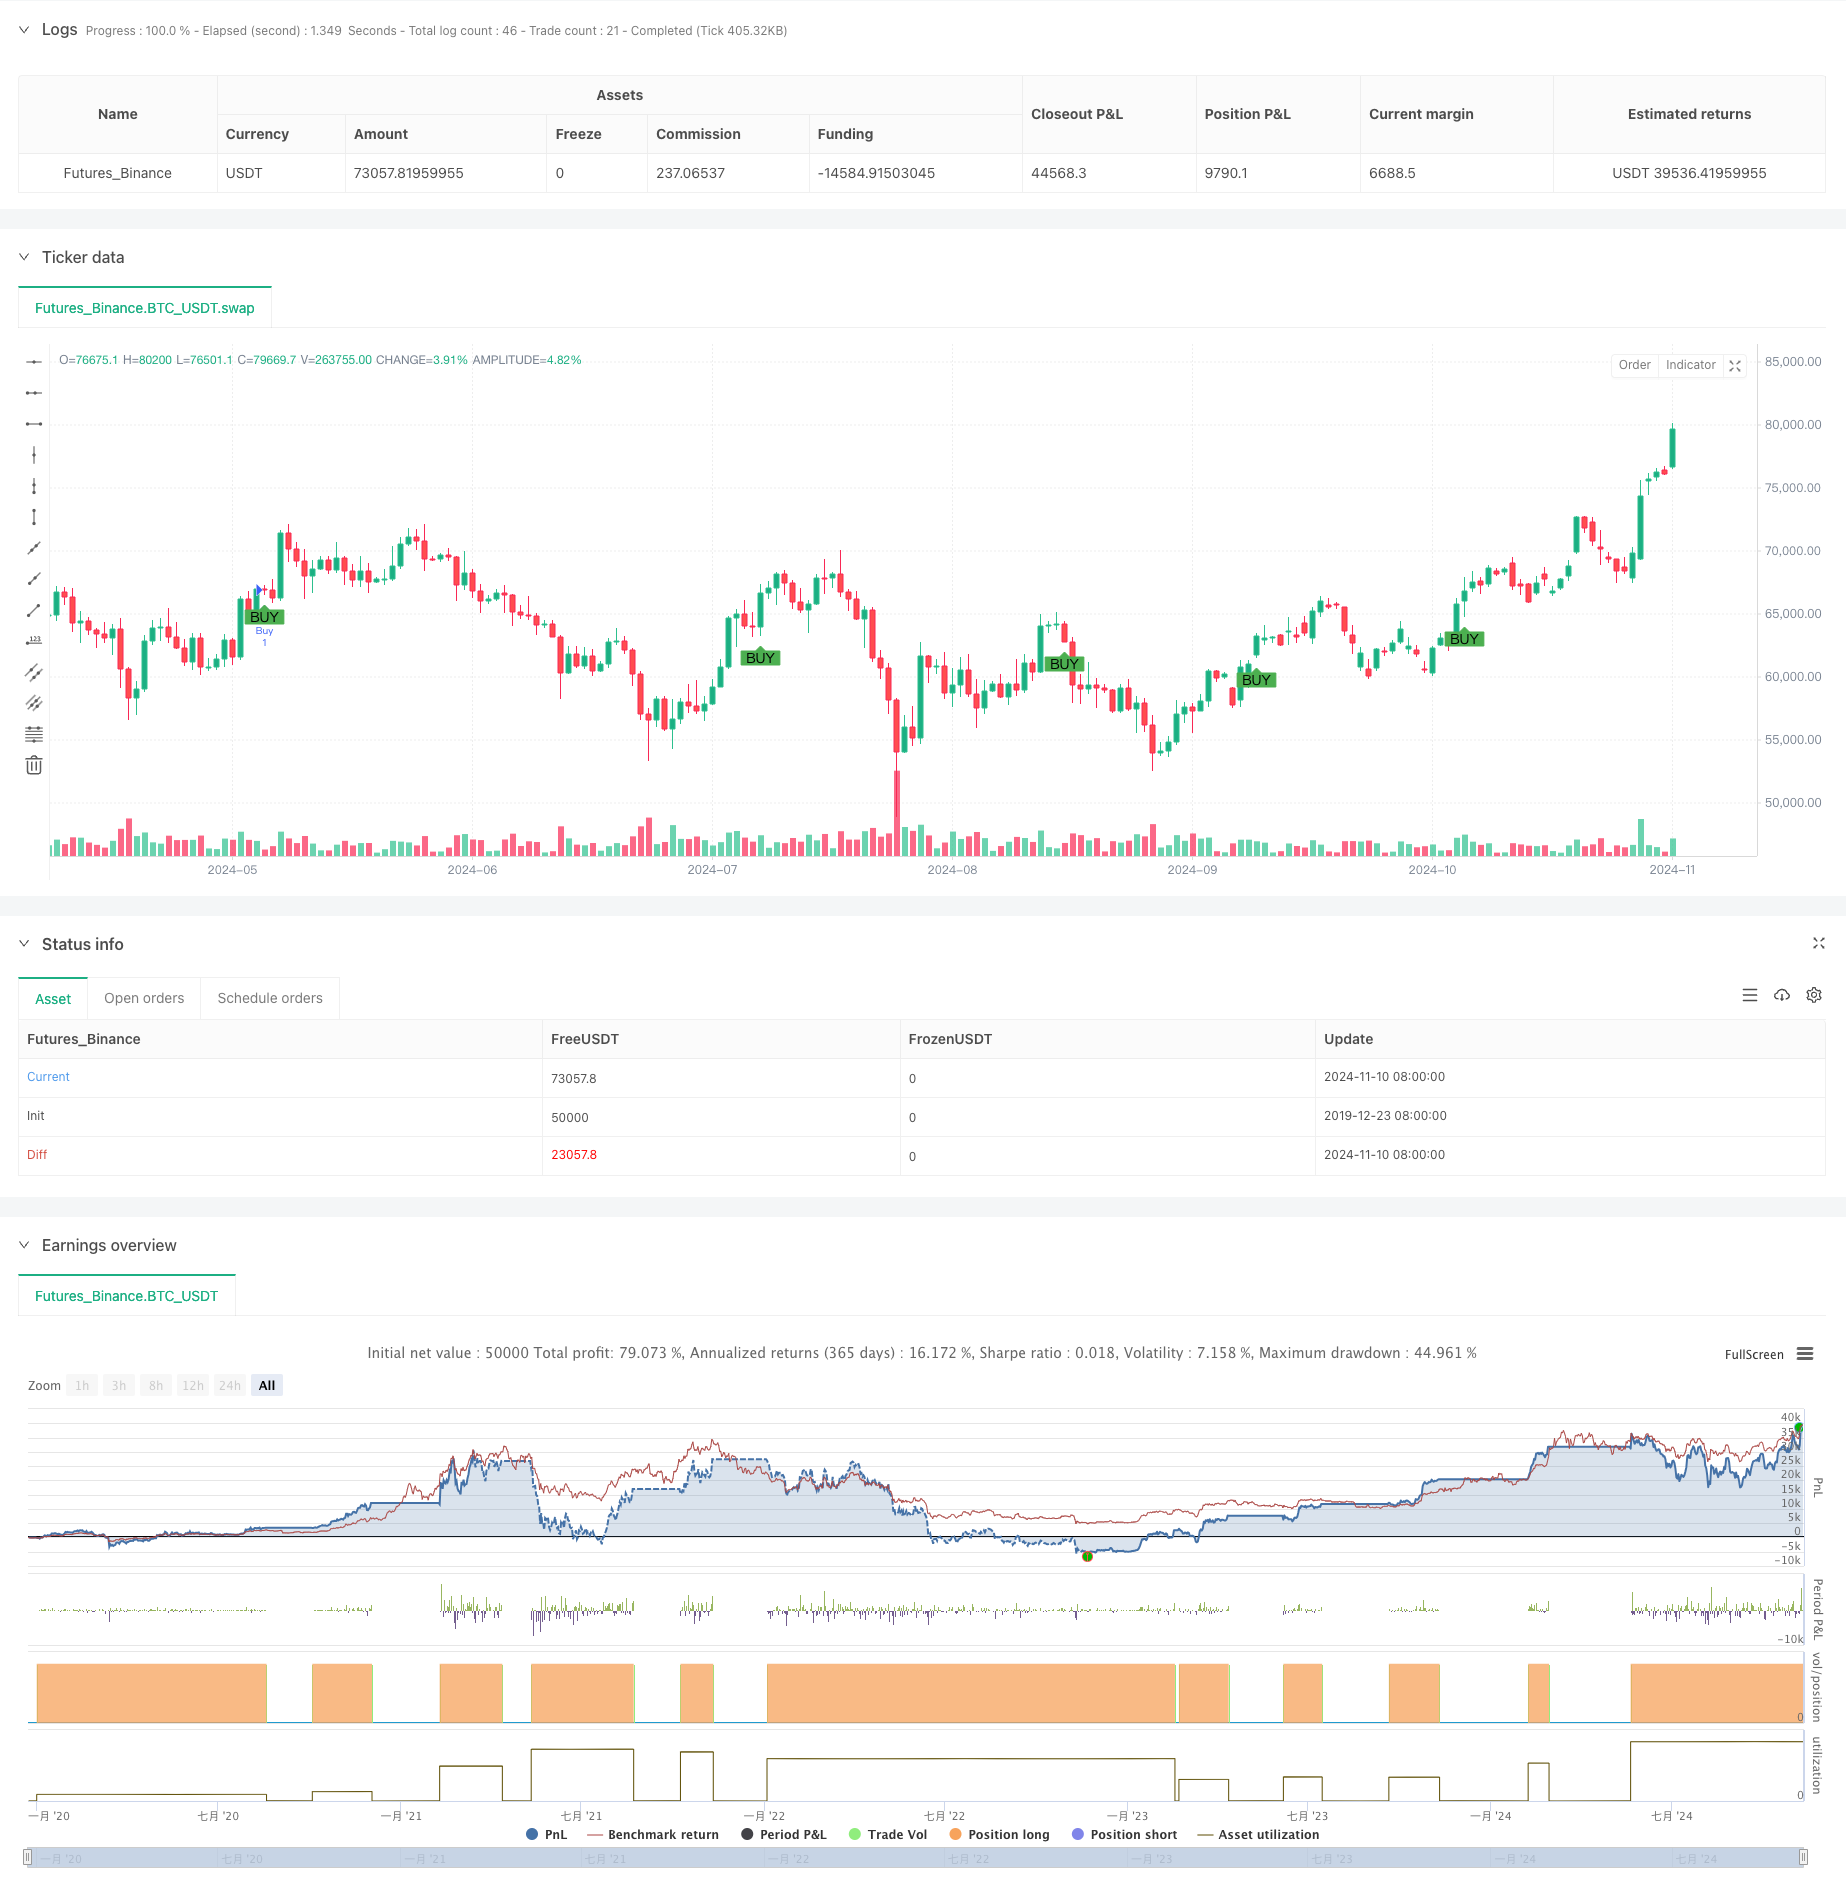
[trans]
概述
该策略是一个结合了多个技术指标和市场情绪的综合交易系统。策略核心采用了短期和长期移动平均线(SMA)的交叉信号,同时结合MACD指标来确认趋势方向。此外,策略还整合了市场情绪指标RSI,以及图表形态识别系统,包括双顶/双底和头肩顶形态的识别。策略特别设计了在特定交易时段执行,以提高交易效率和成功率。
策略原理
策略运作基于以下几个核心组件:
- 多周期移动平均线系统:使用10周期和30周期的SMA进行趋势判断
- MACD指标:采用标准参数(12,26,9)设置,用于趋势确认
- 市场情绪监测:使用RSI指标进行超买超卖判断
- 图表形态识别:包含双顶/双底和头肩顶形态的自动识别系统
- 时间过滤:专注于特定交易时段的交易机会
- 阻力位识别:使用20周期回溯来确定主要阻力位
买入条件需满足:处于目标交易时段,短期SMA上穿长期SMA,且MACD指标显示多头信号。 卖出条件需满足:价格达到主要阻力位,且MACD指标显示空头信号。
策略优势
- 多维度信号确认:结合技术指标和图表形态,提高交易信号的可靠性
- 风险管理完善:包含基于RSI的提前退出机制
- 市场情绪整合:通过RSI指标进行市场情绪判断,避免过度追涨杀跌
- 自动化形态识别:减少主观判断带来的偏差
- 时间过滤:专注于市场活跃度较高的时段,提高交易效率
策略风险
- 参数敏感性:多个技术指标的参数设置可能影响策略表现
- 滞后性风险:移动平均线和MACD都具有一定滞后性
- 形态识别准确性:自动化识别系统可能出现误判
- 市场环境依赖:在震荡市场中可能产生频繁假信号
- 时间局限性:仅在特定时段交易可能错过其他时段的机会
策略优化方向
- 参数自适应:引入自适应参数调整机制,根据市场波动度自动调整指标参数
- 信号权重系统:建立各个指标信号的权重体系,提高决策准确性
- 止损优化:增加动态止损机制,提高风险控制能力
- 形态识别增强:引入机器学习算法提高图表形态识别的准确率
- 回测周期扩展:在不同市场周期进行回测,验证策略稳定性
总结
这是一个综合性较强的交易策略,通过多个技术指标和市场情绪的结合,建立了一个相对完整的交易系统。策略的优势在于多维度的信号确认和完善的风险管理机制,但同时也存在参数敏感性和形态识别准确性等问题。通过持续优化和改进,特别是在参数自适应和机器学习应用方面,策略有望获得更好的表现。
||
Overview
This strategy is a comprehensive trading system that combines multiple technical indicators and market sentiment. The core strategy utilizes the crossover signals of short-term and long-term Simple Moving Averages (SMA), combined with MACD indicator for trend confirmation. Additionally, the strategy integrates market sentiment indicators (RSI) and chart pattern recognition systems, including double top/bottom and head and shoulders patterns. The strategy is specifically designed to execute during certain trading sessions to improve efficiency and success rate.
Strategy Principles
The strategy operates based on the following core components:
- Multi-period moving average system: Using 10-period and 30-period SMAs for trend identification
- MACD indicator: Using standard parameters (12,26,9) for trend confirmation
- Market sentiment monitoring: Using RSI indicator for overbought/oversold conditions
- Chart pattern recognition: Including automatic identification of double top/bottom and head and shoulders patterns
- Time filtering: Focusing on specific trading sessions
- Resistance level identification: Using 20-period lookback to determine major resistance levels
Buy conditions require: Being within the target trading session, short-term SMA crossing above long-term SMA, and MACD showing bullish signals. Sell conditions require: Price reaching major resistance levels and MACD showing bearish signals.
Strategy Advantages
- Multi-dimensional signal confirmation: Combining technical indicators and chart patterns improves signal reliability
- Comprehensive risk management: Includes RSI-based early exit mechanisms
- Market sentiment integration: Uses RSI indicator for market sentiment judgment to avoid excessive trading
- Automated pattern recognition: Reduces bias from subjective judgment
- Time filtering: Focuses on high market activity periods for improved efficiency
Strategy Risks
- Parameter sensitivity: Multiple technical indicator parameters may affect strategy performance
- Lag risk: Moving averages and MACD have inherent lag
- Pattern recognition accuracy: Automated recognition systems may produce false signals
- Market environment dependency: May generate frequent false signals in ranging markets
- Time limitations: Trading only during specific sessions may miss opportunities in other periods
Optimization Directions
- Parameter adaptation: Introduce adaptive parameter adjustment mechanisms based on market volatility
- Signal weighting system: Establish a weighting system for various indicator signals to improve decision accuracy
- Stop-loss optimization: Add dynamic stop-loss mechanisms to enhance risk control
- Pattern recognition enhancement: Incorporate machine learning algorithms to improve chart pattern recognition accuracy
- Backtest period extension: Conduct testing across different market cycles to verify strategy stability
Summary
This is a comprehensive trading strategy that establishes a relatively complete trading system through the combination of multiple technical indicators and market sentiment. The strategy's strengths lie in its multi-dimensional signal confirmation and comprehensive risk management mechanisms, though it faces challenges in parameter sensitivity and pattern recognition accuracy. Through continuous optimization and improvement, particularly in parameter adaptation and machine learning applications, the strategy has the potential for enhanced performance. [/trans]
Source (PineScript)
/*backtest
start: 2019-12-23 08:00:00
end: 2024-11-11 00:00:00
period: 1d
basePeriod: 1d
exchanges: [{"eid":"Futures_Binance","currency":"BTC_USDT"}]
*/

//@version=5
strategy("XAUUSD SMA with MACD & Market Sentiment + Chart Patterns", overlay=true)

// Input parameters for moving averages
shortSMA_length = input.int(10, title="Short SMA Length", minval=1)
longSMA_length = input.int(30, title="Long SMA Length", minval=1)

// MACD settings
[macdLine, signalLine, _] = ta.macd(close, 12, 26, 9)

// Lookback period for identifying major resistance (swing highs)
resistance_lookback = input.int(20, title="Resistance Lookback Period", tooltip="Lookback period for identifying major resistance")

// Calculate significant resistance (local swing highs over the lookback period)
major_resistance = ta.highest(close, resistance_lookback)

// Calculate SMAs
shortSMA = ta.sma(close, shortSMA_length)
longSMA = ta.sma(close, longSMA_length)

// RSI for market sentiment
rsiLength = input.int(14, title="RSI Length", minval=1)
rsiOverbought = input.int(70, title="RSI Overbought Level", minval=50, maxval=100)
rsiOversold = input.int(30, title="RSI Oversold Level", minval=0, maxval=50)
rsi = ta.rsi(close, rsiLength)

// Time filtering: only trade during New York session (12:00 PM - 9:00 PM UTC)
isNewYorkSession = true

// Define buy condition based on SMA, MACD, and New York session
buyCondition = isNewYorkSession and ta.crossover(shortSMA, longSMA) and macdLine > signalLine

// Define sell condition: only sell if price is at or above the identified major resistance during New York session
sellCondition = isNewYorkSession and close >= major_resistance and macdLine < signalLine

// Define sentiment-based exit conditions
closeEarlyCondition = strategy.position_size < 0 and rsi > rsiOverbought  // Close losing trade early if RSI is overbought
holdWinningCondition = strategy.position_size > 0 and rsi < rsiOversold   // Hold winning trade if RSI is oversold

// ------ Chart Patterns ------ //

// Double Top/Bottom Pattern Detection
doubleTop = ta.highest(close, 50) == close[25] and ta.highest(close, 50) == close[0] // Approximate double top: two peaks
doubleBottom = ta.lowest(close, 50) == close[25] and ta.lowest(close, 50) == close[0] // Approximate double bottom: two troughs

// Head and Shoulders Pattern Detection
shoulder1 = ta.highest(close, 20)[40]
head = ta.highest(close, 20)[20]
shoulder2 = ta.highest(close, 20)[0]
isHeadAndShoulders = shoulder1 < head and shoulder2 < head and shoulder1 == shoulder2

// Pattern-based signals
patternBuyCondition = isNewYorkSession and doubleBottom and rsi < rsiOversold  // Buy at double bottom in oversold conditions
patternSellCondition = isNewYorkSession and (doubleTop or isHeadAndShoulders) and rsi > rsiOverbought // Sell at double top or head & shoulders in overbought conditions

// Execute strategy: Enter long position when buy conditions are met
if (buyCondition or patternBuyCondition)
    strategy.entry("Buy", strategy.long)

// Close the position when the sell condition is met (price at resistance or pattern sell)
if (sellCondition or patternSellCondition and not holdWinningCondition)
    strategy.close("Buy")

// Close losing trades early if sentiment is against us
if (closeEarlyCondition)
    strategy.close("Buy")

// Visual cues for buy and sell signals
plotshape(series=buyCondition or patternBuyCondition, title="Buy Signal", location=location.belowbar, color=color.green, style=shape.labelup, text="BUY")
plotshape(series=sellCondition or patternSellCondition, title="Sell Signal", location=location.abovebar, color=color.red, style=shape.labeldown, text="SELL")

// ------ Alerts for Patterns ------ //

// Add alert for pattern-based buy condition
alertcondition(patternBuyCondition, title="Pattern Buy Signal Activated", message="Double Bottom or Pattern Buy signal activated: Conditions met.")

// Add alert for pattern-based sell condition
alertcondition(patternSellCondition, title="Pattern Sell Signal Activated", message="Double Top or Head & Shoulders detected. Sell signal triggered.")

// Existing alerts for SMA/MACD-based conditions
alertcondition(buyCondition, title="Buy Signal Activated", message="Buy signal activated: Short SMA has crossed above Long SMA and MACD is bullish.")
alertcondition(sellCondition, title="Sell at Major Resistance", message="Sell triggered at major resistance level.")
alertcondition(closeEarlyCondition, title="Close Losing Trade Early", message="Sentiment is against your position, close trade.")
alertcondition(holdWinningCondition, title="Hold Winning Trade", message="RSI indicates oversold conditions, holding winning trade.")
Detail
https://www.fmz.com/strategy/471702
Last Modified
2024-11-12 15:52:16