
8.3 KiB
Name
多周期布林带触碰趋势反转量化交易策略-Multi-Period-Bollinger-Bands-Touch-Trend-Reversal-Quantitative-Trading-Strategy
Author
ChaoZhang
Strategy Description
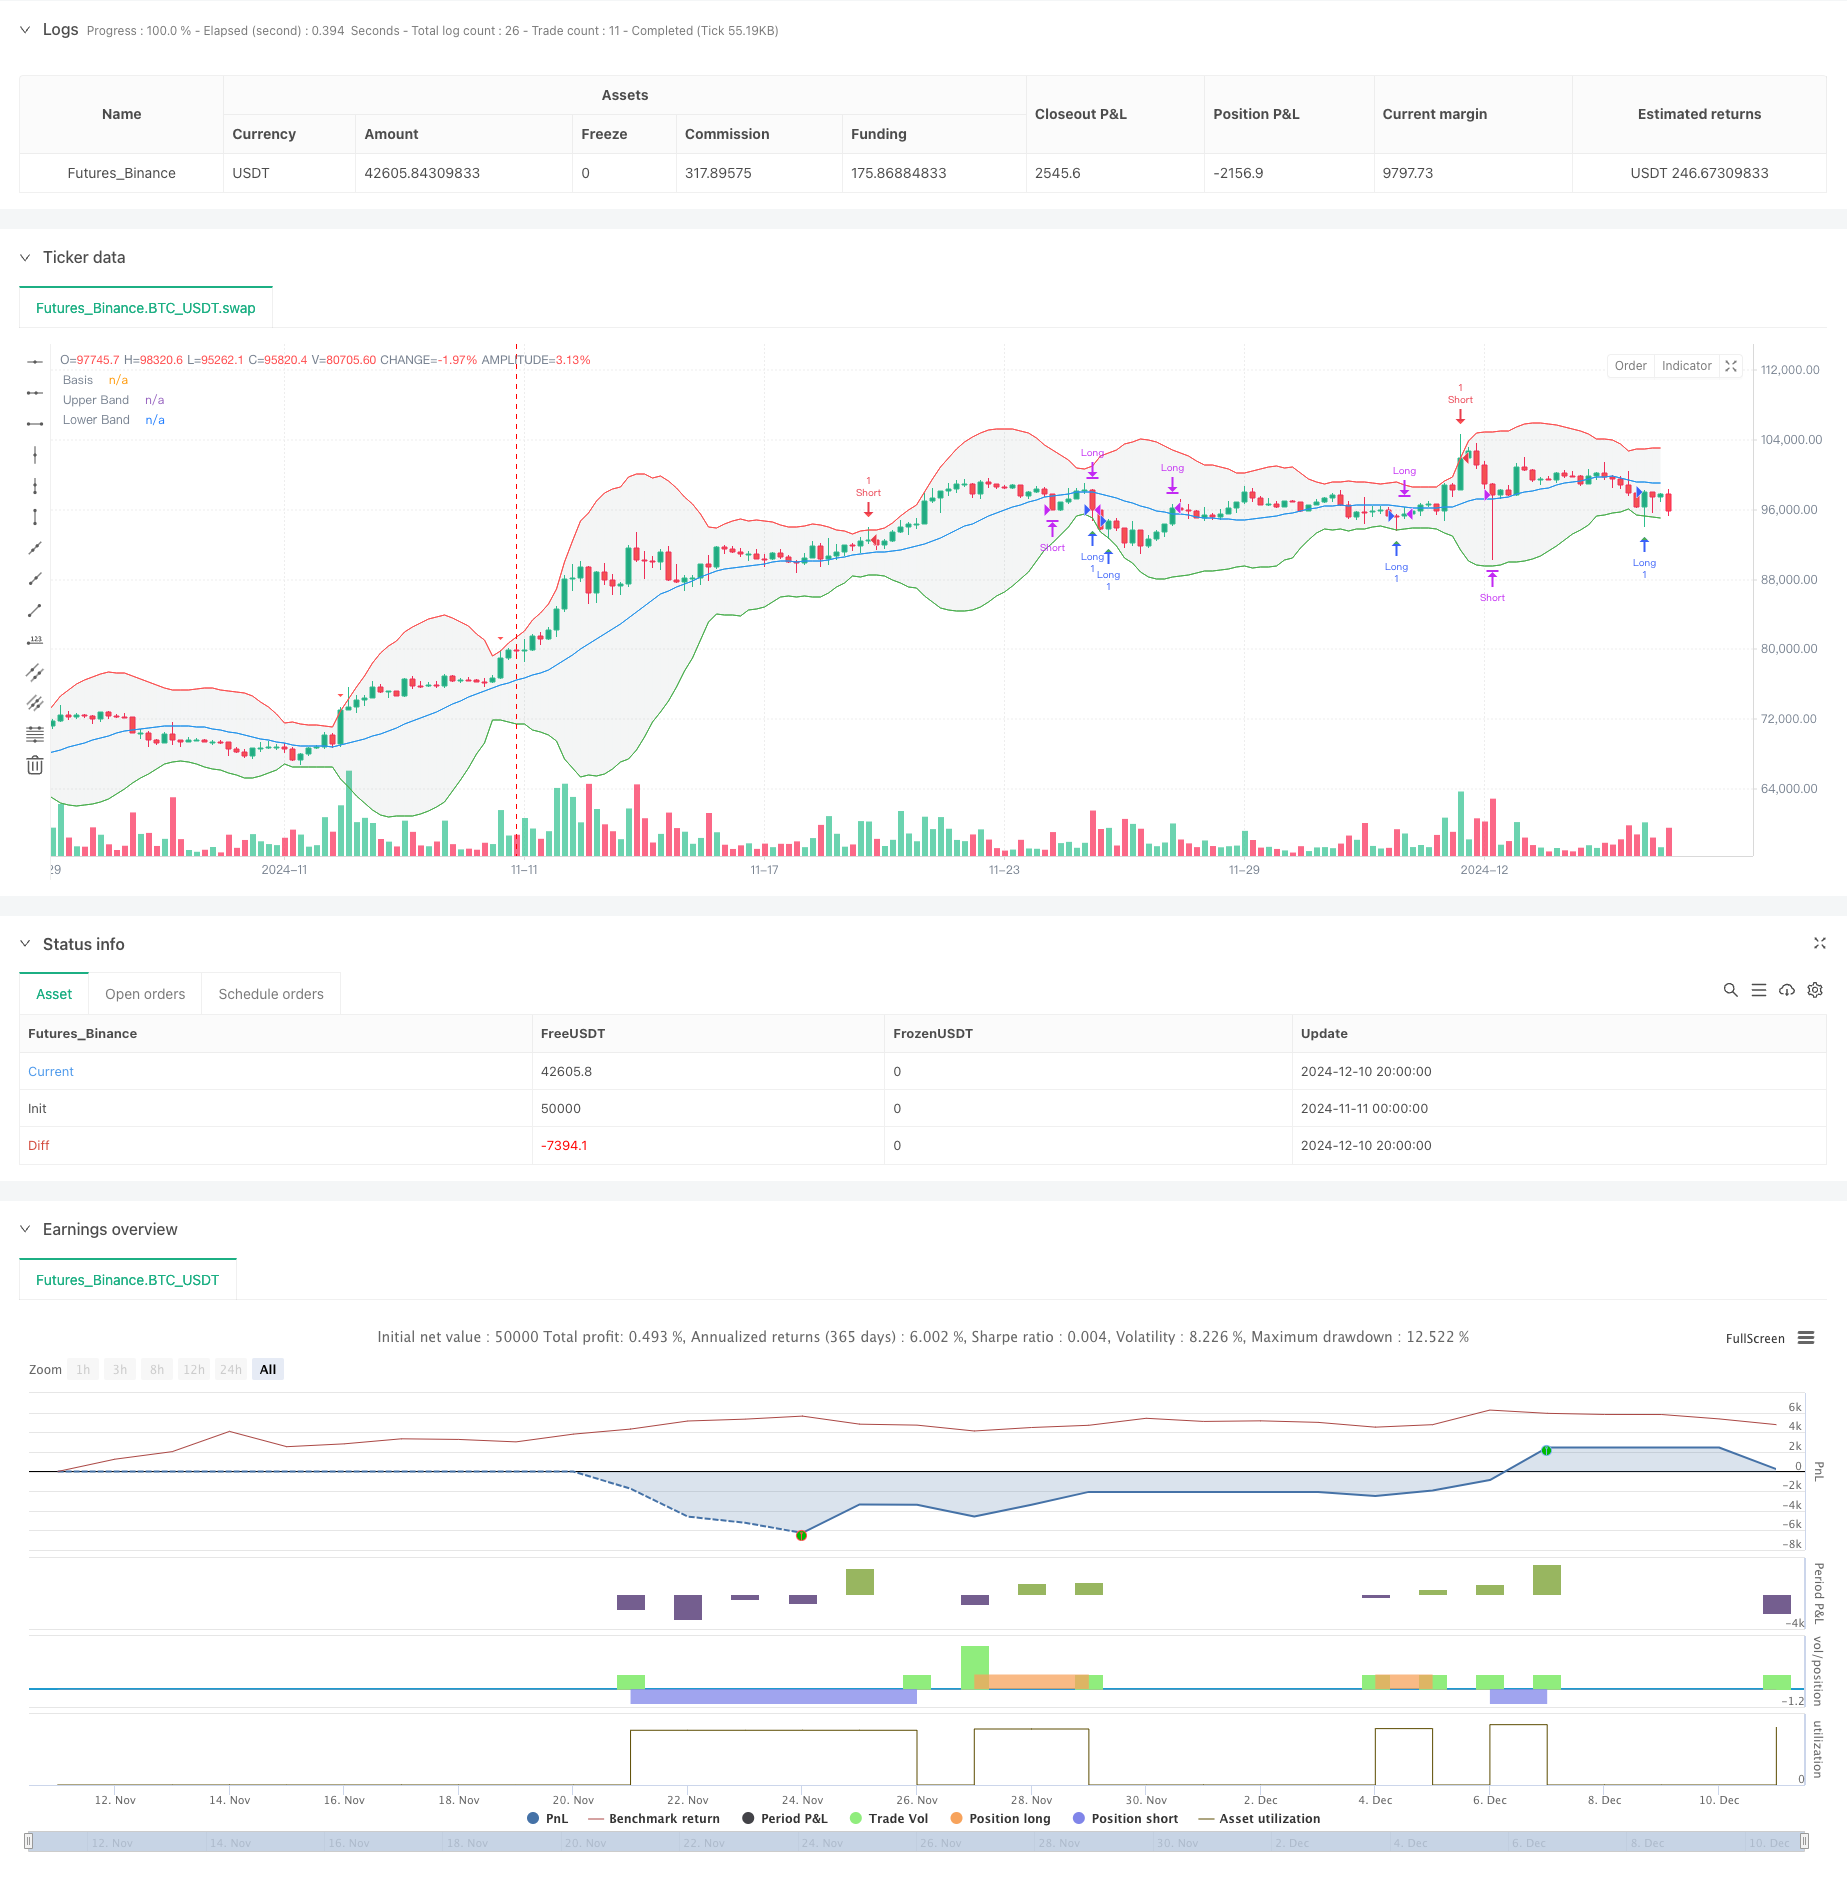
[trans]
概述
该策略是一个基于布林带指标的趋势反转交易系统,通过监测价格与布林带的触碰关系来捕捉市场反转机会。策略在5分钟时间周期上运行,使用20周期移动平均线作为布林带中轨,并设置3.4倍标准差作为布林带上下轨的参数。当价格触及布林带上下轨时,系统会发出相应的交易信号。
策略原理
策略的核心逻辑建立在价格回归理论基础上。当价格触及布林带下轨时,系统认为市场已经超卖,倾向于做多;当价格触及布林带上轨时,系统认为市场已经超买,倾向于做空。具体来说:
- 做多条件:当5分钟K线的最低价首次触及或突破布林带下轨时(当前K线最低价<=下轨且前一根K线最低价>下轨)
- 做空条件:当5分钟K线的最高价首次触及或突破布林带上轨时(当前K线最高价>=上轨且前一根K线最高价<上轨)
- 出场条件:价格回归到布林带中轨时平仓
策略优势
- 指标选择合理:布林带集成了趋势和波动率信息,能有效识别市场状态
- 入场时机精准:通过首次触碰布林带来捕捉反转信号,避免了追涨杀跌
- 风控逻辑完善:采用移动平均线作为止盈基准,既保护盈利又不过早离场
- 参数配置科学:3.4倍标准差的设置可以有效过滤虚假信号
- 系统结构清晰:交易逻辑简单直观,便于维护和优化
策略风险
- 趋势突破风险:在强趋势市场中,价格可能持续突破布林带导致频繁止损
- 震荡市场风险:区间震荡时期可能产生过多虚假信号增加交易成本
- 参数敏感性:布林带参数的细微变化可能对策略表现产生较大影响
- 滑点影响:高波动率环境下可能面临严重滑点导致策略表现恶化
- 时间周期依赖:策略在不同时间周期的表现可能存在显著差异
策略优化方向
- 多重时间周期:引入更长周期的布林带确认,提高信号可靠性
- 趋势过滤:增加趋势判断指标,在趋势方向明确时才开仓
- 动态参数:根据市场波动率自适应调整布林带参数
- 止损优化:设置跟踪止损或基于ATR的止损来提高风控效果
- 仓位管理:根据信号强度和市场波动率动态调整持仓比例
总结
该策略通过布林带触碰来捕捉市场反转机会,具有逻辑清晰、风控合理的特点。通过合理的参数设置和完善的交易规则,策略在震荡市场中表现出较好的稳定性。但在实盘应用时仍需注意趋势突破风险,建议结合其他技术指标进行交易确认,并根据市场状态动态调整策略参数。优化方向主要集中在多周期协同、趋势过滤和动态参数调整等方面。 ||
Overview
This strategy is a trend reversal trading system based on the Bollinger Bands indicator, which captures market reversal opportunities by monitoring the relationship between price and Bollinger Bands. The strategy operates on a 5-minute timeframe, using a 20-period moving average as the middle band and 3.4 standard deviations for the upper and lower bands. Trading signals are generated when prices touch the upper or lower bands.
Strategy Principle
The core logic is built on mean reversion theory. When price touches the lower band, the system considers the market oversold and tends to go long; when price touches the upper band, the system considers the market overbought and tends to go short. Specifically:
- Long condition: When the 5-minute candlestick's low first touches or breaks the lower band (current low <= lower band AND previous low > lower band)
- Short condition: When the 5-minute candlestick's high first touches or breaks the upper band (current high >= upper band AND previous high < upper band)
- Exit condition: Close positions when price reverts to the middle band
Strategy Advantages
- Rational indicator selection: Bollinger Bands integrate trend and volatility information for effective market state identification
- Precise entry timing: Captures reversal signals through first touch of bands, avoiding chasing trends
- Robust risk control: Uses moving average as profit-taking benchmark, protecting profits without premature exits
- Scientific parameter configuration: 3.4 standard deviation setting effectively filters false signals
- Clear system structure: Simple and intuitive trading logic, easy to maintain and optimize
Strategy Risks
- Trend breakthrough risk: In strong trend markets, continuous band breakouts may lead to frequent stops
- Range-bound market risk: May generate excessive false signals during consolidation periods
- Parameter sensitivity: Minor changes in Bollinger Bands parameters can significantly impact strategy performance
- Slippage impact: High volatility environments may face severe slippage affecting strategy performance
- Timeframe dependency: Strategy performance may vary significantly across different timeframes
Strategy Optimization Directions
- Multiple timeframes: Introduce longer period Bollinger Bands for confirmation to improve signal reliability
- Trend filtering: Add trend identification indicators to only trade in clear trend directions
- Dynamic parameters: Adapt Bollinger Bands parameters based on market volatility
- Stop-loss optimization: Implement trailing stops or ATR-based stops to improve risk control
- Position management: Dynamically adjust position sizes based on signal strength and market volatility
Summary
This strategy captures market reversal opportunities through Bollinger Bands touches, featuring clear logic and reasonable risk control. Through appropriate parameter settings and comprehensive trading rules, the strategy shows good stability in range-bound markets. However, when applying to live trading, attention must be paid to trend breakthrough risks. It is recommended to combine other technical indicators for trade confirmation and dynamically adjust strategy parameters based on market conditions. Optimization focuses mainly on multi-period coordination, trend filtering, and dynamic parameter adjustment.[/trans]
Source (PineScript)
/*backtest
start: 2024-11-11 00:00:00
end: 2024-12-11 00:00:00
period: 5h
basePeriod: 5h
exchanges: [{"eid":"Futures_Binance","currency":"BTC_USDT"}]
*/

//@version=5
strategy("5-Min Bollinger Bands Touch Strategy", overlay=true, margin_long=100, margin_short=100)

// Input parameters
length = input(20, title="Bollinger Bands Length")
mult = input(3.4, title="Bollinger Bands Deviation")

// Bollinger Bands calculation
basis = ta.sma(close, length)
dev = mult * ta.stdev(close, length)
upper = basis + dev
lower = basis - dev

// Plot Bollinger Bands
plot(basis, color=color.blue, title="Basis")
p1 = plot(upper, color=color.red, title="Upper Band")
p2 = plot(lower, color=color.green, title="Lower Band")
fill(p1, p2, color=color.new(color.gray, 90))

// Bullish buying condition: 5-min low touches lower Bollinger Band
bullish_entry = low <= lower and low[1] > lower[1]

// Bearish selling condition: 5-min high touches upper Bollinger Band
bearish_entry = high >= upper and high[1] < upper[1]

// Entry and exit conditions
longCondition = bullish_entry
shortCondition = bearish_entry

// Strategy entries
if (longCondition)
    strategy.entry("Long", strategy.long)

if (shortCondition)
    strategy.entry("Short", strategy.short)

// Optional: Add exit conditions (you may want to customize these)
// Example: Exit long position after a certain profit or loss
strategy.close("Long", when = high >= basis)
strategy.close("Short", when = low <= basis)

// Alerts
alertcondition(bullish_entry, title='Bullish BB Touch', message='5-min low touched Lower Bollinger Band')
alertcondition(bearish_entry, title='Bearish BB Touch', message='5-min high touched Upper Bollinger Band')

// Plot entry points
plotshape(bullish_entry, title="Bullish Entry", location=location.belowbar, style=shape.triangleup, size=size.small, color=color.green)
plotshape(bearish_entry, title="Bearish Entry", location=location.abovebar, style=shape.triangledown, size=size.small, color=color.red)
Detail
https://www.fmz.com/strategy/474840
Last Modified
2024-12-12 14:37:30