
18 KiB
Name
多周期布林带突破回归交易策略-Multi-Timeframe-Bollinger-Band-Breakout-Reversion-Strategy
Author
ianzeng123
Strategy Description
[trans]
概述
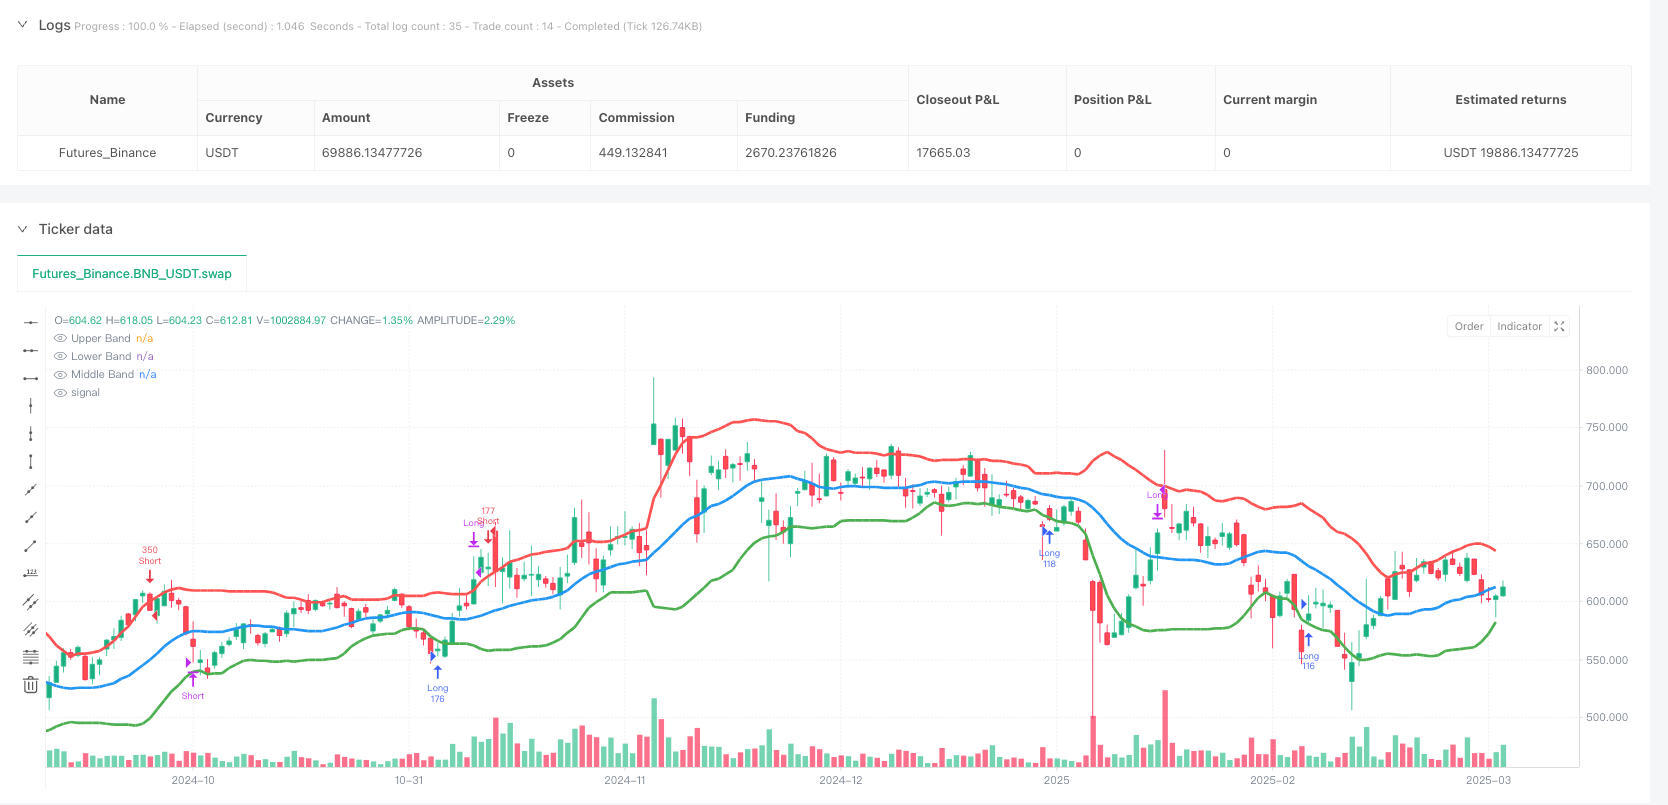
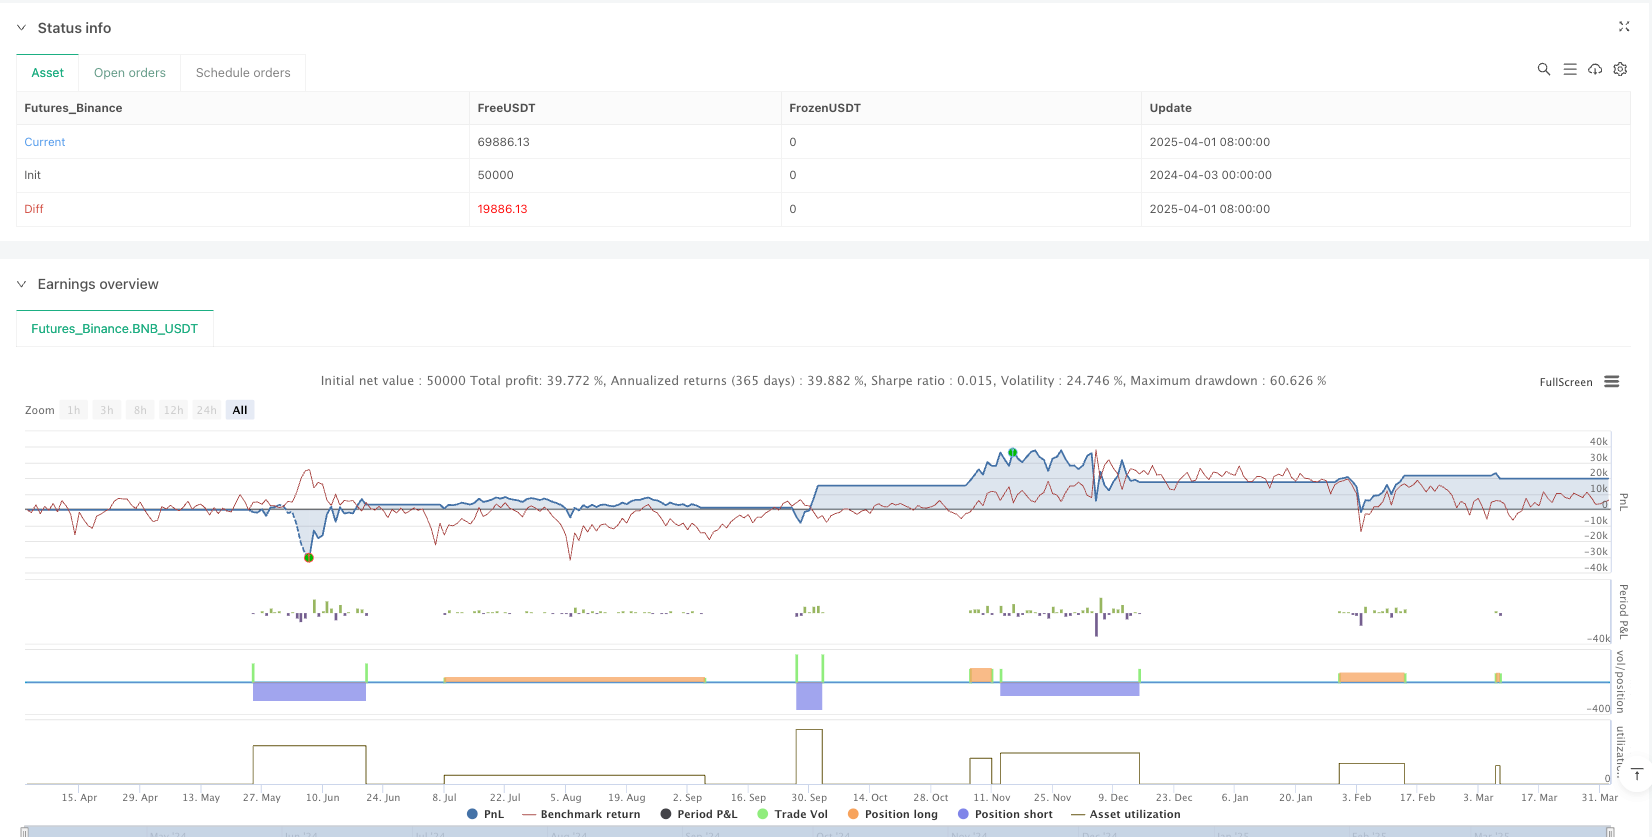
多周期布林带突破回归交易策略是一种基于价格波动性的均值回归交易系统,专注于捕捉市场过度扩张后的回调机会。该策略利用布林带指标(由20周期简单移动平均线和1.5倍标准差构成)识别市场极端行为,并在特定条件触发时执行交易。当价格完全突破上轨后回落或突破下轨后反弹时,系统会分别产生做空或做多信号,同时结合精确的风险管理机制,确保每笔交易风险受控,并追求3:1的回报比率。
策略原理
该策略的核心原理是基于均值回归理论,认为价格在短期内大幅偏离均值后往往会回归。具体实现逻辑如下:
-
信号识别机制:
- 做空条件:当某根K线完全形成在上轨之上(开盘价、收盘价和最低价均高于上轨),且在随后的四根K线内,价格跌破该信号K线的最低点,触发做空信号。
- 做多条件:当某根K线完全形成在下轨之下(开盘价、收盘价和最高价均低于下轨),且在随后的四根K线内,价格突破该信号K线的最高点,触发做多信号。
-
动态止损设置:
- 做空交易:将止损点设置在突破上轨信号K线的最高点。
- 做多交易:将止损点设置在突破下轨信号K线的最低点。
-
精确仓位计算:
- 系统根据每笔交易固定风险额度(4000印度卢比)和实时计算的止损距离,动态确定每笔交易的数量,确保无论市场波动性如何,风险额度保持一致。
-
渐进式止损管理:
- 当交易获利达到风险额的2倍时,止损位移至入场价(保本位),锁定部分利润。
- 当获利达到风险额的3倍时,系统自动平仓,完成交易。
-
有效性时间窗口:
- 信号K线出现后,系统仅考虑4根K线内的突破行为,超过此窗口则信号失效,避免滞后交易。
策略优势
-
精确的风险控制:通过动态计算交易数量,确保每笔交易的最大风险固定在4000印度卢比,实现了精准的风险管理。
-
自适应市场波动性:布林带基于标准差计算,能够随市场波动性变化而自动调整,使策略在不同市场环境下保持适应性。
-
清晰的交易规则:入场、止损和获利条件明确定义,减少主观判断,提高交易纪律性。
-
渐进式风险管理:当交易朝有利方向发展时,通过移动止损至入场价位,实现"零风险"交易,优化风险回报结构。
-
均值回归捕捉:有效利用市场过度扩张后的回归趋势,专注于高概率交易机会。
-
时间限制过滤:通过4根K线的有效期限制,避免执行过时信号,提高交易时效性。
-
视觉反馈系统:通过加粗的布林带曲线,提供直观的市场状态参考,辅助交易决策。
策略风险
-
快速趋势转变风险:在强劲趋势市场中,价格可能不遵循均值回归逻辑,导致连续止损触发。解决方法是增加趋势过滤器,在强趋势环境中暂停反向交易。
-
低流动性环境风险:在交易量不足的市场中,可能难以以理想价格执行大量订单,影响实际风险控制效果。建议增加流动性检测机制,在低流动性环境下减少交易规模。
-
参数优化过度风险:固定的布林带参数(20周期SMA和1.5倍标准差)可能在不同市场或时期表现不一。建议实施自适应参数系统,根据市场状况动态调整。
-
极端市场风险:在市场跳空或剧烈波动期间,实际止损可能远超预设水平。建议引入更复杂的止损策略,如基于ATR的动态止损或价位分散止损。
-
频繁交易风险:在高波动环境下,策略可能产生过多信号,增加交易成本。可考虑添加信号质量过滤器,仅执行最高质量的交易机会。
-
资金管理风险:固定风险金额可能不适合所有账户规模。应实施基于账户百分比的风险管理,而非固定金额。
策略优化方向
-
多周期确认系统:引入多时间框架分析,要求交易信号在较高时间框架得到确认,以提高交易成功率。例如,只有当日线图也呈现均值回归趋势时,才执行小时级别的交易信号。
-
动态布林带参数:实现布林带参数的自适应调整,基于市场波动性或交易品种特性,动态选择最优的周期和标准差倍数。
-
市场环境过滤:增加市场类型识别算法,在震荡市中执行完整策略,而在趋势市中选择性执行顺势信号,提高策略适应性。
-
量价结合分析:结合交易量指标确认突破信号的有效性,例如要求突破时伴随成交量明显增加,过滤虚假突破。
-
分步获利策略:优化固定的3倍风险获利模式,改为分批获利系统,例如在2倍风险时平仓50%,3倍风险时平仓剩余部分,提高资金效率。
-
机器学习优化:引入机器学习模型对历史信号进行分类,识别高胜率和低胜率信号的特征,建立更精细的信号过滤机制。
-
相关性分析集成:在投资组合中考虑多品种交易时,增加相关性分析,避免同时执行高度相关品种的同向交易,降低系统性风险。
-
资金管理升级:将固定金额风险转换为基于账户规模的动态风险分配,如账户总额的0.5%-2%,实现风险与账户规模的动态平衡。
总结
多周期布林带突破回归交易策略是一种高度结构化、规则明确的技术分析交易系统,通过布林带指标捕捉市场过度行为后的回归机会。其核心优势在于精确的风险控制、清晰的交易规则和渐进式止损管理,使交易者能够在控制风险的同时追求可观回报。
然而,该策略也面临趋势市场适应性差、参数优化过度和极端市场风险等挑战。通过引入多周期确认、动态参数调整、市场环境过滤和资金管理升级等优化措施,可以显著提升策略的稳健性和适应性。
对于寻求均值回归交易机会的投资者而言,此策略提供了一个系统化的方法,既保持了执行纪律,又留有足够的优化空间适应不同市场环境。最终,成功实施该策略需要对市场动态的深入理解、持续的系统优化以及严格的风险管理规范。 ||
Overview
The Multi-Timeframe Bollinger Band Breakout Reversion Strategy is a mean-reversion trading system based on price volatility, focused on capturing market corrections after excessive expansion. This strategy utilizes the Bollinger Bands indicator (composed of a 20-period Simple Moving Average and 1.5 standard deviations) to identify extreme market behavior and executes trades when specific conditions are triggered. When price completely breaks above the upper band and then retraces, or breaks below the lower band and then rebounds, the system generates short or long signals respectively, combined with precise risk management mechanisms to ensure controlled risk for each trade while targeting a 3:1 reward ratio.
Strategy Principles
The core principle of this strategy is based on mean reversion theory, which suggests that prices tend to revert to their mean after significant short-term deviations. The specific implementation logic is as follows:
-
Signal Identification Mechanism:
- Short Condition: When a candle forms completely above the upper band (open, close, and low all higher than the upper band), and within the next four candles, the price breaks below the signal candle's lowest point, triggering a short signal.
- Long Condition: When a candle forms completely below the lower band (open, close, and high all lower than the lower band), and within the next four candles, the price breaks above the signal candle's highest point, triggering a long signal.
-
Dynamic Stop Loss Setting:
- Short Trade: Set the stop loss at the highest point of the signal candle that broke above the upper band.
- Long Trade: Set the stop loss at the lowest point of the signal candle that broke below the lower band.
-
Precise Position Calculation:
- The system dynamically determines the quantity for each trade based on a fixed risk amount (4000 Indian Rupees) and the real-time calculated stop loss distance, ensuring consistent risk exposure regardless of market volatility.
-
Progressive Stop Loss Management:
- When a trade profits reach twice the risk amount, the stop loss moves to the entry price (breakeven), securing partial profits.
- When profits reach three times the risk amount, the system automatically closes the position, completing the trade.
-
Effectiveness Time Window:
- After a signal candle appears, the system only considers breakouts within the next 4 candles; beyond this window, the signal becomes invalid, avoiding delayed trades.
Strategy Advantages
-
Precise Risk Control: By dynamically calculating trading quantity, the maximum risk for each trade is fixed at 4000 Indian Rupees, achieving precise risk management.
-
Adaptive to Market Volatility: Bollinger Bands, calculated based on standard deviation, automatically adjust with market volatility changes, maintaining strategy adaptability across different market environments.
-
Clear Trading Rules: Entry, stop loss, and profit targets are clearly defined, reducing subjective judgment and improving trading discipline.
-
Progressive Risk Management: When trades move favorably, moving stops to breakeven creates "zero-risk" trades, optimizing the risk-reward structure.
-
Mean Reversion Capture: Effectively utilizes the reversion tendency after market overextension, focusing on high-probability trading opportunities.
-
Time Limit Filtering: The 4-candle validity period prevents executing outdated signals, improving trading timeliness.
-
Visual Feedback System: Thickened Bollinger Band curves provide intuitive market state references, assisting trading decisions.
Strategy Risks
-
Rapid Trend Reversal Risk: In strong trending markets, prices may not follow mean reversion logic, leading to consecutive stop losses. The solution is to add trend filters to pause counter-trend trades in strong trend environments.
-
Low Liquidity Environment Risk: In markets with insufficient volume, it may be difficult to execute large orders at ideal prices, affecting actual risk control. Consider adding liquidity detection mechanisms to reduce trading size in low liquidity environments.
-
Parameter Optimization Overfit Risk: Fixed Bollinger Band parameters (20-period SMA and 1.5 standard deviations) may perform inconsistently across different markets or periods. Implementing adaptive parameter systems that dynamically adjust based on market conditions is recommended.
-
Extreme Market Risk: During market gaps or violent fluctuations, actual stop losses may far exceed preset levels. Consider introducing more complex stop loss strategies, such as ATR-based dynamic stops or distributed price-based stops.
-
Frequent Trading Risk: In highly volatile environments, the strategy may generate too many signals, increasing transaction costs. Consider adding signal quality filters to execute only the highest quality trading opportunities.
-
Capital Management Risk: Fixed risk amounts may not be suitable for all account sizes. Implement percentage-based risk management rather than fixed amounts.
Strategy Optimization Directions
-
Multi-Timeframe Confirmation System: Introduce multi-timeframe analysis, requiring trade signals to be confirmed on higher timeframes to improve success rates. For example, only execute hourly-level trade signals when the daily chart also shows mean reversion tendencies.
-
Dynamic Bollinger Band Parameters: Implement adaptive adjustment of Bollinger Band parameters based on market volatility or instrument characteristics, dynamically selecting optimal periods and standard deviation multipliers.
-
Market Environment Filtering: Add market type recognition algorithms to execute the complete strategy in oscillating markets while selectively executing trend-following signals in trending markets, improving strategy adaptability.
-
Volume-Price Combined Analysis: Incorporate volume indicators to confirm breakout signal validity, for example, requiring noticeable volume increases with breakouts to filter false breakouts.
-
Stepped Profit Strategy: Optimize the fixed 3x risk profit model to a partial profit-taking system, such as closing 50% at 2x risk and the remainder at 3x risk, improving capital efficiency.
-
Machine Learning Optimization: Introduce machine learning models to classify historical signals, identifying features of high and low win-rate signals to establish more refined signal filtering mechanisms.
-
Correlation Analysis Integration: When trading multiple instruments in a portfolio, add correlation analysis to avoid simultaneous directional trades in highly correlated instruments, reducing systemic risk.
-
Capital Management Upgrade: Convert fixed amount risk to dynamic risk allocation based on account size, such as 0.5%-2% of total account value, achieving dynamic balance between risk and account size.
Summary
The Multi-Timeframe Bollinger Band Breakout Reversion Strategy is a highly structured, rule-based technical analysis trading system that captures mean reversion opportunities after excessive market behavior using the Bollinger Bands indicator. Its core advantages lie in precise risk control, clear trading rules, and progressive stop loss management, allowing traders to pursue substantial returns while controlling risk.
However, this strategy also faces challenges such as poor adaptability in trending markets, parameter optimization overfit, and extreme market risks. By introducing multi-timeframe confirmation, dynamic parameter adjustment, market environment filtering, and capital management upgrades, the strategy's robustness and adaptability can be significantly enhanced.
For investors seeking mean reversion trading opportunities, this strategy provides a systematic approach that maintains execution discipline while leaving sufficient optimization space for adapting to different market environments. Ultimately, successful implementation of this strategy requires deep understanding of market dynamics, continuous system optimization, and strict risk management standards.[/trans]
Source (PineScript)
/*backtest
start: 2024-04-03 00:00:00
end: 2025-04-02 00:00:00
period: 1d
basePeriod: 1d
exchanges: [{"eid":"Futures_Binance","currency":"BNB_USDT"}]
*/

//@version=5
strategy("Bollinger Band Long & Short Strategy", overlay=true)

// Bollinger Bands settings
length = 20
src = close
mult = 1.5
basis = ta.sma(src, length)
deviation = ta.stdev(src, length)
upperBand = basis + (mult * deviation)
lowerBand = basis - (mult * deviation)

// Detecting a candle fully outside the upper Bollinger Band
prevCandleOutsideUpper = (close[1] > upperBand[1]) and (open[1] > upperBand[1]) and (low[1] > upperBand[1])

// Detecting a candle fully outside the lower Bollinger Band
prevCandleOutsideLower = (close[1] < lowerBand[1]) and (open[1] < lowerBand[1]) and (high[1] < lowerBand[1])

// Entry condition - Only within the next 4 candles break the low of the previous candle (Short)
breaksLow = ta.lowest(low, 4) < low[1] and ta.barssince(prevCandleOutsideUpper) <= 4

// Entry condition - Only within the next 4 candles break the high of the previous candle (Long)
breaksPrevHigh = ta.highest(high, 4) > high[1] and ta.barssince(prevCandleOutsideLower) <= 4

var float entryPrice = na
var float stopLoss = na
var float takeProfit = na
var float breakevenLevel = na
var float quantity = na
maxLoss = 4000.0 // Max loss set to INR 4000 per trade

// Short Trade
if prevCandleOutsideUpper and breaksLow
    entryPrice := low[1]
    stopLoss := high[1] // Stop-loss set to the high of the candle outside the upper BB
    risk = stopLoss - entryPrice
    quantity := risk > 0 ? math.floor(maxLoss / risk) : na // Ensuring risk is exactly 4000 per trade
    takeProfit := entryPrice - (risk * 3) // Adjusted for 1:3 risk-reward
    breakevenLevel := entryPrice - (risk * 2) // 1:2 level where stop loss moves to breakeven
    if not na(quantity) and quantity > 0
        strategy.entry("Short", strategy.short, qty=quantity)

// Move SL to breakeven if 1:2 is reached for Short
if strategy.position_size < 0 and close <= breakevenLevel
    strategy.exit("Move SL to breakeven", from_entry="Short", stop=entryPrice)

// Close trade at 1:3 for Short
if strategy.position_size < 0 and close <= takeProfit
    strategy.close("Short")

// Long Trade
if prevCandleOutsideLower and breaksPrevHigh
    entryPrice := high[1]
    stopLoss := low[1] // Stop-loss set to the low of the candle outside the lower BB
    risk = entryPrice - stopLoss
    quantity := risk > 0 ? math.floor(maxLoss / risk) : na // Ensuring risk is exactly 4000 per trade
    takeProfit := entryPrice + (risk * 3) // Adjusted for 1:3 risk-reward
    breakevenLevel := entryPrice + (risk * 2) // 1:2 level where stop loss moves to breakeven
    if not na(quantity) and quantity > 0
        strategy.entry("Long", strategy.long, qty=quantity)

// Move SL to breakeven if 1:2 is reached for Long
if strategy.position_size > 0 and close >= breakevenLevel
    strategy.exit("Move SL to breakeven", from_entry="Long", stop=entryPrice)

// Close trade at 1:3 for Long
if strategy.position_size > 0 and close >= takeProfit
    strategy.close("Long")

// Plot Bollinger Bands with increased visibility
plot(upperBand, color=color.red, linewidth=3, title="Upper Band")
plot(lowerBand, color=color.green, linewidth=3, title="Lower Band")
plot(basis, color=color.blue, linewidth=3, title="Middle Band")
Detail
https://www.fmz.com/strategy/489281
Last Modified
2025-04-03 10:26:06