
10 KiB
Name
多周期均线趋势动量跟踪交易策略-Multi-Timeframe-EMA-Trend-Momentum-Trading-Strategy
Author
ChaoZhang
Strategy Description
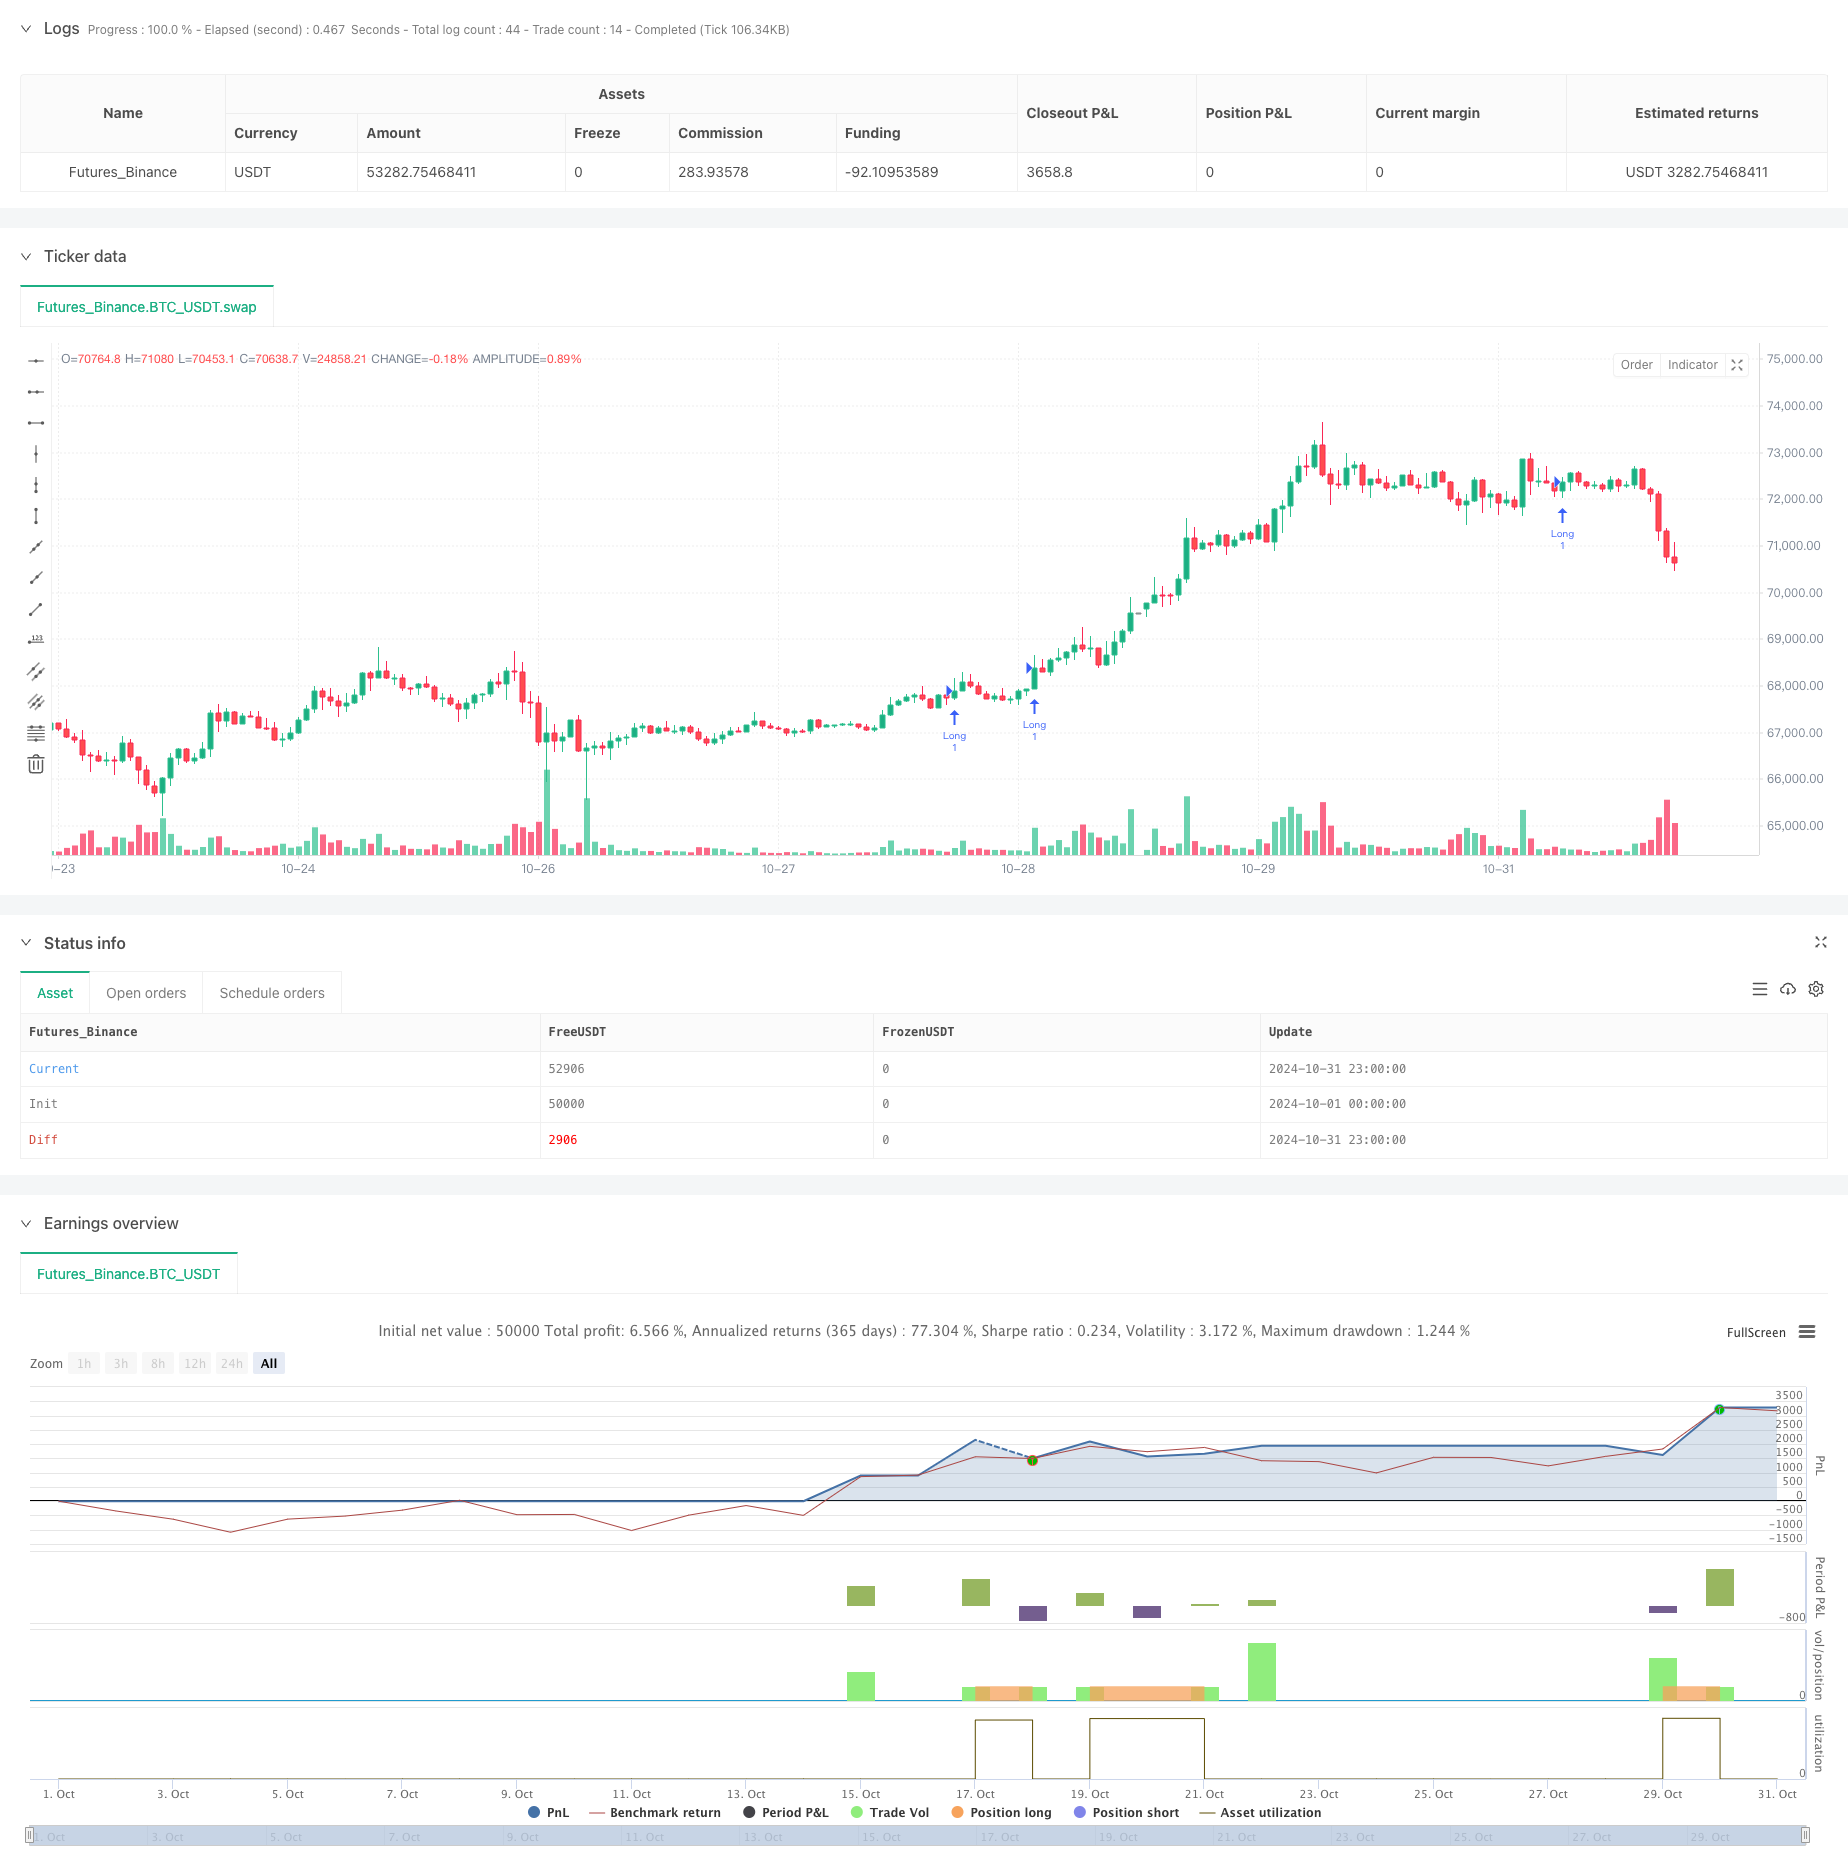
[trans]
概述
这是一个结合了多周期均线趋势跟踪和动量分析的量化交易策略。策略主要通过分析20、50、100和200日指数移动平均线(EMA)的排列组合,结合日线和周线的动量指标进行交易。策略采用ATR止损方式,在EMA对齐且动量条件满足时入场,通过设定ATR倍数的止损和获利目标来管理风险。
策略原理
策略的核心逻辑包括以下几个关键部分:
- EMA对齐系统:要求20日EMA位于50日EMA之上,50日EMA位于100日EMA之上,100日EMA位于200日EMA之上,形成完美的多头排列。
- 动量确认系统:分别在日线和周线时间周期计算基于线性回归的自定义动量指标。该动量指标通过对价格与Keltner通道中轴的偏离程度进行线性回归来衡量。
- 回调入场系统:价格需要回调到20日EMA的指定百分比范围内才允许入场,避免追高。
- 风险管理系统:使用ATR的倍数设置止损和获利目标,默认止损为1.5倍ATR,获利目标为3倍ATR。
策略优势
- 多重确认机制:通过均线排列、多周期动量和价格回调等多重条件确认,降低虚假信号。
- 科学的风险管理:采用ATR动态调整止损和获利目标,适应市场波动性变化。
- 趋势跟踪与动量结合:既可以抓住大趋势,又能在趋势中把握较好的入场时机。
- 可定制性强:策略的各个参数都可以根据不同市场特点进行优化调整。
- 多周期分析:通过日线和周线的配合,提高信号的可靠性。
策略风险
- 均线滞后性:EMA作为滞后指标可能导致入场时机偏晚。建议结合其他领先指标。
- 震荡市不适用:策略在横盘震荡市场可能频繁产生虚假信号。建议加入市场环境过滤器。
- 回撤风险:虽然有ATR止损,但在极端行情下仍可能面临较大回撤。可以考虑设置最大回撤限制。
- 参数敏感性:策略效果对参数设置较为敏感。建议进行充分的参数优化测试。
策略优化方向
- 市场环境识别:加入波动率指标或趋势强度指标,在不同市场环境下使用不同的参数组合。
- 入场优化:可以增加RSI等摆动指标,在回调区域内寻找更精确的入场点。
- 动态参数调整:根据市场波动性自动调整ATR倍数和回调范围。
- 加入成交量分析:通过成交量确认趋势强度,提高信号可靠性。
- 引入机器学习:使用机器学习算法动态优化参数,提高策略适应性。
总结
这是一个设计合理、逻辑严谨的趋势跟踪策略。通过多重技术指标的配合使用,既保证了策略的稳健性,又提供了良好的风险管理机制。策略的可定制性强,可以根据不同市场特点进行优化。虽然存在一些固有的风险,但通过建议的优化方向可以进一步提升策略的表现。总的来说,这是一个值得尝试和深入研究的量化交易策略。
||
Overview
This is a quantitative trading strategy that combines multi-timeframe EMA trend following with momentum analysis. The strategy primarily analyzes the alignment of 20, 50, 100, and 200-day exponential moving averages (EMA) combined with momentum indicators on both daily and weekly timeframes. It employs ATR-based stop losses and enters trades when EMAs are aligned and momentum conditions are met, managing risk through ATR-multiple stop-loss and profit targets.
Strategy Principles
The core logic includes several key components:
- EMA Alignment System: Requires 20-day EMA above 50-day EMA, which is above 100-day EMA, which is above 200-day EMA, forming a perfect bullish alignment.
- Momentum Confirmation System: Calculates custom momentum indicators based on linear regression on both daily and weekly timeframes. This momentum is measured through linear regression of price deviation from the Keltner Channel midline.
- Pullback Entry System: Price must pull back within a specified percentage range of the 20-day EMA for entry, avoiding chase-buying.
- Risk Management System: Uses ATR multiples to set stop-loss and profit targets, defaulting to 1.5x ATR for stop-loss and 3x ATR for profit target.
Strategy Advantages
- Multiple Confirmation Mechanism: Reduces false signals through multiple conditions including EMA alignment, multi-timeframe momentum, and price pullback.
- Scientific Risk Management: Uses ATR to dynamically adjust stop-loss and profit targets, adapting to market volatility changes.
- Trend Following with Momentum: Captures major trends while optimizing entry timing within trends.
- High Customizability: All strategy parameters can be optimized for different market characteristics.
- Multi-timeframe Analysis: Improves signal reliability through daily and weekly timeframe coordination.
Strategy Risks
- EMA Lag: EMAs as lagging indicators may result in delayed entries. Consider incorporating leading indicators.
- Poor Performance in Ranging Markets: Strategy may generate frequent false signals in sideways markets. Consider adding market environment filters.
- Drawdown Risk: Despite ATR stops, significant drawdowns possible in extreme conditions. Consider implementing maximum drawdown limits.
- Parameter Sensitivity: Strategy performance is sensitive to parameter settings. Thorough parameter optimization testing recommended.
Optimization Directions
- Market Environment Recognition: Add volatility or trend strength indicators to use different parameter sets in different market conditions.
- Entry Optimization: Add oscillators like RSI for more precise entry points within pullback zones.
- Dynamic Parameter Adjustment: Automatically adjust ATR multiples and pullback ranges based on market volatility.
- Volume Analysis Integration: Confirm trend strength through volume analysis to improve signal reliability.
- Machine Learning Implementation: Use machine learning algorithms to dynamically optimize parameters and improve strategy adaptability.
Summary
This is a well-designed, logically rigorous trend-following strategy. Through the combination of multiple technical indicators, it ensures both strategy robustness and effective risk management. The strategy's high customizability allows optimization for different market characteristics. While inherent risks exist, the suggested optimization directions can further enhance strategy performance. Overall, this is a quantitative trading strategy worth experimenting with and studying in depth. [/trans]
Source (PineScript)
/*backtest
start: 2024-10-01 00:00:00
end: 2024-10-31 23:59:59
period: 1h
basePeriod: 1h
exchanges: [{"eid":"Futures_Binance","currency":"BTC_USDT"}]
*/

//@version=5
strategy("Swing Trading with EMA Alignment and Custom Momentum", overlay=true)

// User inputs for customization
atrLength = input.int(14, title="ATR Length", minval=1)
atrMultiplierSL = input.float(1.5, title="Stop-Loss Multiplier (ATR)", minval=0.1)   // Stop-loss at 1.5x ATR
atrMultiplierTP = input.float(3.0, title="Take-Profit Multiplier (ATR)", minval=0.1)   // Take-profit at 3x ATR
pullbackRangePercent = input.float(1.0, title="Pullback Range (%)", minval=0.1) // 1% range for pullback around 20 EMA
lengthKC = input.int(20, title="Length for Keltner Channels (Momentum Calculation)", minval=1)

// EMA settings
ema20 = ta.ema(close, 20)
ema50 = ta.ema(close, 50)
ema100 = ta.ema(close, 100)
ema200 = ta.ema(close, 200)

// ATR calculation
atrValue = ta.atr(atrLength)

// Custom Momentum Calculation based on Linear Regression for Daily Timeframe
highestHighKC = ta.highest(high, lengthKC)
lowestLowKC = ta.lowest(low, lengthKC)
smaCloseKC = ta.sma(close, lengthKC)

// Manually calculate the average of highest high and lowest low
averageKC = (highestHighKC + lowestLowKC) / 2

// Calculate daily momentum using linear regression
dailyMomentum = ta.linreg(close - (averageKC + smaCloseKC) / 2, lengthKC, 0) // Custom daily momentum calculation

// Fetch weekly data for momentum calculation using request.security()
[weeklyHigh, weeklyLow, weeklyClose] = request.security(syminfo.tickerid, "W", [high, low, close])

// Calculate weekly momentum using linear regression on weekly timeframe
weeklyHighestHighKC = ta.highest(weeklyHigh, lengthKC)
weeklyLowestLowKC = ta.lowest(weeklyLow, lengthKC)
weeklySmaCloseKC = ta.sma(weeklyClose, lengthKC)
weeklyAverageKC = (weeklyHighestHighKC + weeklyLowestLowKC) / 2

weeklyMomentum = ta.linreg(weeklyClose - (weeklyAverageKC + weeklySmaCloseKC) / 2, lengthKC, 0) // Custom weekly momentum calculation

// EMA alignment condition (20 EMA > 50 EMA > 100 EMA > 200 EMA)
emaAligned = ema20 > ema50 and ema50 > ema100 and ema100 > ema200

// Momentum increasing condition (daily and weekly momentum is positive and increasing)
dailyMomentumIncreasing = dailyMomentum > 0 and dailyMomentum > dailyMomentum[1] //and dailyMomentum[1] > dailyMomentum[2]
weeklyMomentumIncreasing = weeklyMomentum > 0 and weeklyMomentum > weeklyMomentum[1] //and weeklyMomentum[1] > weeklyMomentum[2]

// Redefine Pullback condition: price within 1% range of the 20 EMA
upperPullbackRange = ema20 * (1 + pullbackRangePercent / 100)
lowerPullbackRange = ema20 * (1 - pullbackRangePercent / 100)
pullbackToEma20 = (close <= upperPullbackRange) and (close >= lowerPullbackRange)

// Entry condition: EMA alignment and momentum increasing on both daily and weekly timeframes
longCondition = emaAligned and dailyMomentumIncreasing and weeklyMomentumIncreasing and pullbackToEma20

// Initialize stop loss and take profit levels as float variables
var float longStopLevel = na
var float longTakeProfitLevel = na

// Calculate stop loss and take profit levels based on ATR
if (longCondition)
    longStopLevel := close - (atrMultiplierSL * atrValue)  // Stop loss at 1.5x ATR below the entry price
    longTakeProfitLevel := close + (atrMultiplierTP * atrValue) // Take profit at 3x ATR above the entry price

// Strategy execution
if (longCondition)
    strategy.entry("Long", strategy.long)

// Exit conditions: Stop-loss at 1.5x ATR and take-profit at 3x ATR
if (strategy.position_size > 0)
    strategy.exit("Take Profit/Stop Loss", "Long", stop=longStopLevel, limit=longTakeProfitLevel)
Detail
https://www.fmz.com/strategy/471719
Last Modified
2024-11-12 16:35:41