
7.4 KiB
Name
多周期均线趋势判断与RSI超买策略-Multi-Period-EMA-Trend-Detection-with-RSI-Overbought-Strategy
Author
ChaoZhang
Strategy Description
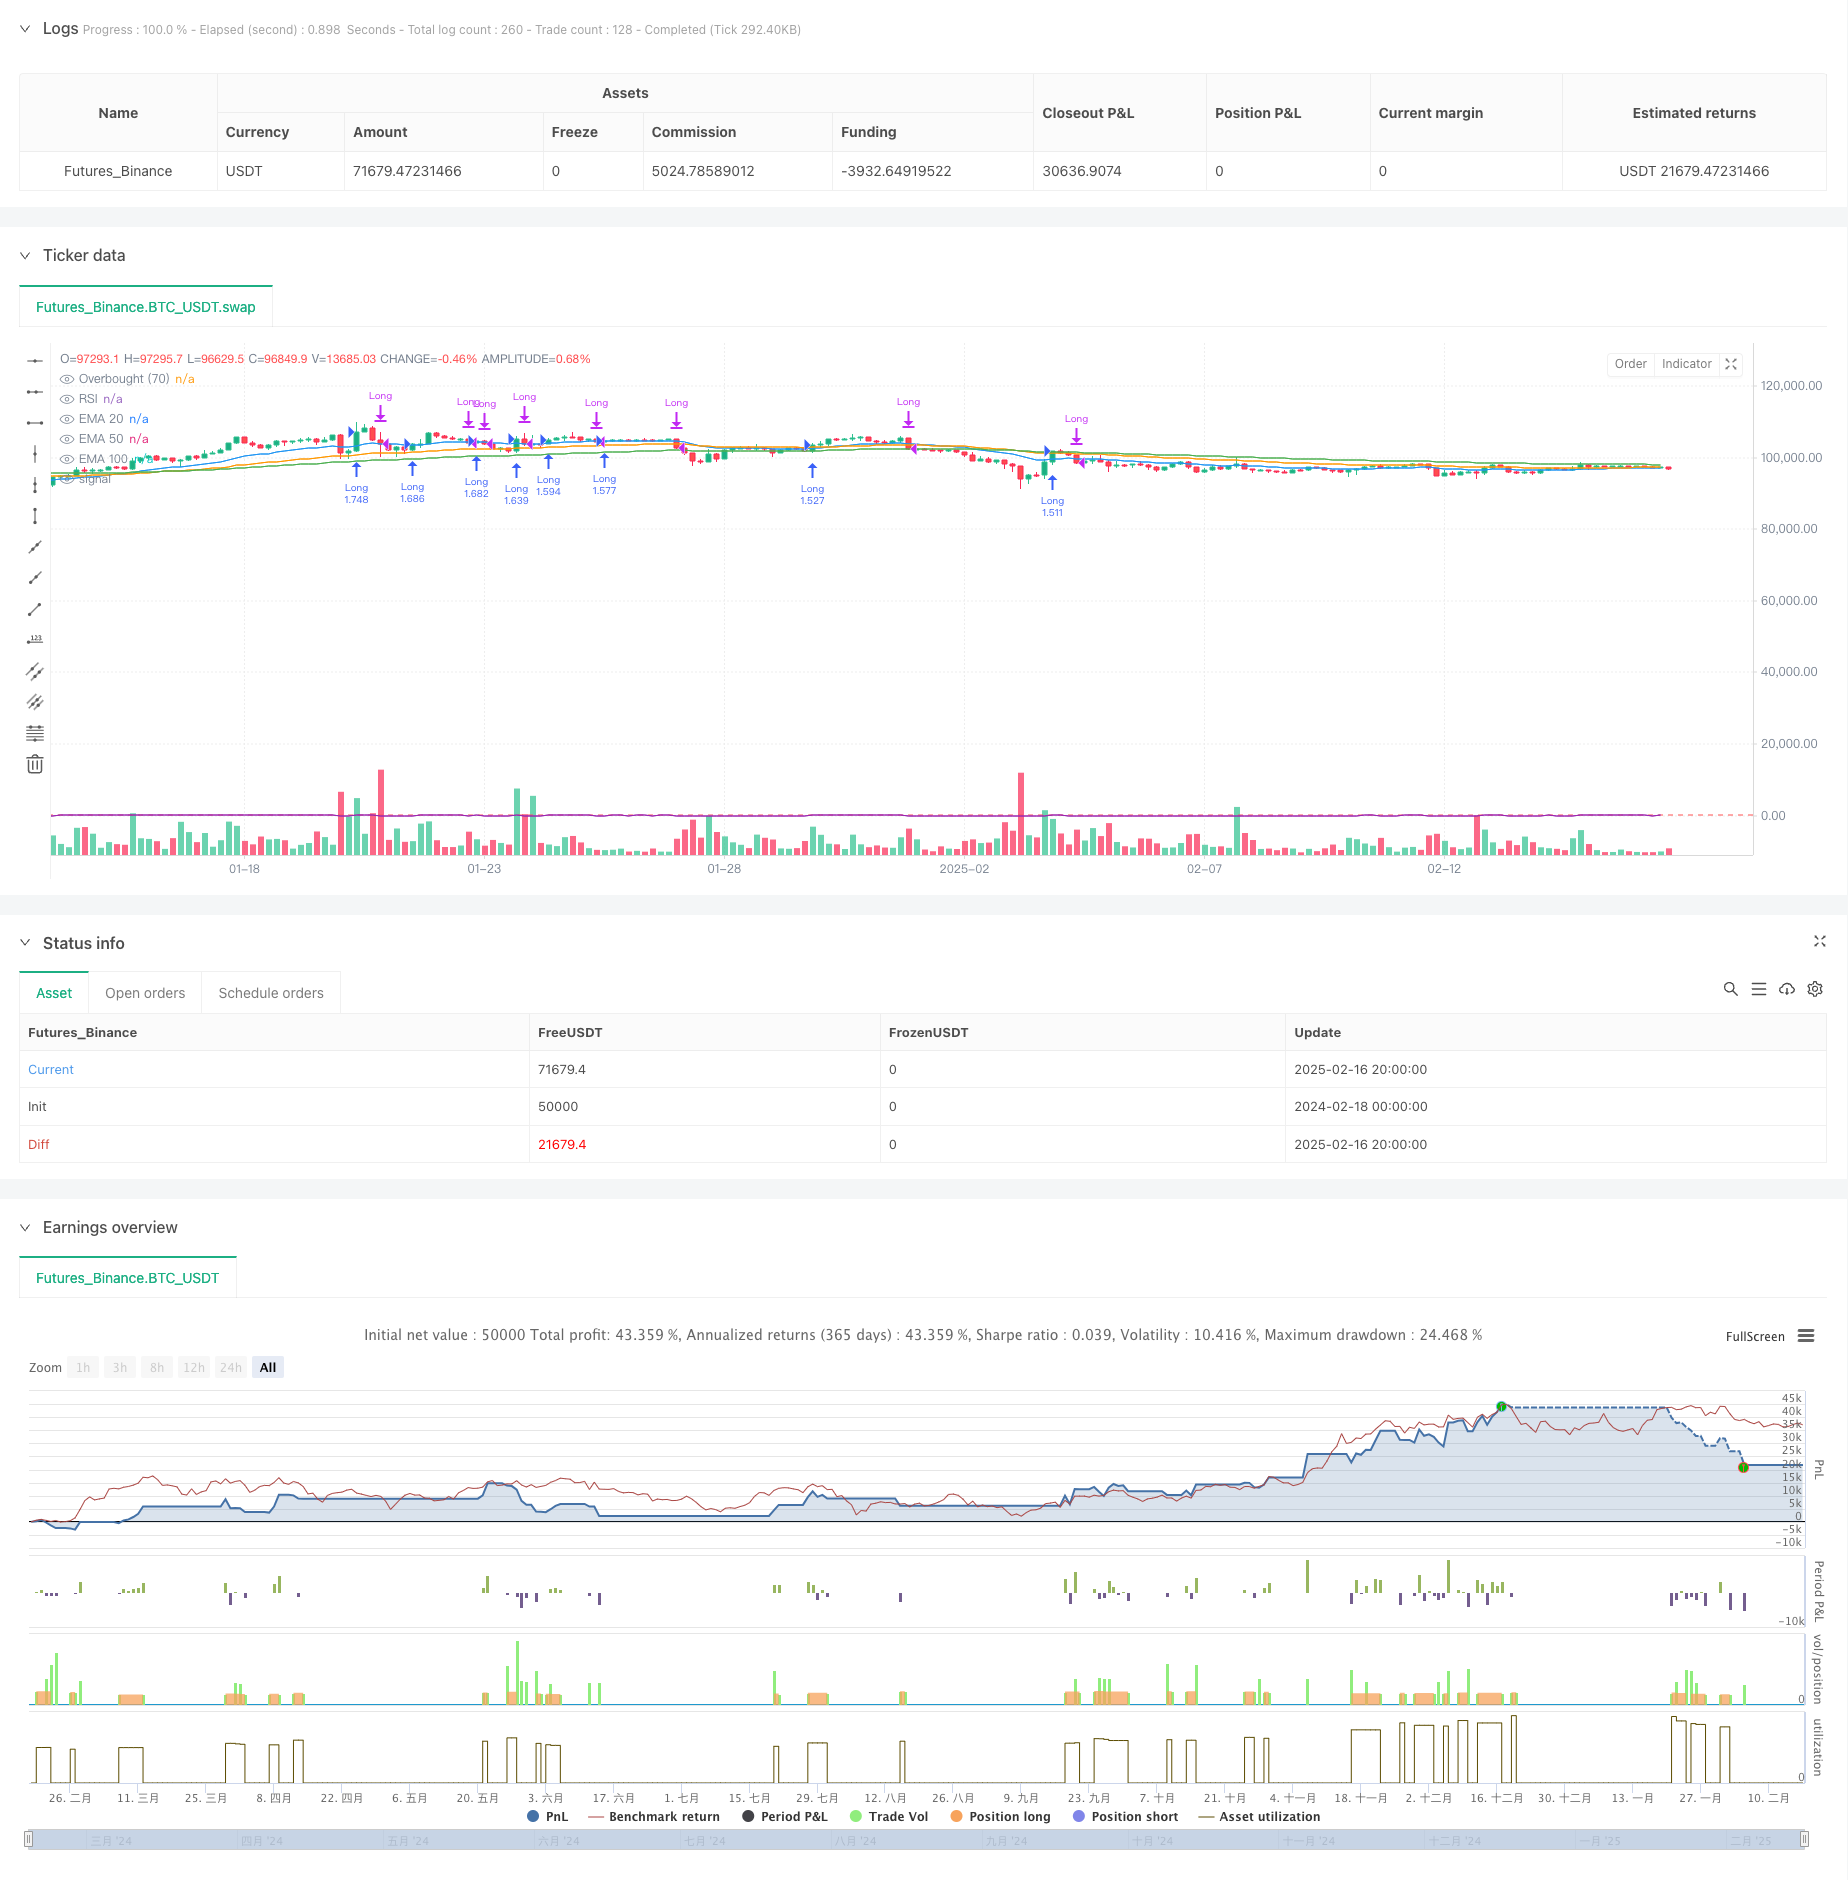
[trans]
概述
该策略是一个基于多周期指数移动平均线(EMA)和相对强弱指标(RSI)的趋势跟踪交易系统。策略通过判断20、50、100三个周期的EMA趋势,结合价格突破和RSI超买信号来进行交易决策。该策略主要适用于trending market(趋势市场),通过多重技术指标的验证来提高交易的准确性。
策略原理
策略的核心逻辑包含以下几个关键部分:
- 趋势判断: 通过对比当前与前一周期的EMA值来判断三个周期(20/50/100)的均线是否都处于上升趋势
- 入场条件: 当价格从下方突破20周期EMA,且三条均线都处于上升趋势时发出买入信号
- 出场条件: 当RSI超过70(超买)或价格跌破20周期EMA时平仓
- 仓位管理: 采用账户总值的百分比(10%)进行持仓
策略优势
- 多重确认机制: 通过三个不同周期的EMA和RSI指标相互验证,降低假突破的风险
- 趋势跟踪: 能够有效捕捉中长期趋势,提高盈利能力
- 风险控制: 使用RSI超买信号和均线跌破作为止损条件,有效控制回撤
- 资金管理: 采用百分比仓位管理,可以根据账户规模自动调整交易量
- 系统化操作: 策略规则明确,可以减少主观判断带来的干扰
策略风险
- 滞后性: EMA作为滞后指标可能导致入场和出场时机略有延迟
- 震荡市场风险: 在横盘震荡市场中可能产生频繁的假信号
- 跳空风险: 市场大幅跳空可能导致止损点位失效
- 参数敏感性: 不同市场环境下可能需要调整EMA周期和RSI阈值
- 交易成本: 频繁交易可能带来较高的交易成本
策略优化方向
- 市场环境识别: 增加市场状态判断机制,在震荡市场下自动降低仓位或暂停交易
- 动态参数优化: 根据市场波动率自动调整EMA周期和RSI阈值
- 止损优化: 引入跟踪止损机制,更好地保护盈利
- 入场优化: 增加成交量确认机制,提高突破信号的可靠性
- 仓位管理优化: 根据趋势强度和市场波动率动态调整持仓比例
总结
这是一个结合了趋势跟踪和动量反转的复合策略系统。通过多重技术指标的配合使用,在保持策略简单易懂的同时,实现了较好的风险收益特征。策略的核心优势在于其严格的趋势确认机制和完善的风险控制体系,但在实际应用中需要注意参数优化和市场环境的适应性。通过建议的优化方向,策略还有进一步提升的空间。 ||
Overview
This strategy is a trend-following trading system based on multiple-period Exponential Moving Averages (EMA) and the Relative Strength Index (RSI). It makes trading decisions by analyzing the trends of 20, 50, and 100-period EMAs, combined with price breakouts and RSI overbought signals. The strategy is primarily designed for trending markets, using multiple technical indicators to enhance trading accuracy.
Strategy Principles
The core logic includes the following key components:
- Trend Detection: Comparing current and previous EMA values to determine if all three periods (20/50/100) are in upward trends
- Entry Conditions: Generates a buy signal when price crosses above the 20-period EMA and all EMAs are trending upward
- Exit Conditions: Closes positions when RSI exceeds 70 (overbought) or price falls below the 20-period EMA
- Position Management: Uses a percentage (10%) of account equity for position sizing
Strategy Advantages
- Multiple Confirmation Mechanism: Reduces false breakout risks through validation of three different EMA periods and RSI
- Trend Following: Effectively captures medium to long-term trends, enhancing profit potential
- Risk Control: Uses RSI overbought signals and EMA crossunders as stop-loss conditions
- Money Management: Implements percentage-based position sizing that scales with account size
- Systematic Operation: Clear rules minimize subjective judgment interference
Strategy Risks
- Lag Effect: EMAs as lagging indicators may cause delayed entries and exits
- Sideways Market Risk: May generate frequent false signals in ranging markets
- Gap Risk: Large market gaps may render stop-loss levels ineffective
- Parameter Sensitivity: EMA periods and RSI thresholds may need adjustment in different market conditions
- Transaction Costs: Frequent trading may incur significant costs
Strategy Optimization Directions
- Market Environment Recognition: Add market state identification to reduce position size or pause trading in ranging markets
- Dynamic Parameter Optimization: Automatically adjust EMA periods and RSI thresholds based on market volatility
- Stop-Loss Enhancement: Implement trailing stop-loss mechanisms to better protect profits
- Entry Refinement: Add volume confirmation to improve breakout signal reliability
- Position Sizing Enhancement: Dynamically adjust position size based on trend strength and market volatility
Summary
This is a composite strategy system combining trend following and momentum reversal. Through the coordinated use of multiple technical indicators, it achieves a favorable risk-reward profile while maintaining simplicity. The strategy's core strengths lie in its strict trend confirmation mechanism and comprehensive risk control system, though practical application requires attention to parameter optimization and market environment adaptability. Through the suggested optimization directions, there is room for further strategy enhancement.[/trans]
Source (PineScript)
/*backtest
start: 2024-02-18 00:00:00
end: 2025-02-17 00:00:00
period: 4h
basePeriod: 4h
exchanges: [{"eid":"Futures_Binance","currency":"BTC_USDT"}]
*/

//@version=5
strategy("EMA Crossover + RSI Strategy", overlay=true, initial_capital=10000, default_qty_type=strategy.percent_of_equity, default_qty_value=200)

// Calculate EMAs
ema20  = ta.ema(close, 20)
ema50  = ta.ema(close, 50)
ema100 = ta.ema(close, 100)

// Calculate RSI
rsiPeriod = 14
rsiValue  = ta.rsi(close, rsiPeriod)

// Determine if each EMA is trending up (current value greater than the previous value)
ema20_trending_up  = ema20  > ema20[1]
ema50_trending_up  = ema50  > ema50[1]
ema100_trending_up = ema100 > ema100[1]
all_emas_trending_up = ema20_trending_up and ema50_trending_up and ema100_trending_up

// Buy condition:
// 1. Price crosses above the EMA20 from below (using ta.crossover)
// 2. All three EMAs are trending upward
buySignal = ta.crossover(close, ema20) and all_emas_trending_up

// Sell conditions:
// Sell if RSI is above 70 OR price crosses below the EMA20 from above (using ta.crossunder)
sellSignal = (rsiValue > 70) or ta.crossunder(close, ema20)

// Enter a long position if the buy condition is met
if (buySignal)
    strategy.entry("Long", strategy.long)

// Exit the long position if either sell condition is met
if (sellSignal)
    strategy.close("Long")

// Plot the EMAs on the chart for visualization
plot(ema20, color=color.blue, title="EMA 20")
plot(ema50, color=color.orange, title="EMA 50")
plot(ema100, color=color.green, title="EMA 100")

// (Optional) Plot the RSI and a horizontal line at 70 for reference
plot(rsiValue, title="RSI", color=color.purple)
hline(70, title="Overbought (70)", color=color.red)
Detail
https://www.fmz.com/strategy/482502
Last Modified
2025-02-18 17:50:40