
9.5 KiB
Name
多周期均线带及MACD交叉策略系统-Multi-Period-Moving-Average-Ribbon-and-MACD-Crossover-Strategy-System
Author
ianzeng123
Strategy Description
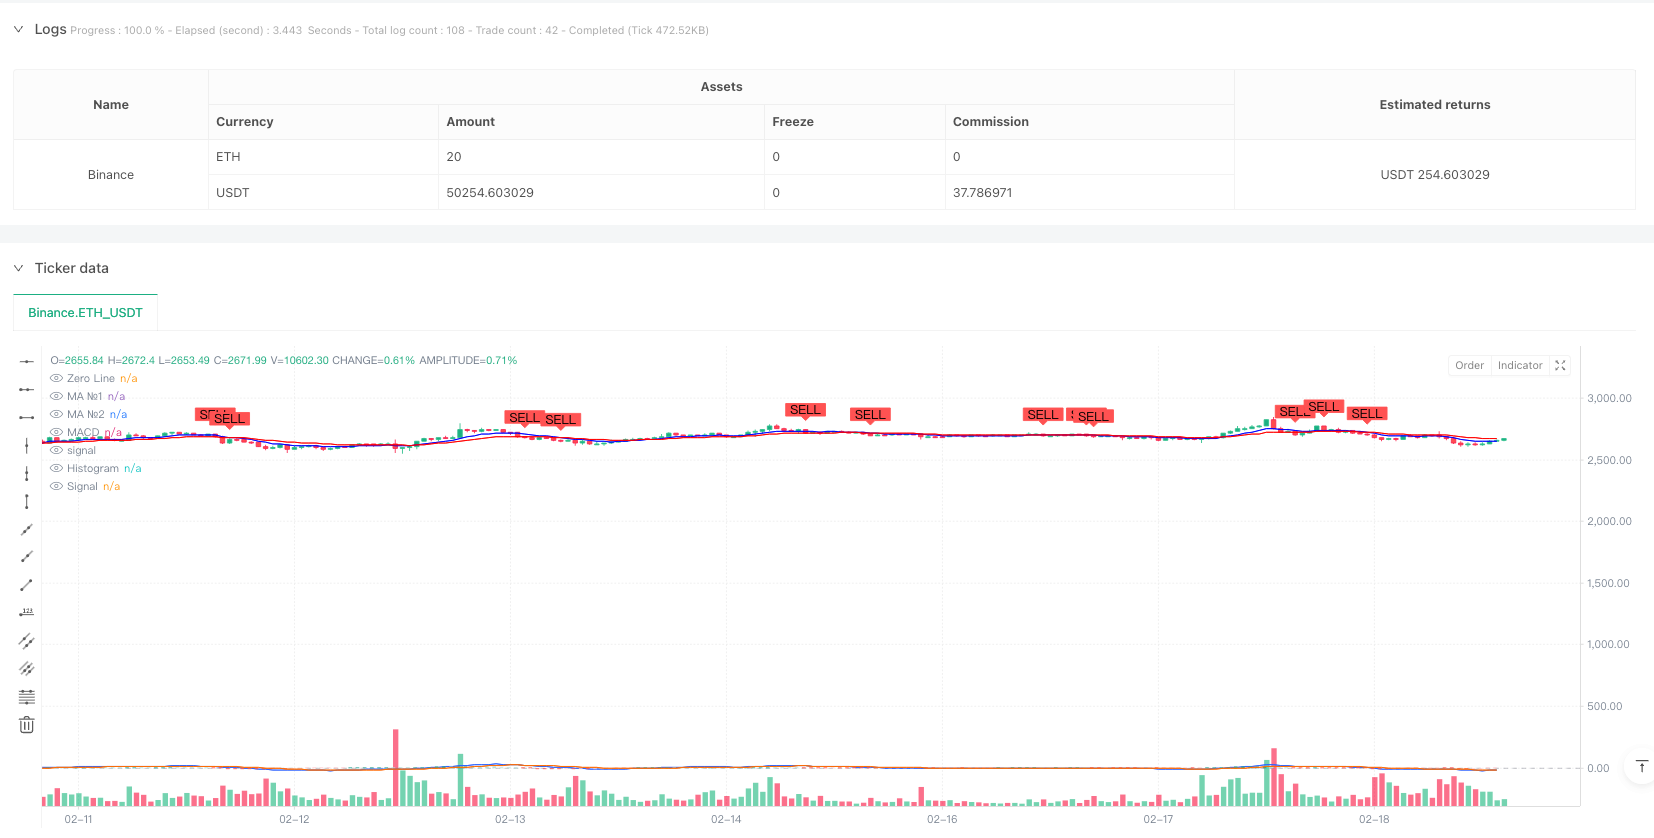
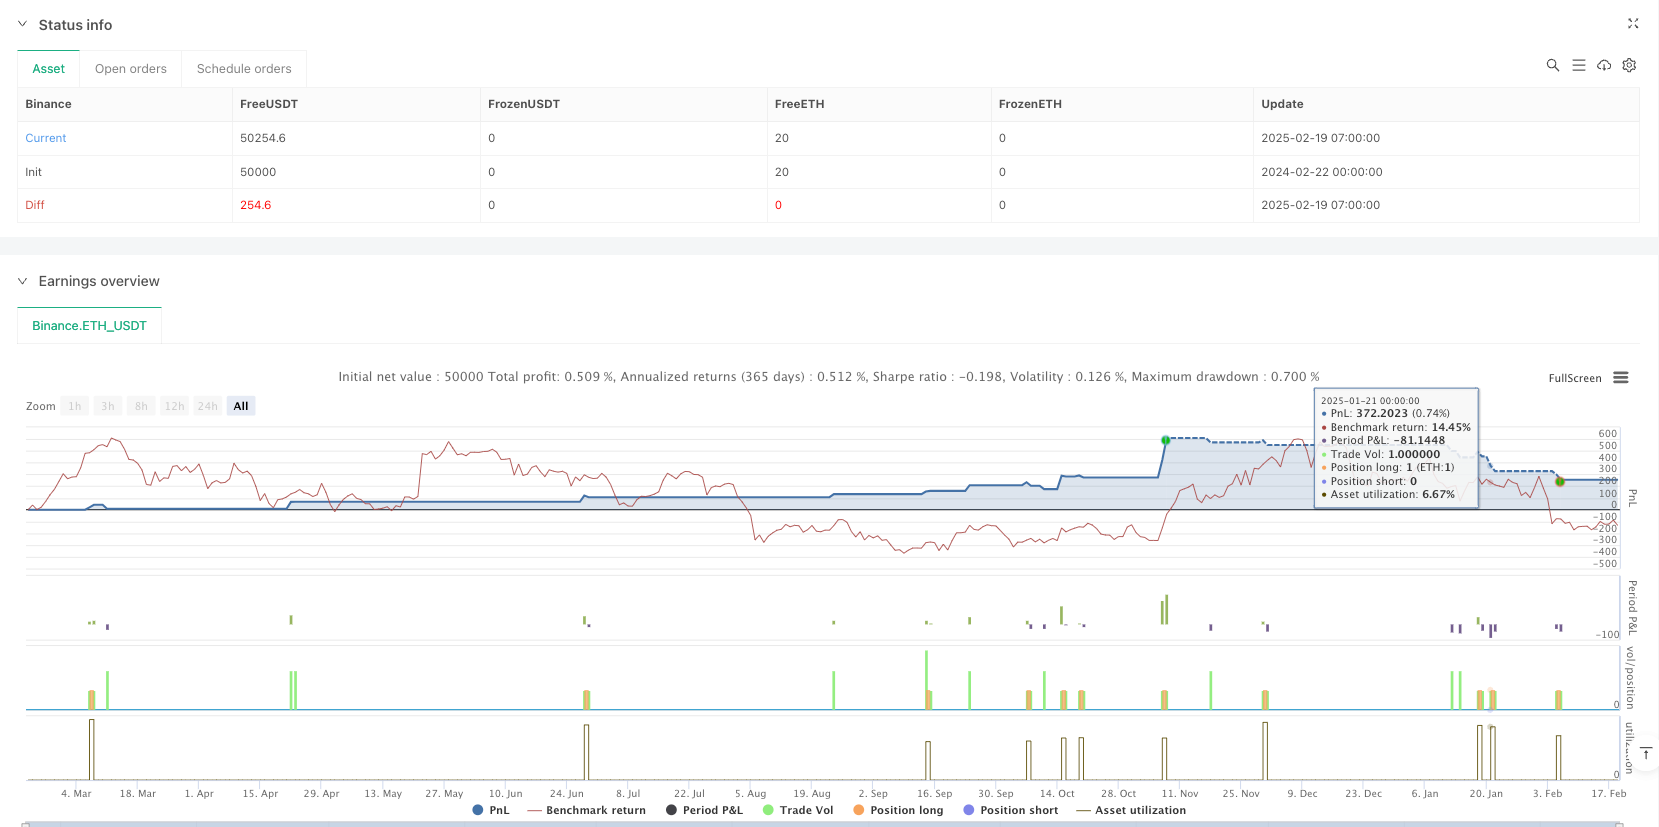
[trans]
概述
本策略是一个结合了多周期移动平均线带和MACD指标的交易系统。策略主要通过短期和长期移动平均线的交叉以及MACD指标的信号来确定市场趋势和交易时机。该策略集成了日内交易重置逻辑,可以有效防止隔夜风险。
策略原理
策略的核心逻辑包含三个主要部分:移动平均线带系统、MACD指标系统和日内交易重置机制。移动平均线带由两条不同周期(9和21)的均线构成,可以选择多种均线类型包括SMA、EMA、SMMA、WMA和VWMA。MACD系统采用标准的12/26/9参数设置,通过快线和慢线的差值以及信号线来判断趋势动量。买入信号需要同时满足短期均线上穿长期均线和MACD线上穿信号线两个条件,而卖出信号则在出现任一反向交叉时触发。每个交易日开始时会重置信号状态,确保交易的连续性和安全性。
策略优势
- 信号确认双重可靠:结合了趋势跟踪和动量指标,显著降低了假信号的风险
- 灵活的参数配置:支持多种类型的移动平均线,可以根据不同市场特征进行优化
- 风险控制完善:包含日内交易重置机制,有效规避了隔夜风险
- 可视化效果突出:集成了清晰的买卖信号标记和均线带显示,便于交易决策
策略风险
- 趋势转折滞后:由于使用均线系统,在市场快速转向时可能反应较慢
- 震荡市不适用:在横盘震荡市场中可能产生频繁的假信号
- 参数优化难度:不同市场环境下最优参数可能存在显著差异
- 执行延迟影响:在高波动市场中,信号确认到实际执行可能存在较大价格差异
策略优化方向
- 引入波动率过滤:建议添加ATR或波动率指标,在高波动环境下调整信号触发阈值
- 优化信号确认机制:可以考虑增加成交量确认或价格形态确认,提高信号可靠性
- 完善风险管理:建议加入动态止损和利润目标,提高策略的风险收益比
- 市场环境适应:可以根据不同的市场状态动态调整参数,提高策略适应性
总结
该策略通过结合均线带和MACD指标,构建了一个较为完善的交易系统。虽然存在一定的滞后性风险,但通过合理的参数优化和风险管理,策略可以在趋势市场中取得不错的效果。建议交易者在实盘使用前进行充分的回测,并根据具体市场特征调整参数设置。 ||
Overview
This strategy is a trading system that combines multi-period moving average ribbons with the MACD indicator. The strategy primarily determines market trends and trading opportunities through the crossover of short-term and long-term moving averages along with MACD signals. It incorporates daily trading reset logic to effectively prevent overnight risks.
Strategy Principles
The core logic consists of three main components: the moving average ribbon system, MACD indicator system, and intraday trading reset mechanism. The moving average ribbon comprises two different period lines (9 and 21), with options for various types including SMA, EMA, SMMA, WMA, and VWMA. The MACD system uses standard 12/26/9 parameters, utilizing the difference between fast and slow lines along with a signal line to judge trend momentum. Buy signals require both the short-term MA crossing above the long-term MA and the MACD line crossing above the signal line, while sell signals trigger upon either reverse crossing. Signal states reset at the start of each trading day, ensuring trading continuity and safety.
Strategy Advantages
- Dual signal confirmation reliability: Combines trend following and momentum indicators, significantly reducing false signal risks
- Flexible parameter configuration: Supports multiple types of moving averages, allowing optimization for different market characteristics
- Comprehensive risk control: Includes intraday trading reset mechanism, effectively avoiding overnight risks
- Outstanding visualization: Integrates clear buy/sell signal markers and ribbon display, facilitating trading decisions
Strategy Risks
- Trend reversal lag: Due to the use of moving averages, response might be slow during rapid market turns
- Ineffective in ranging markets: May generate frequent false signals in sideways, volatile markets
- Parameter optimization challenges: Optimal parameters may vary significantly across different market environments
- Execution delay impact: Significant price differences may occur between signal confirmation and actual execution in highly volatile markets
Strategy Optimization Directions
- Introduce volatility filtering: Recommend adding ATR or volatility indicators to adjust signal trigger thresholds in high volatility environments
- Optimize signal confirmation mechanism: Consider adding volume confirmation or price pattern confirmation to improve signal reliability
- Enhance risk management: Suggest incorporating dynamic stop-loss and profit targets to improve the strategy's risk-reward ratio
- Market environment adaptation: Consider dynamic parameter adjustment based on different market states to improve strategy adaptability
Summary
This strategy constructs a relatively comprehensive trading system by combining moving average ribbons and MACD indicators. While there are certain lag risks, the strategy can achieve good results in trending markets through proper parameter optimization and risk management. Traders are advised to conduct thorough backtesting before live implementation and adjust parameters according to specific market characteristics.[/trans]
Source (PineScript)
/*backtest
start: 2024-02-22 00:00:00
end: 2025-02-19 08:00:00
period: 1h
basePeriod: 1h
exchanges: [{"eid":"Binance","currency":"ETH_USDT"}]
*/

//@version=6
strategy("Daily MA Ribbon + MACD Crossover with Buy/Sell Signals", overlay=true)

// === Daily Reset Logic ===
var bool newDay = false  // Initialize newDay as a boolean variable
newDay := bool(ta.change(time("D")))  // Cast the result of ta.change to boolean

// === Moving Average Ribbon ===
ma(source, length, type) =>
    type == "SMA" ? ta.sma(source, length) :
     type == "EMA" ? ta.ema(source, length) :
     type == "SMMA (RMA)" ? ta.rma(source, length) :
     type == "WMA" ? ta.wma(source, length) :
     type == "VWMA" ? ta.vwma(source, length) :
     na

// MA1 (Short-term MA)
show_ma1   = input(true, "MA №1", inline="MA #1")
ma1_type   = input.string("EMA", "", inline="MA #1", options=["SMA", "EMA", "SMMA (RMA)", "WMA", "VWMA"])
ma1_source = input(close, "", inline="MA #1")
ma1_length = input.int(9, "", inline="MA #1", minval=1)  // Short-term MA (e.g., 9-period)
ma1_color  = input(color.blue, "", inline="MA #1")
ma1 = ma(ma1_source, ma1_length, ma1_type)
plot(show_ma1 ? ma1 : na, color = ma1_color, title="MA №1")

// MA2 (Long-term MA)
show_ma2   = input(true, "MA №2", inline="MA #2")
ma2_type   = input.string("EMA", "", inline="MA #2", options=["SMA", "EMA", "SMMA (RMA)", "WMA", "VWMA"])
ma2_source = input(close, "", inline="MA #2")
ma2_length = input.int(21, "", inline="MA #2", minval=1)  // Long-term MA (e.g., 21-period)
ma2_color  = input(color.red, "", inline="MA #2")
ma2 = ma(ma2_source, ma2_length, ma2_type)
plot(show_ma2 ? ma2 : na, color = ma2_color, title="MA №2")

// === MACD ===
fast_length = input(12, "Fast Length")
slow_length = input(26, "Slow Length")
signal_length = input.int(9, "Signal Smoothing", minval=1, maxval=50)
sma_source = input.string("EMA", "Oscillator MA Type", options=["SMA", "EMA"])
sma_signal = input.string("EMA", "Signal Line MA Type", options=["SMA", "EMA"])

// Calculate MACD
fast_ma = sma_source == "SMA" ? ta.sma(close, fast_length) : ta.ema(close, fast_length)
slow_ma = sma_source == "SMA" ? ta.sma(close, slow_length) : ta.ema(close, slow_length)
macd = fast_ma - slow_ma
signal = sma_signal == "SMA" ? ta.sma(macd, signal_length) : ta.ema(macd, signal_length)
hist = macd - signal

// Plot MACD
hline(0, "Zero Line", color = color.new(#787B86, 50))
plot(hist, title = "Histogram", style = plot.style_columns, color = (hist >= 0 ? (hist[1] < hist ? #26A69A : #B2DFDB) : (hist[1] < hist ? #FFCDD2 : #FF5252)))
plot(macd, title = "MACD", color = #2962FF)
plot(signal, title = "Signal", color = #FF6D00)

// === Buy/Sell Signal Logic ===
// Condition 1: MA1 (Short-term) crosses above MA2 (Long-term)
ma_crossover = ta.crossover(ma1, ma2)

// Condition 2: MACD line crosses above Signal line
macd_crossover = ta.crossover(macd, signal)

// Buy Signal: Both conditions must be true
buy_signal = ma_crossover and macd_crossover

// Sell Signal: MA1 crosses below MA2 or MACD crosses below Signal
sell_signal = ta.crossunder(ma1, ma2) or ta.crossunder(macd, signal)

// Reset signals at the start of each new day
if (newDay)
    buy_signal := false
    sell_signal := false

// Plot Buy/Sell Signals
plotshape(buy_signal, title="Buy Signal", location=location.belowbar, color=color.green, style=shape.labelup, text="BUY")
plotshape(sell_signal, title="Sell Signal", location=location.abovebar, color=color.red, style=shape.labeldown, text="SELL")

// Strategy Entry/Exit
if (buy_signal)
    strategy.entry("Buy", strategy.long)

if (sell_signal)
    strategy.close("Buy", comment="Sell")
Detail
https://www.fmz.com/strategy/483047
Last Modified
2025-02-21 10:51:25