
18 KiB
Name
多周期唐奇安通道与ATR动态间隔波动跟踪交易策略-Multi-Timeframe-Donchian-Channel-and-ATR-Dynamic-Interval-Volatility-Following-Trading-Strategy
Author
ianzeng123
Strategy Description
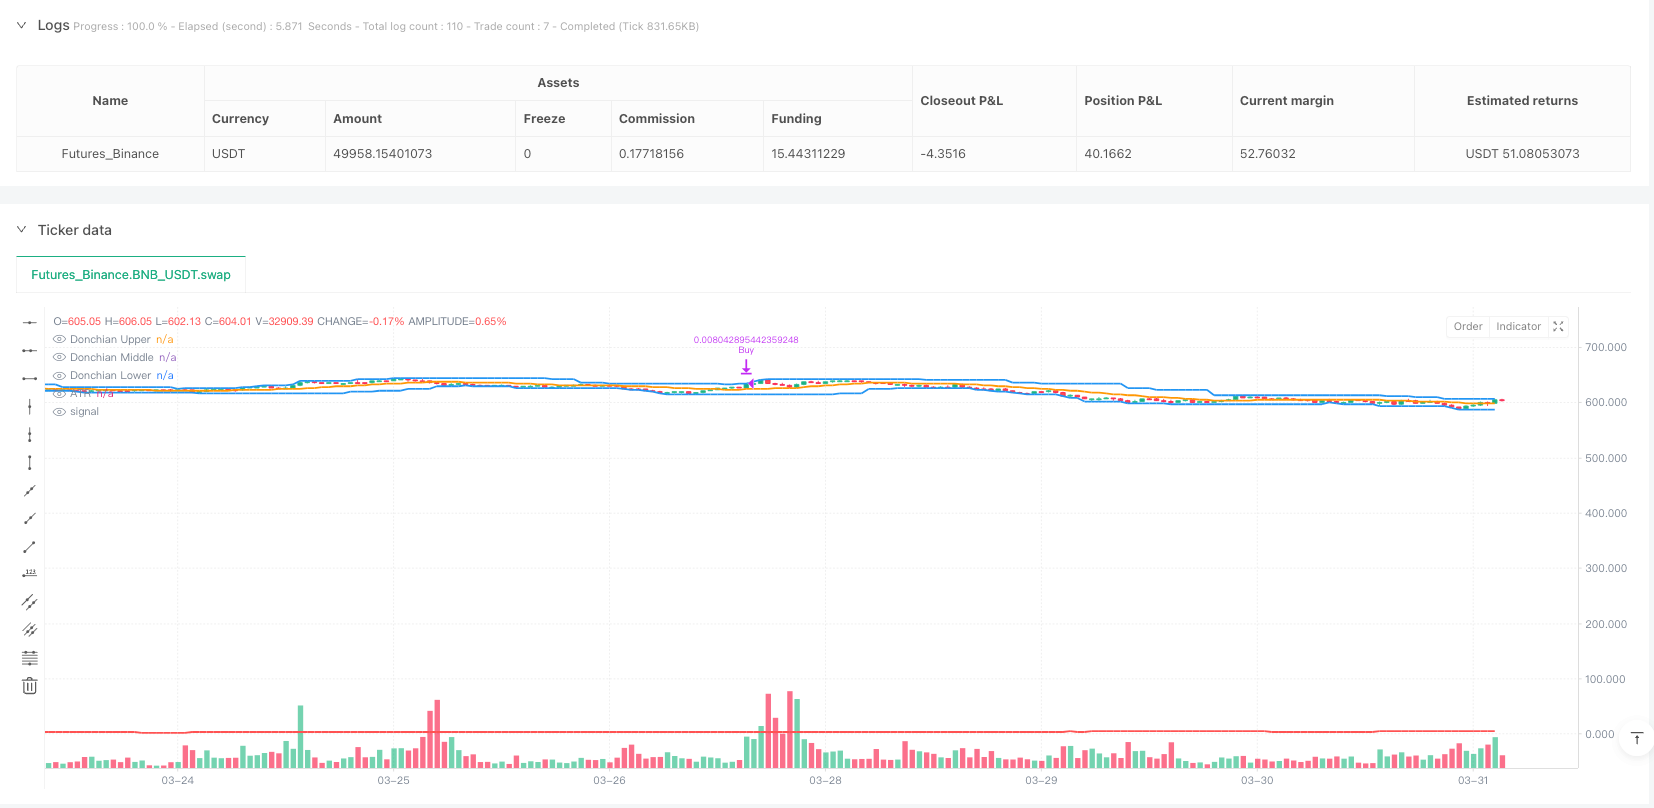
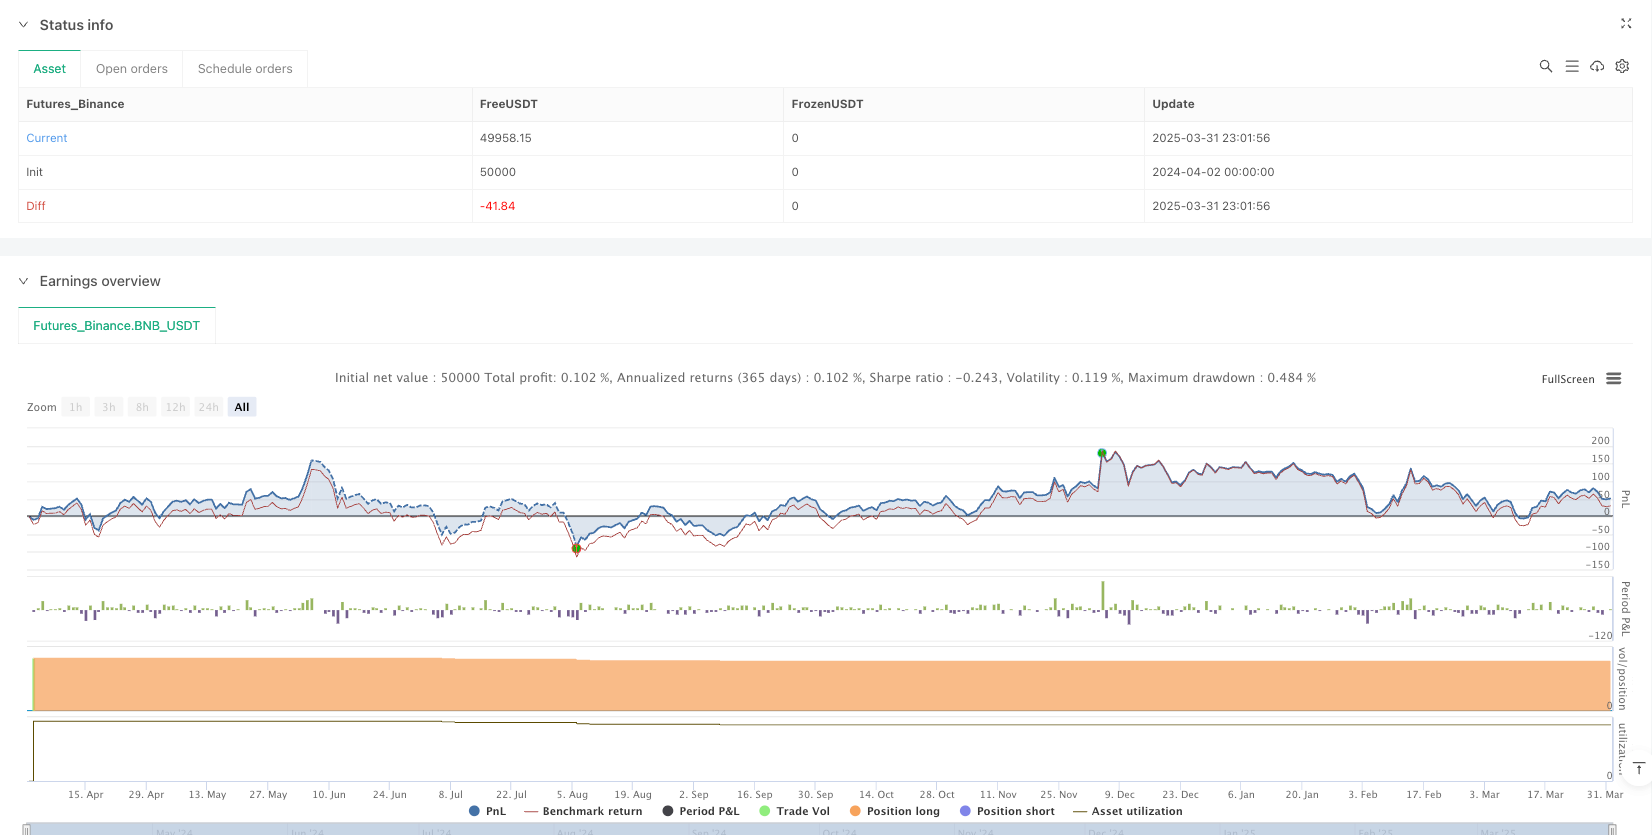
[trans]
策略概述
该策略是一种基于唐奇安通道(Donchian Channel)和平均真实波幅(ATR)的趋势跟踪交易系统。策略利用4小时K线周期的唐奇安通道中轨与当前价格的偏离程度,结合ATR作为动态波动衡量指标,在市场波动中寻找入场和出场机会。该策略采用梯度加仓和止损机制,通过固定交易金额(5.1 USDT)的方式进行仓位管理,实现在大波动行情中的有效资金利用。
策略原理
策略核心逻辑基于以下几个关键要素:
- 多周期分析框架:策略在1分钟K线上执行交易,但使用4小时K线(240分钟)的数据计算技术指标,实现多周期分析的优势。
- 唐奇安通道计算:基于20周期的4小时K线数据,计算上轨(最高价)、下轨(最低价)和中轨(收盘价的简单移动平均)。
- 动态间隔确定:使用ATR值的2倍作为动态交易间隔,使策略能够自适应市场波动性变化。
- 交易执行逻辑:
- 初始状态(无持仓):当唐奇安通道中轨减去当前价格大于设定间隔时,执行首次买入。
- 持仓状态:当基准价格与当前价格的差值超过间隔时,进行加仓或减仓操作。
- 仓位管理:每次交易固定金额(5.1 USDT),根据当前价格计算交易数量。
- 平仓机制:当价格上涨超过间隔时执行卖出,若仓位不足则卖出全部可用仓位。
策略优势
- 多周期分析优势:通过在较短时间周期(1分钟K线)执行交易,但基于较长时间周期(4小时K线)的技术指标进行决策,减少了短期市场噪音的干扰,同时保持了对中长期趋势的跟踪能力。
- 动态适应市场波动:使用ATR作为波动度量标准,策略可以根据市场波动性的变化自动调整交易间隔,在高波动市场中设置更大的间隔,低波动市场中设置更小的间隔。
- 梯度建仓机制:当价格持续下跌时,策略会在每个间隔点位进行加仓,平均建仓成本,减小单次交易的风险敞口。
- 固定金额交易:每次交易使用固定金额而非固定数量,更符合风险管理原则,避免在高价位过度投入或低价位投入不足的问题。
- 完整的日志记录:策略实现了详细的交易日志记录和可视化标签,包括交易类型、价格、间隔、数量和总持仓量等信息,便于回测分析和策略优化。
策略风险
- 趋势反转风险:在强趋势反转时,策略可能无法及时识别市场转向,导致连续加仓后大幅亏损。解决方法:引入趋势确认指标或设置最大加仓次数限制。
- 资金耗尽风险:在持续单向行情中,固定金额的多次加仓可能导致资金使用过快或过度集中。解决方法:设置总资金使用比例限制或动态调整单次交易金额。
- 参数敏感性:ATR倍数(2倍)和唐奇安通道周期(20)的选择对策略表现有重大影响,参数设置不当可能导致信号过多或过少。解决方法:通过历史回测寻找最优参数组合,或实现参数自适应机制。
- 流动性风险:在低流动性市场中,市价单可能导致较大滑点,影响策略实际执行效果。解决方法:考虑使用限价单或添加流动性过滤条件。
- 佣金成本累积:策略可能频繁交易,产生大量交易成本(设置为0.1%),长期可能侵蚀利润。解决方法:优化交易频率或考虑使用更低佣金的交易所。
策略优化方向
- 增加市场环境过滤:结合波动率指标(如布林带宽度或ATR相对值)判断当前市场环境,在不同市场状态下调整策略参数或暂停交易。这样可以避免在低波动率或震荡市场中频繁交易产生的成本损失。
- 动态调整ATR倍数:可以基于历史波动率或市场趋势强度动态调整ATR倍数,在强趋势市场使用较小倍数以更紧密跟踪价格,在震荡市场使用较大倍数以减少误信号。
- 引入止损机制:设置最大损失限制或追踪止损,防止单次交易亏损过大。特别是在多次加仓后,应考虑设置综合止损水平以保护资金安全。
- 优化仓位管理:可考虑使用递减或递增的交易金额,而非固定金额,根据已建仓位大小或市场波动性动态调整每次交易的资金比例。
- 添加交易时间过滤:分析不同交易时段的表现,避开低效或高风险时段,如亚洲、欧洲、美洲交易时段的交叉时间或重大经济数据公布前后。
- 整合其他指标确认:可以结合RSI、MACD等指标作为辅助确认,提高交易信号的质量,减少误入场情况。
- 自适应唐奇安通道周期:根据市场状态动态调整唐奇安通道的计算周期,在高波动市场使用较短周期以提高反应速度,低波动市场使用较长周期以减少噪音。
总结
多周期唐奇安通道与ATR动态间隔波动跟踪交易策略是一种结合了技术分析和风险管理的量化交易系统。通过利用4小时周期数据在1分钟K线上执行决策,策略实现了对中期趋势的有效跟踪,同时利用ATR动态调整交易间隔以适应不同市场环境。固定金额交易和梯度建仓机制有助于风险控制和成本平均化。
该策略特别适合波动较大的市场环境,但需要注意趋势反转风险和资金管理问题。通过添加市场环境过滤、动态参数调整和止损机制等优化措施,可以进一步提高策略的稳健性和长期盈利能力。在实际应用中,建议进行充分回测,针对特定交易品种进行参数优化,并实施严格的风险控制措施以确保资金安全。 ||
Strategy Overview
This strategy is a trend-following trading system based on the Donchian Channel and Average True Range (ATR). It utilizes the deviation between the middle band of the Donchian Channel calculated on 4-hour candles and the current price, combined with ATR as a dynamic volatility measurement indicator, to identify entry and exit opportunities in market fluctuations. The strategy employs a gradient position building and stop-loss mechanism, managing positions through fixed trading amounts (5.1 USDT) to achieve effective capital utilization during high volatility market conditions.
Strategy Principles
The core logic of the strategy is based on the following key elements:
- Multi-timeframe Analysis Framework: The strategy executes trades on 1-minute candles but calculates technical indicators using 4-hour candle (240-minute) data, leveraging the advantages of multi-timeframe analysis.
- Donchian Channel Calculation: Based on 20 periods of 4-hour candle data, it calculates the upper band (highest price), lower band (lowest price), and middle band (simple moving average of closing prices).
- Dynamic Interval Determination: Uses twice the ATR value as a dynamic trading interval, allowing the strategy to self-adapt to changes in market volatility.
- Trade Execution Logic:
- Initial state (no position): Executes first purchase when the Donchian middle band minus the current price exceeds the set interval.
- Position state: Adds or reduces positions when the difference between the base price and current price exceeds the interval.
- Position management: Fixed amount (5.1 USDT) per trade, calculating the trading quantity based on the current price.
- Closing mechanism: Executes selling when the price rises above the interval; if the position is insufficient, sells all available positions.
Strategy Advantages
- Multi-timeframe Analysis Benefits: By executing trades on shorter timeframes (1-minute candles) but making decisions based on longer timeframe (4-hour candles) technical indicators, it reduces interference from short-term market noise while maintaining the ability to track medium to long-term trends.
- Dynamic Adaptation to Market Volatility: Using ATR as a volatility measure, the strategy can automatically adjust trading intervals according to changes in market volatility, setting larger intervals in high-volatility markets and smaller intervals in low-volatility markets.
- Gradient Position Building Mechanism: When prices continue to fall, the strategy adds positions at each interval point, averaging entry costs and reducing risk exposure from single trades.
- Fixed Amount Trading: Each trade uses a fixed amount rather than a fixed quantity, which better aligns with risk management principles, avoiding excessive investment at high price points or insufficient investment at low price points.
- Comprehensive Logging: The strategy implements detailed trade logging and visual labeling, including trade type, price, interval, quantity, and total position information, facilitating backtesting analysis and strategy optimization.
Strategy Risks
- Trend Reversal Risk: During strong trend reversals, the strategy may fail to identify market turns in a timely manner, leading to significant losses after consecutive position additions. Solution: Introduce trend confirmation indicators or set limits on maximum position additions.
- Capital Depletion Risk: In continuous one-way markets, multiple fixed-amount additions may lead to rapid or excessive capital concentration. Solution: Set total capital usage ratio limits or dynamically adjust single trade amounts.
- Parameter Sensitivity: The choice of ATR multiplier (2x) and Donchian Channel period (20) significantly impacts strategy performance; improper parameter settings may lead to excessive or insufficient signals. Solution: Find optimal parameter combinations through historical backtesting or implement parameter adaptive mechanisms.
- Liquidity Risk: In low-liquidity markets, market orders may result in significant slippage, affecting the actual execution of the strategy. Solution: Consider using limit orders or adding liquidity filtering conditions.
- Commission Cost Accumulation: The strategy may trade frequently, generating substantial transaction costs (set at 0.1%), potentially eroding profits over time. Solution: Optimize trading frequency or consider exchanges with lower commissions.
Strategy Optimization Directions
- Add Market Environment Filtering: Combine volatility indicators (such as Bollinger Band width or relative ATR values) to determine the current market environment and adjust strategy parameters or pause trading in different market states. This helps avoid cost losses from frequent trading in low-volatility or oscillating markets.
- Dynamic Adjustment of ATR Multiplier: Dynamically adjust the ATR multiplier based on historical volatility or market trend strength, using smaller multipliers in strong trend markets to track prices more closely and larger multipliers in oscillating markets to reduce false signals.
- Introduce Stop-Loss Mechanisms: Set maximum loss limits or trailing stops to prevent excessive losses on single trades. Especially after multiple position additions, consider setting comprehensive stop-loss levels to protect capital.
- Optimize Position Management: Consider using decreasing or increasing trade amounts rather than fixed amounts, dynamically adjusting the capital proportion of each trade based on the size of existing positions or market volatility.
- Add Trading Time Filters: Analyze performance across different trading sessions to avoid inefficient or high-risk periods, such as crossover times between Asian, European, and American trading sessions or before/after major economic data releases.
- Integrate Other Confirmation Indicators: Combine with indicators such as RSI, MACD for auxiliary confirmation to improve signal quality and reduce false entries.
- Adaptive Donchian Channel Period: Dynamically adjust the calculation period of the Donchian Channel based on market conditions, using shorter periods in high-volatility markets to improve response speed and longer periods in low-volatility markets to reduce noise.
Conclusion
The Multi-Timeframe Donchian Channel and ATR Dynamic Interval Volatility Following Trading Strategy is a quantitative trading system that combines technical analysis and risk management. By utilizing 4-hour period data to execute decisions on 1-minute candles, the strategy achieves effective tracking of medium-term trends while using ATR to dynamically adjust trading intervals to adapt to different market environments. Fixed amount trading and gradient position building mechanisms help with risk control and cost averaging.
This strategy is particularly suitable for high-volatility market environments but requires attention to trend reversal risks and capital management issues. Through optimization measures such as adding market environment filtering, dynamic parameter adjustments, and stop-loss mechanisms, the strategy's robustness and long-term profitability can be further improved. In practical applications, it is recommended to conduct thorough backtesting, optimize parameters for specific trading instruments, and implement strict risk control measures to ensure capital safety.[/trans]
Source (PineScript)
/*backtest
start: 2024-04-02 00:00:00
end: 2025-04-01 00:00:00
period: 1h
basePeriod: 1h
exchanges: [{"eid":"Futures_Binance","currency":"BNB_USDT"}]
*/

//@version=5
strategy("Donchian Channel and ATR Strategy", overlay=true, currency="USDT", commission_type=strategy.commission.percent, commission_value=0.1)

// 用pine编写策略,实时执行。
// 获得suiusdt合约的4小时K线,用4小时k线20周期,计算唐奇安通道 和ATR。
// 最新的 ATR * 2 为间隔。每次买卖金额都是5.1usdt,根据金额计算交易数量。

// 策略基于1分钟k线执行。
// 开始时,baseprice为空。
// 如果 唐奇安通道中轨 - 当前价格  > 间隔, 则市价买入5.1usdt,记录成交价格为 baseprice。
// 重新计算计算唐奇安通道 和ATR, 还是使用4小时K线的20个周期。

// baseprice不为空,
// 如果 baseprice - 当前价格  > 间隔, 则市价买入5.1usdt,记录成交价格为 baseprice;
// 如果 当前价格 - baseprice > 间隔, 则市价卖出5.1usdt,记录成交价格为 baseprice。
// 卖出时,判断仓位是否足够卖出,不够则卖出剩余的仓位。卖出后,如果没有仓位了,设置baseprice为空。

// 标签和日志记录:买还是卖(buy/sell),初次买入标记为initBuy,价格,间隔,买入的数量,买入后仓位的总数量。
// 用不同颜色区分买卖。


// 获取4小时K线数据
resolution_4h = "240"  // 4小时K线
high_4h = request.security(syminfo.tickerid, resolution_4h, high)
low_4h = request.security(syminfo.tickerid, resolution_4h, low)
close_4h = request.security(syminfo.tickerid, resolution_4h, close)

// 计算唐奇安通道和ATR(基于4小时K线)
length = 20
donchian_upper = ta.highest(high_4h, length)
donchian_lower = ta.lowest(low_4h, length)
donchian_middle = ta.sma(close_4h, length)
atr_value = ta.atr(length)  // 使用4小时K线计算ATR

// 设置交易参数
trade_amount = 5.1  // 每次交易金额(USDT)
var float baseprice = na  // 当前基准价格
var float total_position_qty = 0  // 总仓位数量

// 日志记录函数
log_trade(action, price, interval, qty, total_qty, color) =>
    log_text = str.format("{0} @ {1} | Interval: {2} | Qty: {3} | Total Qty: {4}",
                          action, str.tostring(price), str.tostring(interval),
                          str.tostring(qty), str.tostring(total_qty))


// 策略逻辑
interval = atr_value * 2  // 间隔 = ATR * 2
if (na(baseprice))
    if (donchian_middle - close > interval)  // 使用1分钟K线的close价格判断
        qty = trade_amount / close  // 计算交易数量
        strategy.entry("Buy", strategy.long, qty=qty)
        baseprice := close  // 更新基准价格
        total_position_qty += qty  // 更新总仓位数量
        log_trade("initBuy", baseprice, interval, qty, total_position_qty, color.green)  // 记录日志和标签

else
    if (baseprice - close > interval)  // 使用1分钟K线的close价格判断
        qty = trade_amount / close
        strategy.entry("Buy", strategy.long, qty=qty)
        baseprice := close
        total_position_qty += qty
        log_trade("Buy", baseprice, interval, qty, total_position_qty, color.blue)

    else if (close - baseprice > interval)
        if (total_position_qty > 0)
            qty = trade_amount / close
            if (total_position_qty >= qty)
                strategy.close("Buy", qty=qty)
                total_position_qty -= qty
                log_trade("Sell", baseprice, interval, qty, total_position_qty, color.red)
            else
                strategy.close("Buy")
                total_position_qty := 0
                log_trade("Sell (Full Position)", baseprice, interval, total_position_qty, 0, color.red)
        baseprice := na  // 清空基准价格

// 绘制唐奇安通道和ATR(基于4小时K线)
plot(donchian_upper, title="Donchian Upper", color=color.blue, linewidth=2)
plot(donchian_middle, title="Donchian Middle", color=color.orange, linewidth=2)
plot(donchian_lower, title="Donchian Lower", color=color.blue, linewidth=2)
plot(atr_value, title="ATR", color=color.red, linewidth=2)
Detail
https://www.fmz.com/strategy/489150
Last Modified
2025-04-02 11:05:13