
7.3 KiB
Name
多区间-MA100-价格回撤智能网格交易策略-Multi-Zone-MA100-Price-Retracement-Smart-Grid-Trading-Strategy
Author
ChaoZhang
Strategy Description
[trans]
概述
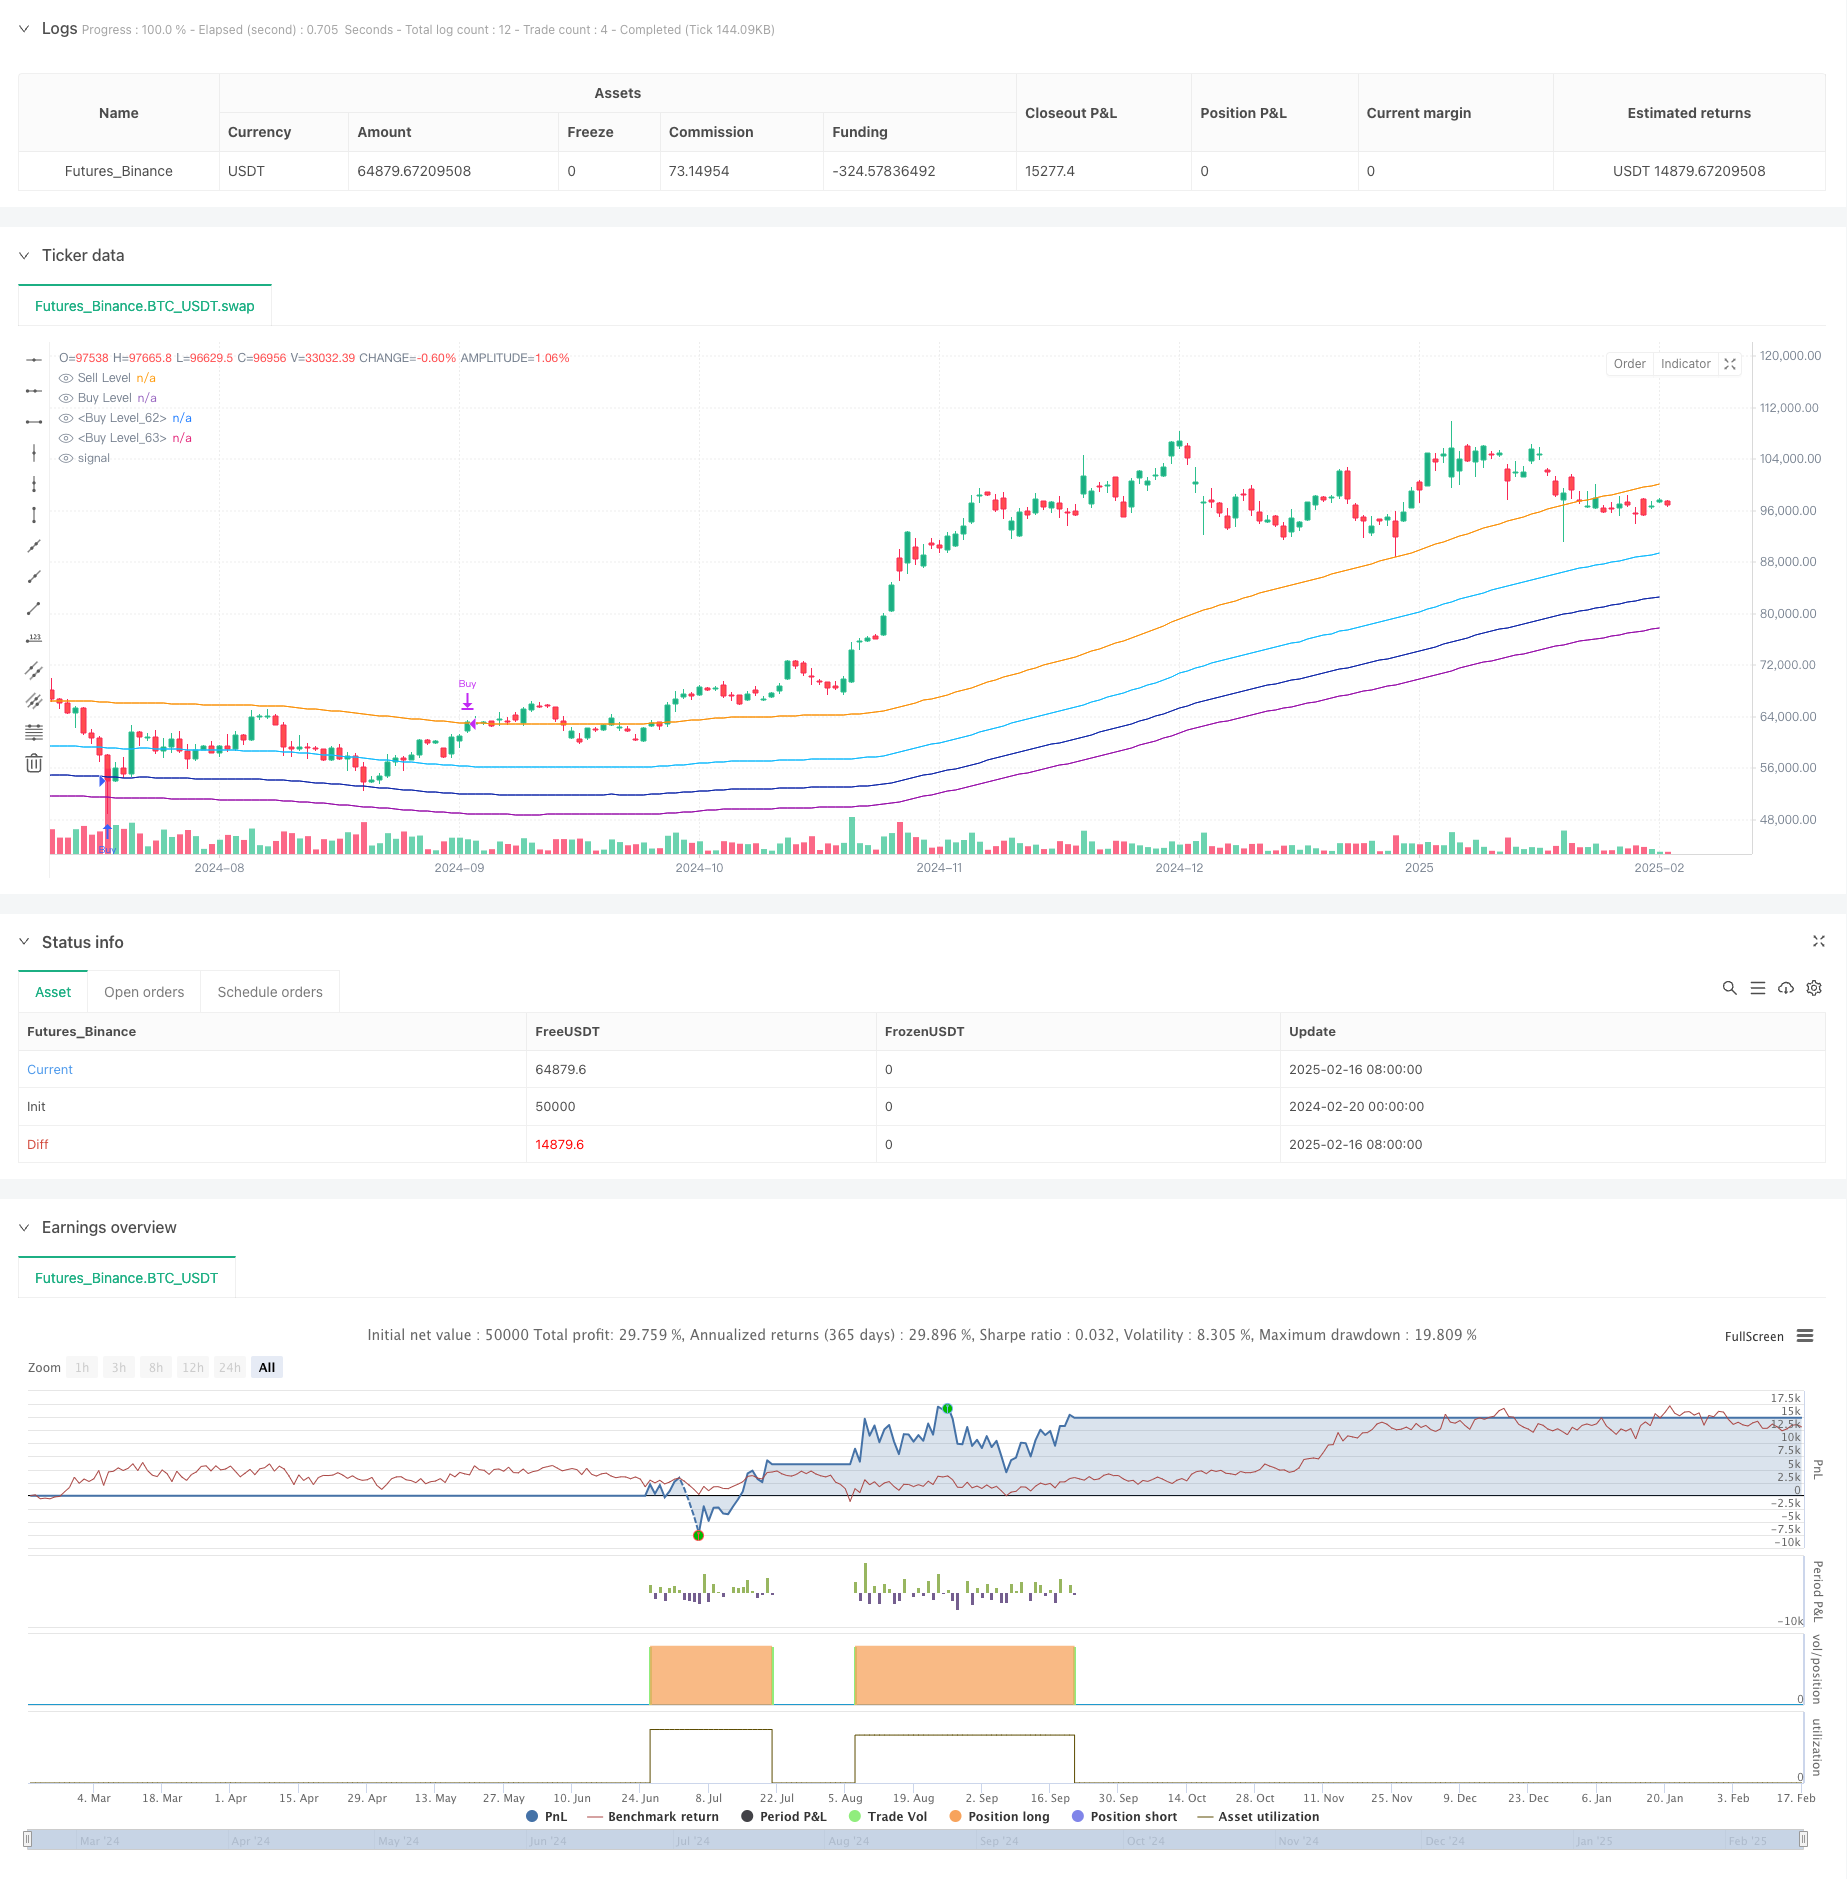
该策略是一个基于MA100移动平均线的多区间网格交易系统。它通过设定不同的价格回撤区间(-8%、-15%、-20%)来实现分批建仓,在市场出现较大跌幅时逐步买入,并在价格反弹3%时获利了结。策略采用智能网格的思路,通过限制每个区间的最大持仓数量和交易间隔来控制风险。
策略原理
策略的核心逻辑包含以下几个方面:
- 使用100周期简单移动平均线(SMA)作为策略的基准价格
- 设定三个买入区间:
- 区间2: 价格回撤8%,最大允许2笔交易
- 区间3: 价格回撤15%,最大允许3笔交易
- 区间4: 价格回撤20%,最大允许4笔交易
- 统一的平仓条件:当价格反弹超过MA100的3%时
- 每个区间都设置了50个K线周期的最小交易间隔,避免过于频繁交易
策略优势
- 多区间分层建仓降低了建仓成本
- 采用网格交易思想,能够在剧烈波动中捕捉机会
- 设置了最大持仓限制和交易间隔,有效控制风险
- 策略逻辑简单,容易理解和维护
- 适用于高波动率的市场环境
- 可以自动化执行,无需人工干预
策略风险
- 在持续下跌趋势中可能产生较大回撤
- 需要较大的资金规模来支持多区间建仓
- 平仓条件相对简单,可能错过更大的上涨空间
- 没有考虑市场整体趋势,可能在趋势性行情中表现欠佳
- 固定的百分比参数可能不适合所有市场环境
策略优化方向
- 引入趋势判断指标,在强趋势中调整策略参数
- 优化平仓机制,可以根据市场波动情况动态调整获利目标
- 增加风险控制模块,设置总体仓位限制和止损条件
- 引入波动率指标(如ATR),动态调整建仓区间
- 优化交易间隔机制,可以根据市场情况动态调整
总结
该策略通过多区间网格交易的方式,在市场大幅回调时分批建仓,具有较好的抗风险能力。虽然存在一些潜在风险,但通过合理的参数设置和风险控制措施,可以实现稳定的交易效果。进一步优化空间主要在于加入更多的市场适应性指标和完善风险控制机制。 ||
Overview
This strategy is a multi-zone grid trading system based on the MA100 moving average. It implements batch position building through different price retracement zones (-8%, -15%, -20%), buying gradually during significant market drops and taking profits when prices bounce back by 3%. The strategy adopts a smart grid approach, controlling risk by limiting the maximum number of positions and trading intervals in each zone.
Strategy Principles
The core logic includes the following aspects:
- Uses 100-period Simple Moving Average (SMA) as the strategy's reference price
- Sets three buying zones:
- Zone 2: 8% price retracement, maximum 2 trades allowed
- Zone 3: 15% price retracement, maximum 3 trades allowed
- Zone 4: 20% price retracement, maximum 4 trades allowed
- Unified closing condition: when price bounces back above 3% of MA100
- Each zone has a minimum trading interval of 50 candle periods to avoid excessive trading
Strategy Advantages
- Multi-zone layered position building reduces entry cost
- Adopts grid trading concept, capable of capturing opportunities in volatile markets
- Maximum position limits and trading intervals effectively control risk
- Simple strategy logic, easy to understand and maintain
- Suitable for high-volatility market environments
- Can be executed automatically without manual intervention
Strategy Risks
- May experience significant drawdowns in persistent downtrends
- Requires substantial capital to support multi-zone position building
- Simple closing conditions might miss larger upward movements
- Doesn't consider overall market trends, may underperform in trending markets
- Fixed percentage parameters may not suit all market conditions
Strategy Optimization Directions
- Introduce trend indicators to adjust strategy parameters in strong trends
- Optimize closing mechanism to dynamically adjust profit targets based on market volatility
- Add risk control module with overall position limits and stop-loss conditions
- Incorporate volatility indicators (like ATR) to dynamically adjust entry zones
- Optimize trading interval mechanism to adjust dynamically based on market conditions
Summary
This strategy achieves batch position building during significant market corrections through multi-zone grid trading, demonstrating good risk resistance. While there are potential risks, stable trading results can be achieved through appropriate parameter settings and risk control measures. Further optimization opportunities mainly lie in incorporating more market-adaptive indicators and improving risk control mechanisms.[/trans]
Source (PineScript)
/*backtest
start: 2024-02-20 00:00:00
end: 2025-02-17 08:00:00
period: 1d
basePeriod: 1d
exchanges: [{"eid":"Futures_Binance","currency":"BTC_USDT"}]
*/

//@version=5
// BTC SOL ETH BNB XMR RNDR AKT OM ONDO IO

strategy("MA100 crash buy 3 Zone // 15 min", overlay=true, calc_on_every_tick=true)

// Définition des MA
maH1 = ta.sma(close, 100)
maB2 = ta.sma(close, 100)
maB3 = ta.sma(close, 100)
maB4 = ta.sma(close, 100)

// Définition du niveau d'achat et de vente
sellLevel1 = maH1 * 1.03 //+3%
buyLevel2 = maB2 * 0.92 //-8%
buyLevel3 = maB2 * 0.85 //-15%
buyLevel4 = maB2 * 0.80 //-20%


// Nombre max de trades simultanés
maxTrades2 = 2
maxTrades3 = 3
maxTrades4 = 4

// Délais entre deux ordres (en bougies)
tradeDelay = 50
var float lastTradeTime = na
var float lastSellTime = na
tradeDelay2 = 50
var float lastTradeTime2 = na
tradeDelay3 = 50
var float lastTradeTime3 = na
tradeDelay4 = 50
var float lastTradeTime4 = na

// Condition d'achat et de vente
buyCondition2 = low <= buyLevel2 and strategy.opentrades < maxTrades2 and (na(lastTradeTime2) or bar_index - lastTradeTime2 > tradeDelay2)
buyCondition3 = low <= buyLevel3 and strategy.opentrades < maxTrades3 and (na(lastTradeTime3) or bar_index - lastTradeTime3 > tradeDelay3)
buyCondition4 = low <= buyLevel4 and strategy.opentrades < maxTrades4 and (na(lastTradeTime4) or bar_index - lastTradeTime4 > tradeDelay4)
sellCondition = strategy.position_size > 0 and high >= sellLevel1 and (na(lastSellTime) or bar_index - lastSellTime > tradeDelay)

if buyCondition2
    strategy.entry("Buy", strategy.long)
    lastTradeTime2 := bar_index  // Enregistre le moment du trade

if buyCondition3
    strategy.entry("Buy", strategy.long)
    lastTradeTime3 := bar_index  // Enregistre le moment du trade

if buyCondition4
    strategy.entry("Buy", strategy.long)
    lastTradeTime4 := bar_index  // Enregistre le moment du trade

if sellCondition
    strategy.close("Buy")  // Ferme 50% de toutes les positions ouvertes // , qty_percent=30
    lastSellTime := bar_index  // Enregistre le moment du trade


// Affichage des niveaux
plot(sellLevel1, color=#fa930d, title="Sell Level")
plot(buyLevel2, color=#15bbfd, title="Buy Level")
plot(buyLevel3, color=#1229aa, title="Buy Level")
plot(buyLevel4, color=#9812aa, title="Buy Level")
Detail
https://www.fmz.com/strategy/482598
Last Modified
2025-02-19 11:12:51