
9.1 KiB
Name
复合技术指标多维度趋势跟踪量化策略-Multi-Dimensional-Technical-Indicator-Trend-Following-Quantitative-Strategy
Author
ChaoZhang
Strategy Description
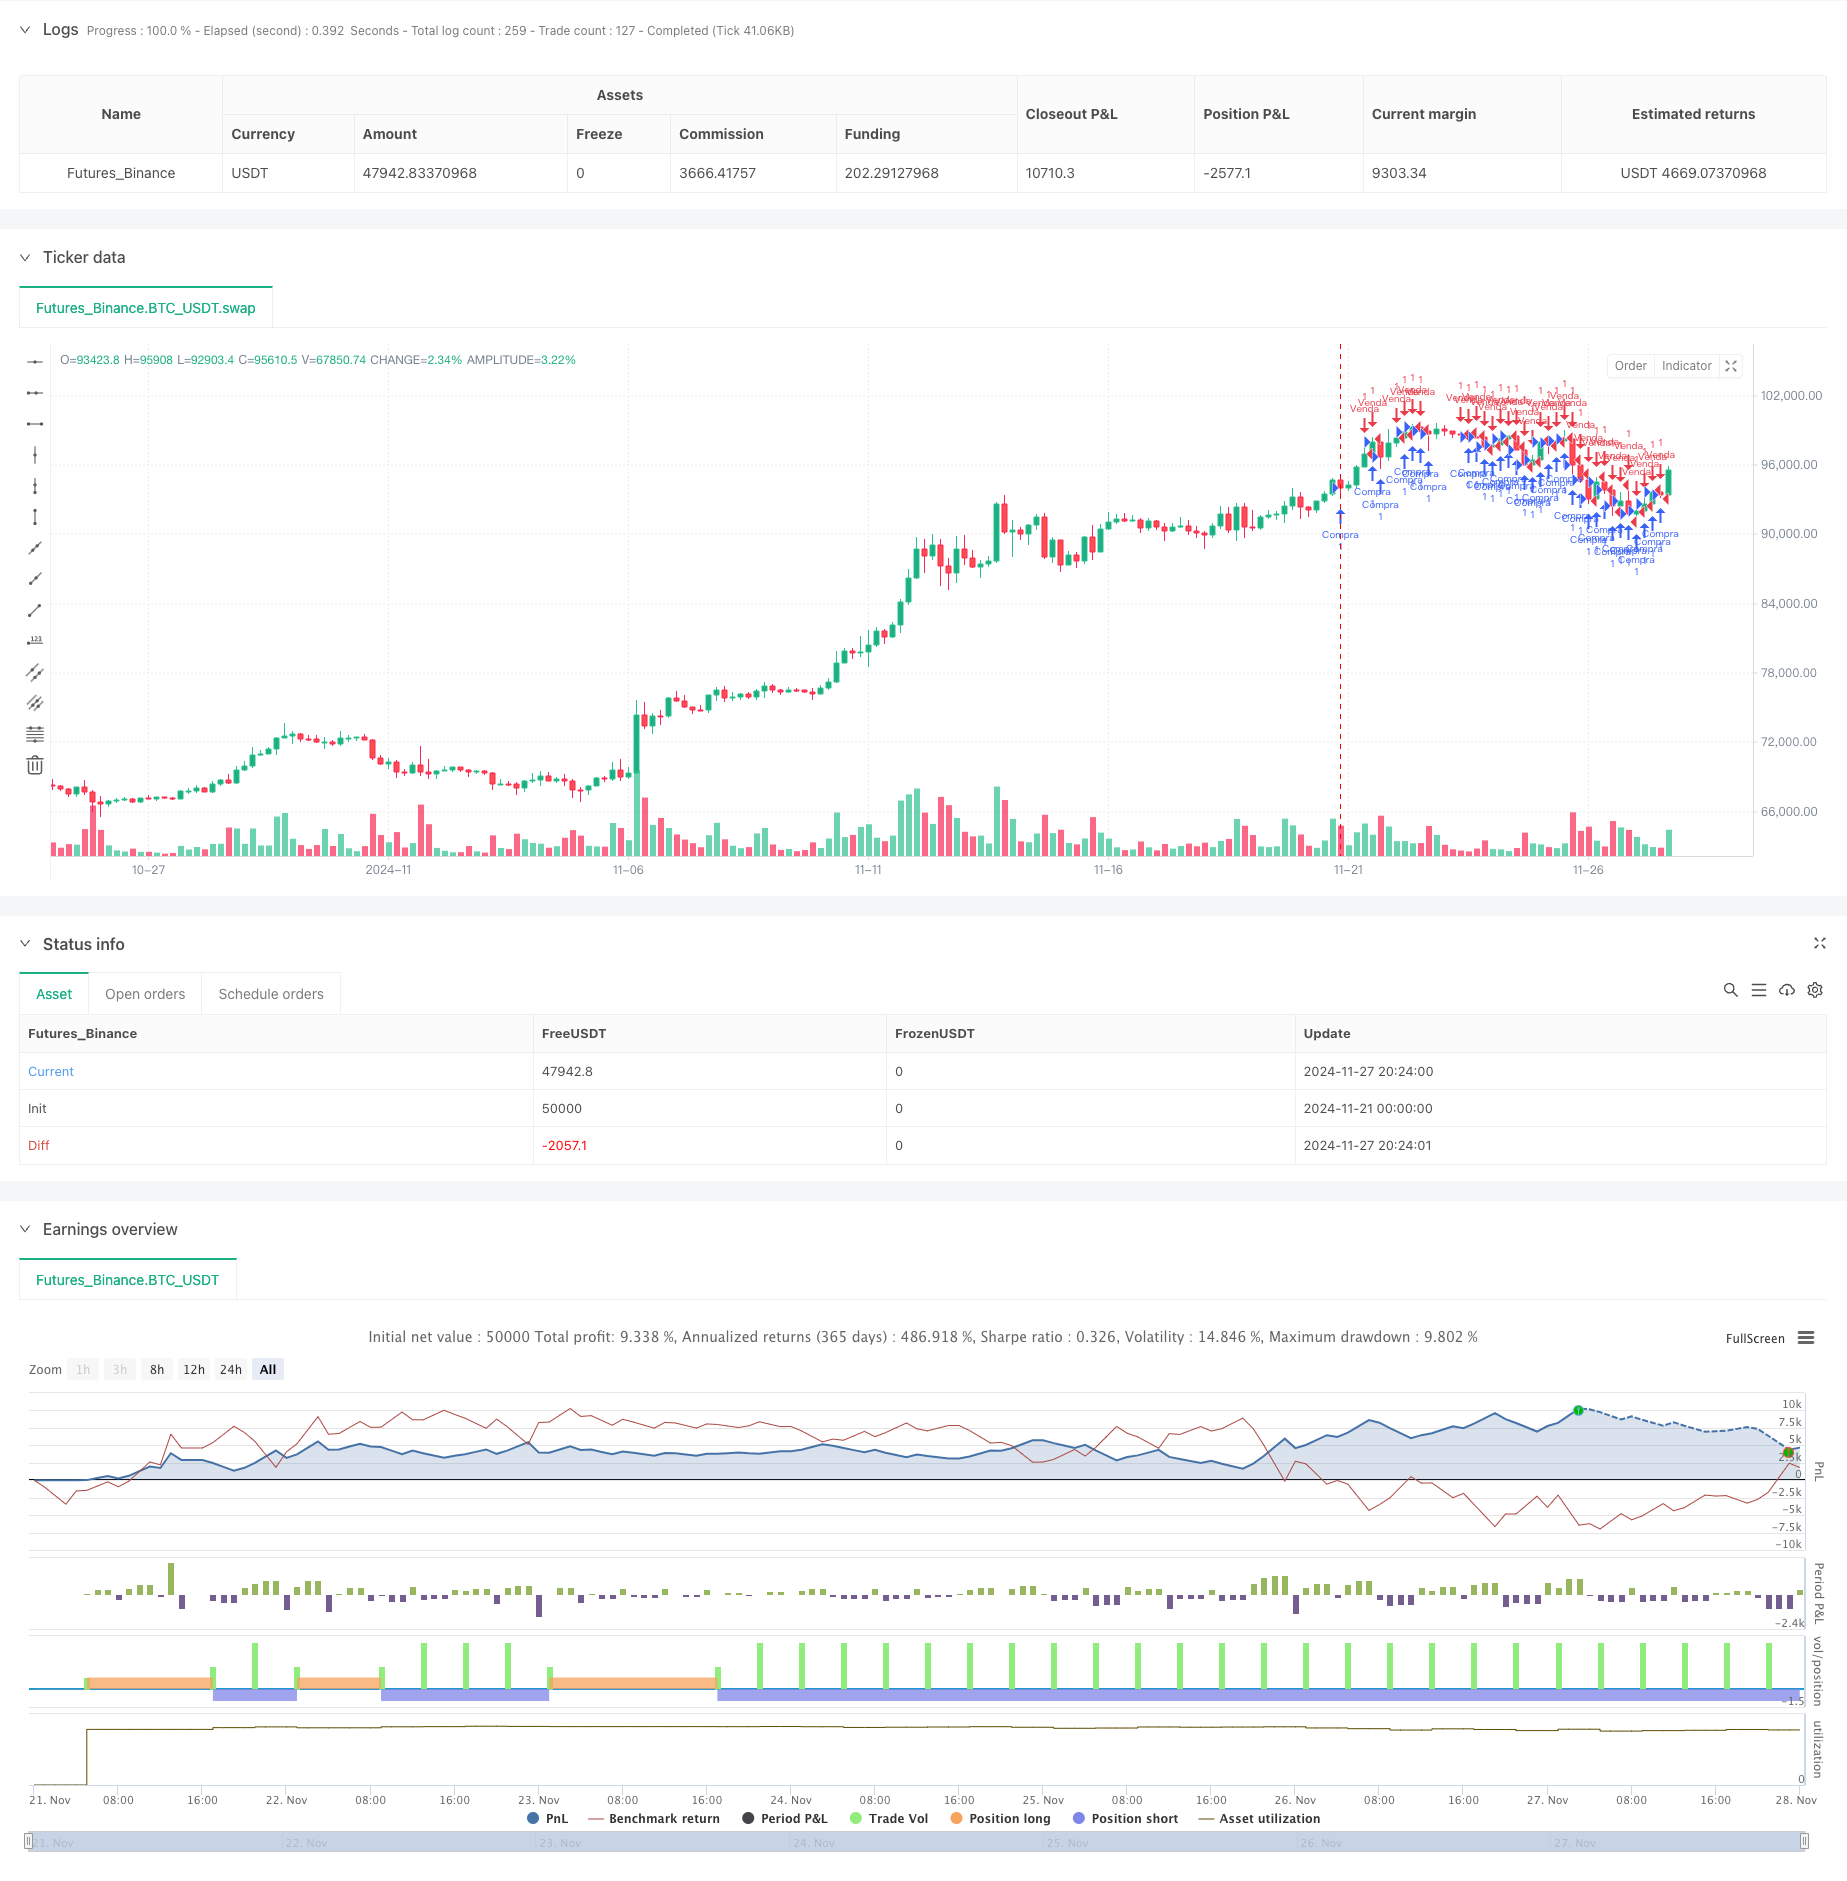
[trans]
概述
本策略是一个基于多维技术指标分析的量化交易系统,通过整合相对强弱指标(RSI)、移动平均线趋同散度指标(MACD)和指数移动平均线(EMA)等技术指标,构建了一个全自动化的交易决策体系。策略采用模块化设计,支持灵活配置交易参数,并集成了动态止盈止损机制以及追踪止损功能,旨在实现风险可控下的稳健收益。
策略原理
策略核心逻辑基于三大技术指标的协同分析:
- RSI指标用于识别超买超卖区域,当RSI低于30时产生买入信号,高于70时产生卖出信号
- MACD指标通过快慢线交叉判断趋势转换,快线上穿慢线视为买入信号,下穿则视为卖出信号
- EMA指标利用20日与50日均线的交叉确认趋势方向,短期均线上穿长期均线为买入信号,反之为卖出信号
策略在任一指标产生信号时即可触发交易,同时集成了百分比止损、固定止盈以及追踪止损三重风控机制。当价格达到预设盈利目标后,自动激活追踪止损功能,确保已获利润不会大幅回撤。
策略优势
- 多维度信号验证系统,通过不同技术指标的交叉验证提高交易信号可靠性
- 模块化设计思路,支持灵活开启/关闭各项指标,适应不同市场环境
- 完善的资金管理机制,通过参数化配置实现对不同规模资金的精确风险控制
- 三重止损保护体系,在保障收益的同时严格管理风险
- 全自动化操作,减少人为情绪干扰,提高执行效率
- 实时展示交易状态和盈亏情况,便于监控和调整策略
策略风险
- 震荡市场可能产生频繁交易信号,增加交易成本
- 多指标组合可能存在信号滞后性,影响入场时机
- 固定参数配置在剧烈波动行情下可能不够灵活
- 技术指标之间可能产生互相矛盾的信号
- 追踪止损可能在急涨急跌行情中提前触发平仓
策略优化方向
- 引入市场波动率指标,动态调整交易参数和止损位置
- 开发指标权重系统,根据不同市场环境自适应调整各指标影响力
- 增加时间框架分析,通过多周期信号确认提升准确率
- 设计智能资金管理系统,根据账户盈亏状况动态调整持仓规模
- 优化追踪止损算法,提高对剧烈波动的适应性
总结
该策略通过多维度技术指标的协同分析构建了一个系统化的交易决策框架,并通过完善的风险控制机制实现对交易全过程的精确管理。虽然在某些市场环境下可能面临特定挑战,但通过持续优化和改进,策略有望在不同市场周期中保持稳定表现。策略的模块化设计思路也为后续功能扩展和优化提供了良好基础。 ||
Overview
This strategy is a quantitative trading system based on multi-dimensional technical indicator analysis, integrating technical indicators such as Relative Strength Index (RSI), Moving Average Convergence Divergence (MACD), and Exponential Moving Average (EMA) to build a fully automated trading decision system. The strategy adopts a modular design, supports flexible configuration of trading parameters, and integrates dynamic take-profit, stop-loss, and trailing stop mechanisms to achieve stable returns under controlled risk.
Strategy Principles
The core logic is based on the synergistic analysis of three major technical indicators:
- RSI identifies overbought and oversold areas, generating buy signals when RSI is below 30 and sell signals above 70
- MACD determines trend changes through line crossovers, with upward crosses generating buy signals and downward crosses generating sell signals
- EMA confirms trend direction using 20-day and 50-day moving average crossovers, with short-term moving average crossing above long-term indicating buy signals and vice versa
The strategy triggers trades when any indicator generates a signal, while integrating percentage-based stop-loss, fixed take-profit, and trailing stop mechanisms. When price reaches the preset profit target, trailing stop is automatically activated to protect accumulated profits from significant drawdowns.
Strategy Advantages
- Multi-dimensional signal verification system improves trading signal reliability through cross-validation of different technical indicators
- Modular design supports flexible enabling/disabling of indicators to adapt to different market environments
- Comprehensive fund management mechanism achieves precise risk control for different capital scales through parameterized configuration
- Triple stop-loss protection system manages risk while securing profits
- Full automation reduces emotional interference and improves execution efficiency
- Real-time display of trading status and profit/loss facilitates monitoring and strategy adjustment
Strategy Risks
- Oscillating markets may generate frequent trading signals, increasing transaction costs
- Multiple indicator combinations may have signal lag, affecting entry timing
- Fixed parameter configuration may lack flexibility in volatile markets
- Technical indicators may generate contradictory signals
- Trailing stops may trigger premature exits in rapidly changing markets
Strategy Optimization Directions
- Introduce market volatility indicators to dynamically adjust trading parameters and stop-loss positions
- Develop indicator weighting system to adaptively adjust indicator influence based on market environment
- Add timeframe analysis to improve accuracy through multi-period signal confirmation
- Design intelligent fund management system to dynamically adjust position sizes based on account performance
- Optimize trailing stop algorithm to improve adaptation to extreme volatility
Summary
The strategy constructs a systematic trading decision framework through multi-dimensional technical indicator analysis and achieves precise management of the entire trading process through comprehensive risk control mechanisms. While facing specific challenges in certain market environments, the strategy has the potential to maintain stable performance across different market cycles through continuous optimization and improvement. The modular design approach also provides a solid foundation for future functional expansion and optimization.[/trans]
Source (PineScript)
/*backtest
start: 2024-11-21 00:00:00
end: 2024-11-28 00:00:00
period: 4h
basePeriod: 4h
exchanges: [{"eid":"Futures_Binance","currency":"BTC_USDT"}]
*/

// This Pine Script™ code is subject to the terms of the Mozilla Public License 2.0 at https://mozilla.org/MPL/2.0/
// © rfssocal

//@version=5
strategy("Quantico Bot MILLIONARIO", overlay=true)

// Configuração inicial de parâmetros
capital_inicial = input.float(100, "Capital Inicial ($)", minval=10)
risco_por_trade = input.float(1, "Risco por Trade (%)", minval=0.1, maxval=100)
take_profit_percent = input.float(2, "Take Profit (%)", minval=0.1)
stop_loss_percent = input.float(1, "Stop Loss (%)", minval=0.1)
trailing_stop_percent = input.float(5, "Trailing Stop Gatilho (%)", minval=0.1)

// Configuração de indicadores
usar_rsi = input.bool(true, "Usar RSI como Indicador")
usar_macd = input.bool(true, "Usar MACD como Indicador")
usar_ema = input.bool(true, "Usar EMA como Indicador")

// Indicadores
rsi_value = ta.rsi(close, 14)
[macd_line, signal_line, _] = ta.macd(close, 12, 26, 9)
ema_20 = ta.ema(close, 20)
ema_50 = ta.ema(close, 50)

// Condições de compra
compra_rsi = usar_rsi and rsi_value < 30
compra_macd = usar_macd and macd_line > signal_line
compra_ema = usar_ema and ema_20 > ema_50
compra = compra_rsi or compra_macd or compra_ema

// Condições de venda
venda_rsi = usar_rsi and rsi_value > 70
venda_macd = usar_macd and macd_line < signal_line
venda_ema = usar_ema and ema_20 < ema_50
venda = venda_rsi or venda_macd or venda_ema

// Calcular stop loss e take profit
stop_loss_price = strategy.position_avg_price * (1 - stop_loss_percent / 100)
take_profit_price = strategy.position_avg_price * (1 + take_profit_percent / 100)

// Adiciona trailing stop automático
if (strategy.position_size > 0 and close >= strategy.position_avg_price * (1 + trailing_stop_percent / 100))
    strategy.exit("Trailing Stop", from_entry="Compra", stop=close * 0.99)

// Executa as ordens automáticas
if (compra)
    strategy.entry("Compra", strategy.long)

if (venda)
    strategy.entry("Venda", strategy.short)

// Variável para calcular o lucro total
var float total_profit = 0.0
total_profit := strategy.netprofit

// Exibição de dados no gráfico
label.new(bar_index, na, "Take Profit: " + str.tostring(take_profit_price) + "\nStop Loss: " + str.tostring(stop_loss_price),
     style=label.style_label_down, color=color.green, textcolor=color.white)

// Exibe o balanço
label.new(bar_index, na, "Balanço Atual\nDiário: " + str.tostring(total_profit), style=label.style_label_down, color=color.blue, textcolor=color.white)
Detail
https://www.fmz.com/strategy/473366
Last Modified
2024-11-29 15:33:29