
7.2 KiB
Name
增强型趋势跟踪策略基于ADX与抛物线SAR的动态趋势识别系统-Enhanced-Trend-Following-System-Dynamic-Trend-Identification-Based-on-ADX-and-Parabolic-SAR
Author
ChaoZhang
Strategy Description
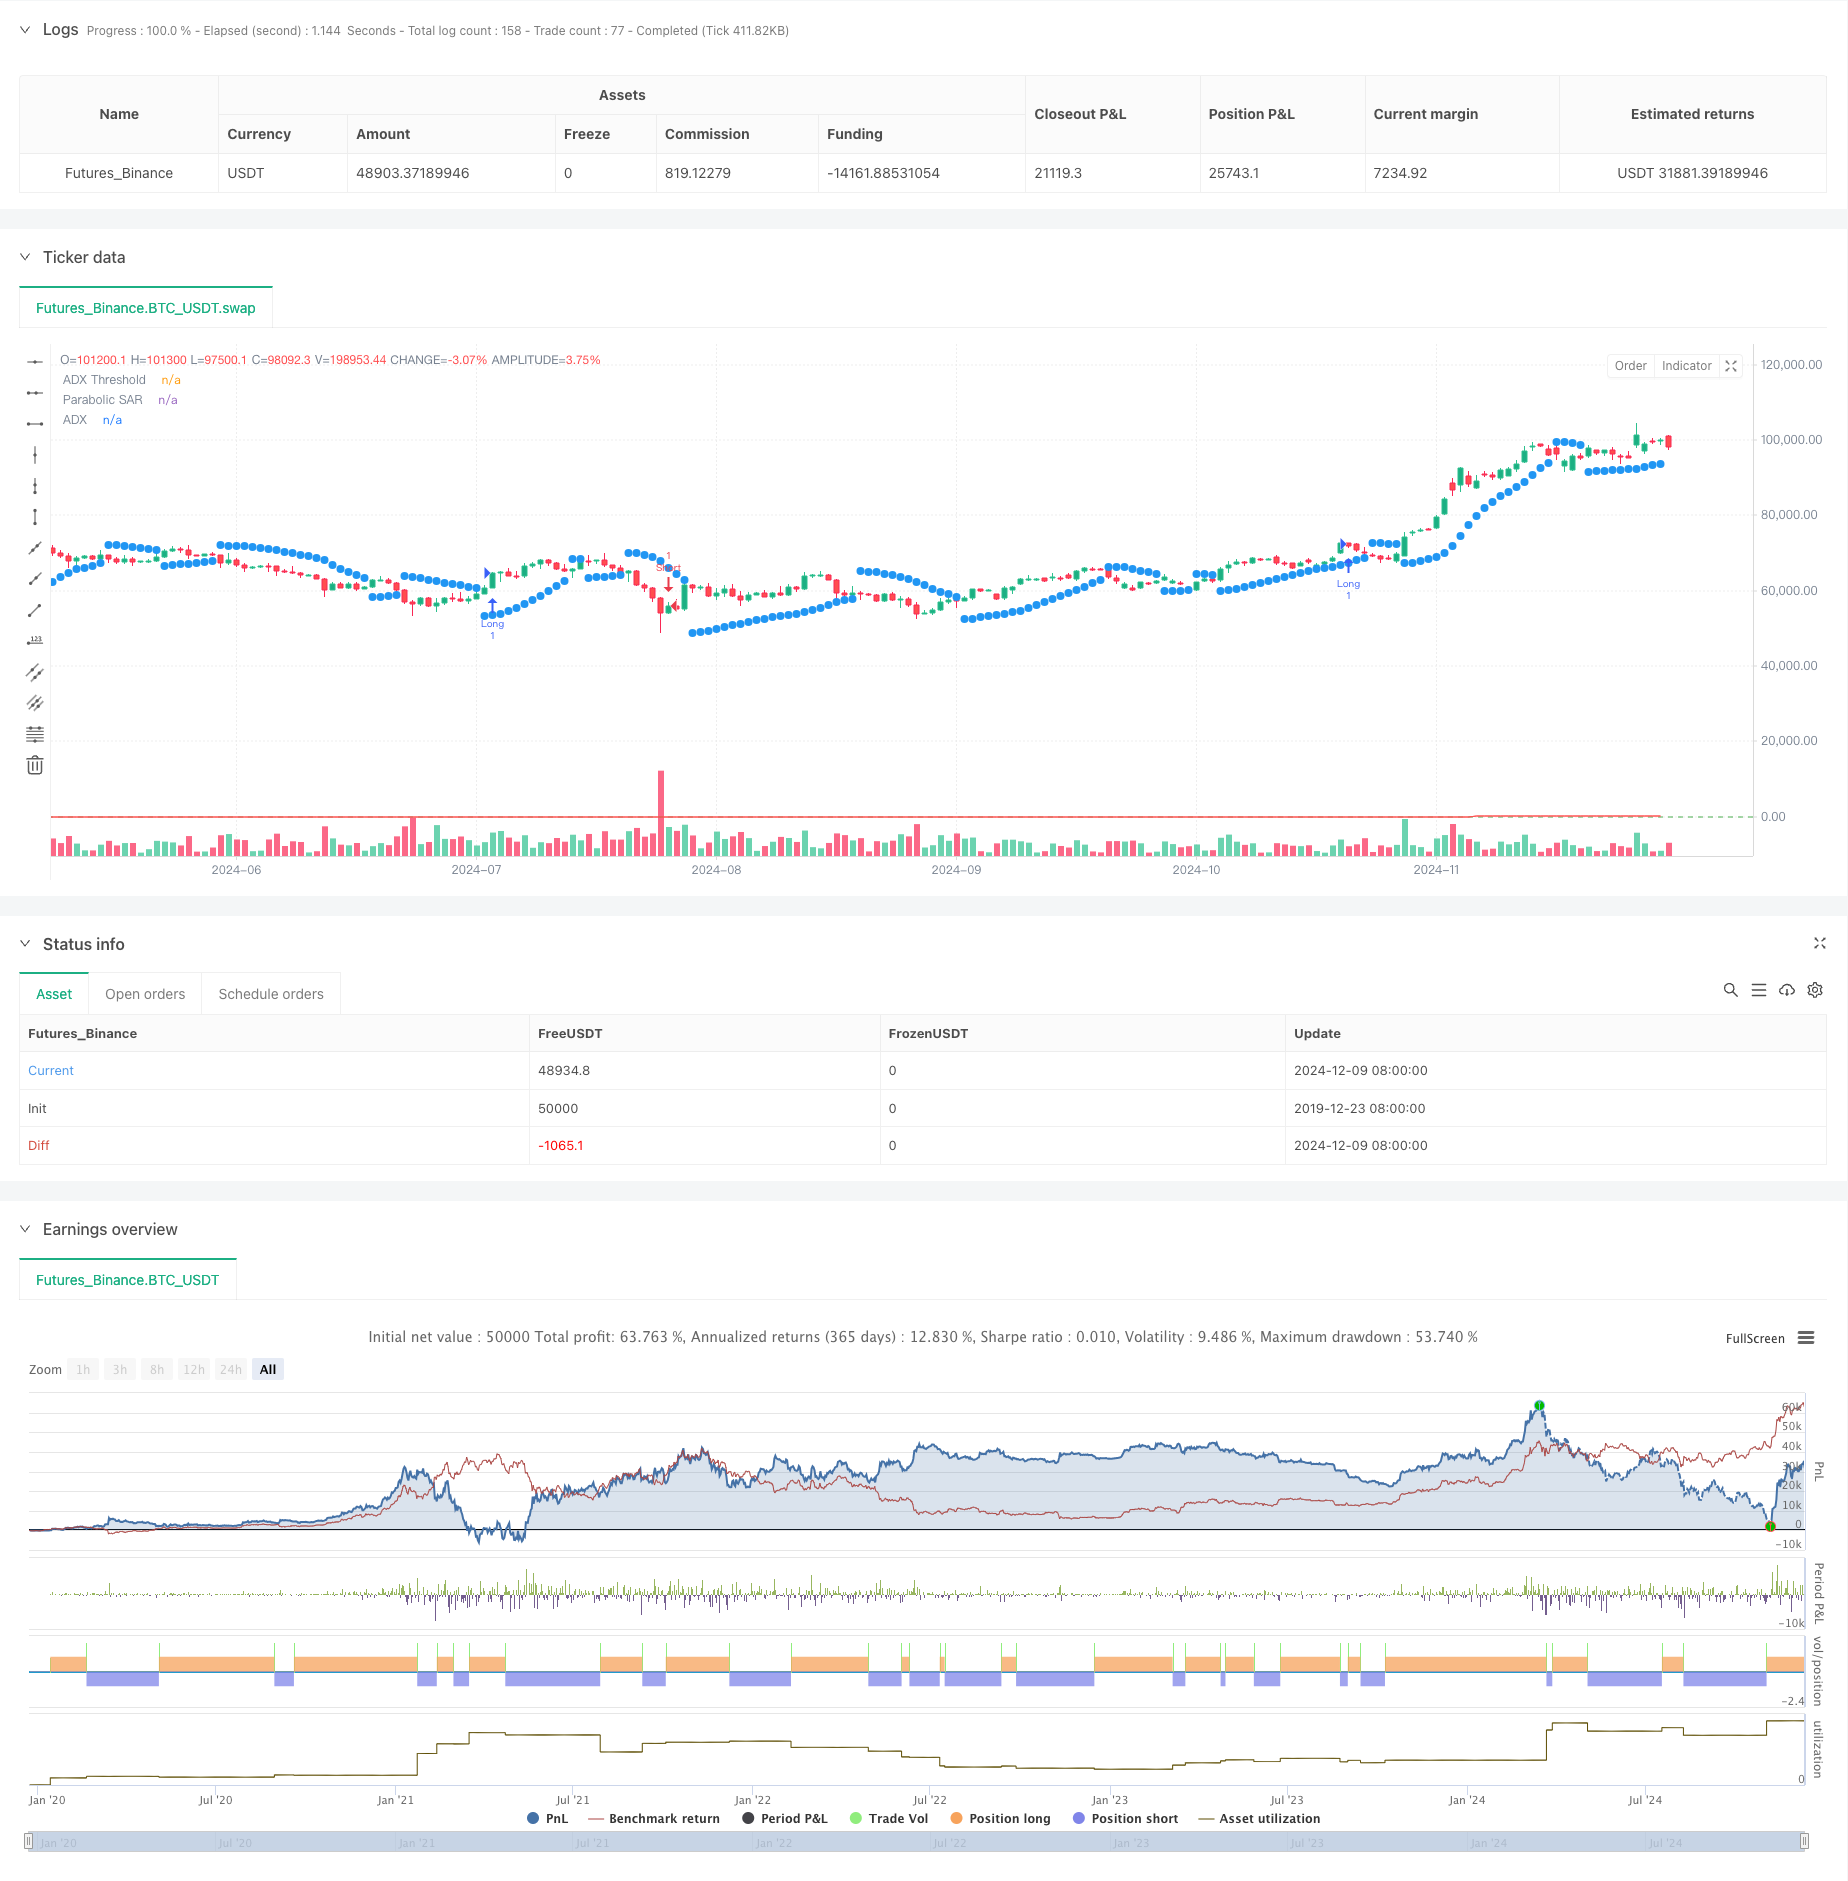
[trans]
概述
本策略是一个结合了平均趋向指标(ADX)和抛物线止损转向指标(SAR)的趋势跟踪交易系统。该系统通过ADX来衡量趋势强度,利用SAR来确认趋势方向,从而在强趋势市场中捕捉交易机会。系统采用双重确认机制,既确保趋势的存在性,又验证趋势的可靠性。
策略原理
策略的核心逻辑基于以下几个关键组成部分:
- ADX指标用于测量趋势强度,当ADX值超过25时,表明市场存在明显趋势。
- DI+和DI-的交叉用于判断趋势方向,DI+大于DI-时代表上升趋势,反之则为下降趋势。
- 抛物线SAR通过动态调整止损点来跟踪价格走势,为趋势方向提供额外确认。
交易信号的触发条件如下:
- 做多条件:ADX>25且DI+>DI-且价格位于SAR之上
- 做空条件:ADX>25且DI->DI+且价格位于SAR之下
- 平仓条件:当出现相反的交易信号时
策略优势
- 双重确认机制显著提高了交易信号的可靠性
- 动态止损设置helps保护既有利润
- 参数可调整性强,适应不同市场环境
- 策略逻辑清晰,易于理解和执行
- 在强趋势市场中表现优异
策略风险
- 在震荡市场中可能产生频繁的假信号
- 入场点可能滞后于趋势起点
- 快速反转行情下可能承受较大回撤
- 参数设置不当可能影响策略表现
风险控制建议:
- 设置最大回撤限制
- 根据市场波动调整参数
- 结合其他技术指标进行交易确认
- 实施仓位管理策略
策略优化方向
-
引入波动率指标调整参数
- 在高波动期间提高ADX阈值
- 在低波动期间降低SAR敏感度
-
优化出场机制
- 添加利润目标
- 设计动态止损策略
-
增加市场环境过滤
- 结合趋势线分析
- 考虑成交量因素
-
完善仓位管理
- 基于ATR设计仓位大小
- 实现分批建仓/平仓
总结
该策略通过结合ADX和SAR指标,构建了一个稳健的趋势跟踪系统。策略的主要优势在于其双重确认机制和动态止损设置,但在震荡市场中表现可能欠佳。通过合理的参数优化和风险控制,该策略能够在趋势明显的市场环境中获得良好表现。建议交易者在实盘应用前进行充分的回测,并根据具体市场特点调整参数设置。
||
Overview
This strategy is a trend following trading system that combines the Average Directional Index (ADX) with the Parabolic Stop and Reverse (SAR) indicator. The system measures trend strength using ADX and confirms trend direction using SAR to capture trading opportunities in strong trending markets. It employs a dual confirmation mechanism to ensure both the existence and reliability of trends.
Strategy Principle
The core logic is based on the following key components:
- ADX indicator measures trend strength, with values above 25 indicating a significant trend.
- DI+ and DI- crossovers determine trend direction, with DI+ > DI- indicating uptrend and vice versa.
- Parabolic SAR tracks price movement by dynamically adjusting stop points, providing additional trend confirmation.
Trade signal triggers are as follows:
- Long entry: ADX>25, DI+>DI-, and price above SAR
- Short entry: ADX>25, DI->DI+, and price below SAR
- Exit: When opposite trading signals appear
Strategy Advantages
- Dual confirmation mechanism significantly improves signal reliability
- Dynamic stop-loss helps protect existing profits
- High parameter adaptability for different market conditions
- Clear strategy logic, easy to understand and execute
- Excellent performance in strong trending markets
Strategy Risks
- May generate frequent false signals in oscillating markets
- Entry points may lag behind trend initiation
- Potential for significant drawdowns during quick reversals
- Parameter settings can significantly impact strategy performance
Risk control suggestions:
- Set maximum drawdown limits
- Adjust parameters based on market volatility
- Incorporate additional technical indicators for trade confirmation
- Implement position management strategies
Strategy Optimization Directions
-
Introduce volatility indicators for parameter adjustment
- Increase ADX threshold during high volatility periods
- Reduce SAR sensitivity during low volatility periods
-
Optimize exit mechanism
- Add profit targets
- Design dynamic stop-loss strategy
-
Add market environment filters
- Incorporate trendline analysis
- Consider volume factors
-
Improve position management
- Design position sizing based on ATR
- Implement staged entry/exit
Summary
This strategy constructs a robust trend following system by combining ADX and SAR indicators. Its main advantages lie in the dual confirmation mechanism and dynamic stop-loss settings, although performance may be suboptimal in oscillating markets. Through appropriate parameter optimization and risk control, the strategy can achieve good performance in clearly trending market environments. Traders are advised to conduct thorough backtesting before live implementation and adjust parameters according to specific market characteristics. [/trans]
Source (PineScript)
/*backtest
start: 2019-12-23 08:00:00
end: 2024-12-10 08:00:00
period: 1d
basePeriod: 1d
exchanges: [{"eid":"Futures_Binance","currency":"BTC_USDT"}]
*/

// This Pine Script™ code is subject to the terms of the Mozilla Public License 2.0 at https://mozilla.org/MPL/2.0/
// © traderhub

//@version=5
strategy("Trend Following ADX + Parabolic SAR", overlay=true)

// Strategy parameters
adxLength = input(14, title="ADX Period")
adxThreshold = input(25, title="ADX Threshold")
adxSmoothing = input(14, title="ADX Smoothing")
sarStart = input(0.02, title="Parabolic SAR Start")  // Starting acceleration factor
sarIncrement = input(0.02, title="Parabolic SAR Increment")  // Increment step
sarMax = input(0.2, title="Parabolic SAR Max")  // Maximum acceleration factor

// Calculate ADX, DI+, and DI-
[diPlus, diMinus, adx] = ta.dmi(adxLength, adxSmoothing)

// Parabolic SAR calculation
sar = ta.sar(sarStart, sarIncrement, sarMax)

// Conditions for a long position
longCondition = adx > adxThreshold and diPlus > diMinus and close > sar

// Conditions for a short position
shortCondition = adx > adxThreshold and diMinus > diPlus and close < sar

// Enter a long position
if (longCondition)
    strategy.entry("Long", strategy.long)

// Enter a short position
if (shortCondition)
    strategy.entry("Short", strategy.short)

// Close position on reverse signal
if (strategy.position_size > 0 and shortCondition)
    strategy.close("Long")
if (strategy.position_size < 0 and longCondition)
    strategy.close("Short")

// Plot indicators on the chart
plot(sar, color=color.blue, style=plot.style_circles, linewidth=2, title="Parabolic SAR")
plot(adx, color=color.red, title="ADX")
hline(adxThreshold, "ADX Threshold", color=color.green)
Detail
https://www.fmz.com/strategy/474834
Last Modified
2024-12-12 14:21:47