
7.8 KiB
Name
增强型斐波那契趋势跟踪与风险管理策略-Enhanced-Fibonacci-Trend-Following-and-Risk-Management-Strategy
Author
ChaoZhang
Strategy Description
[trans]
概述
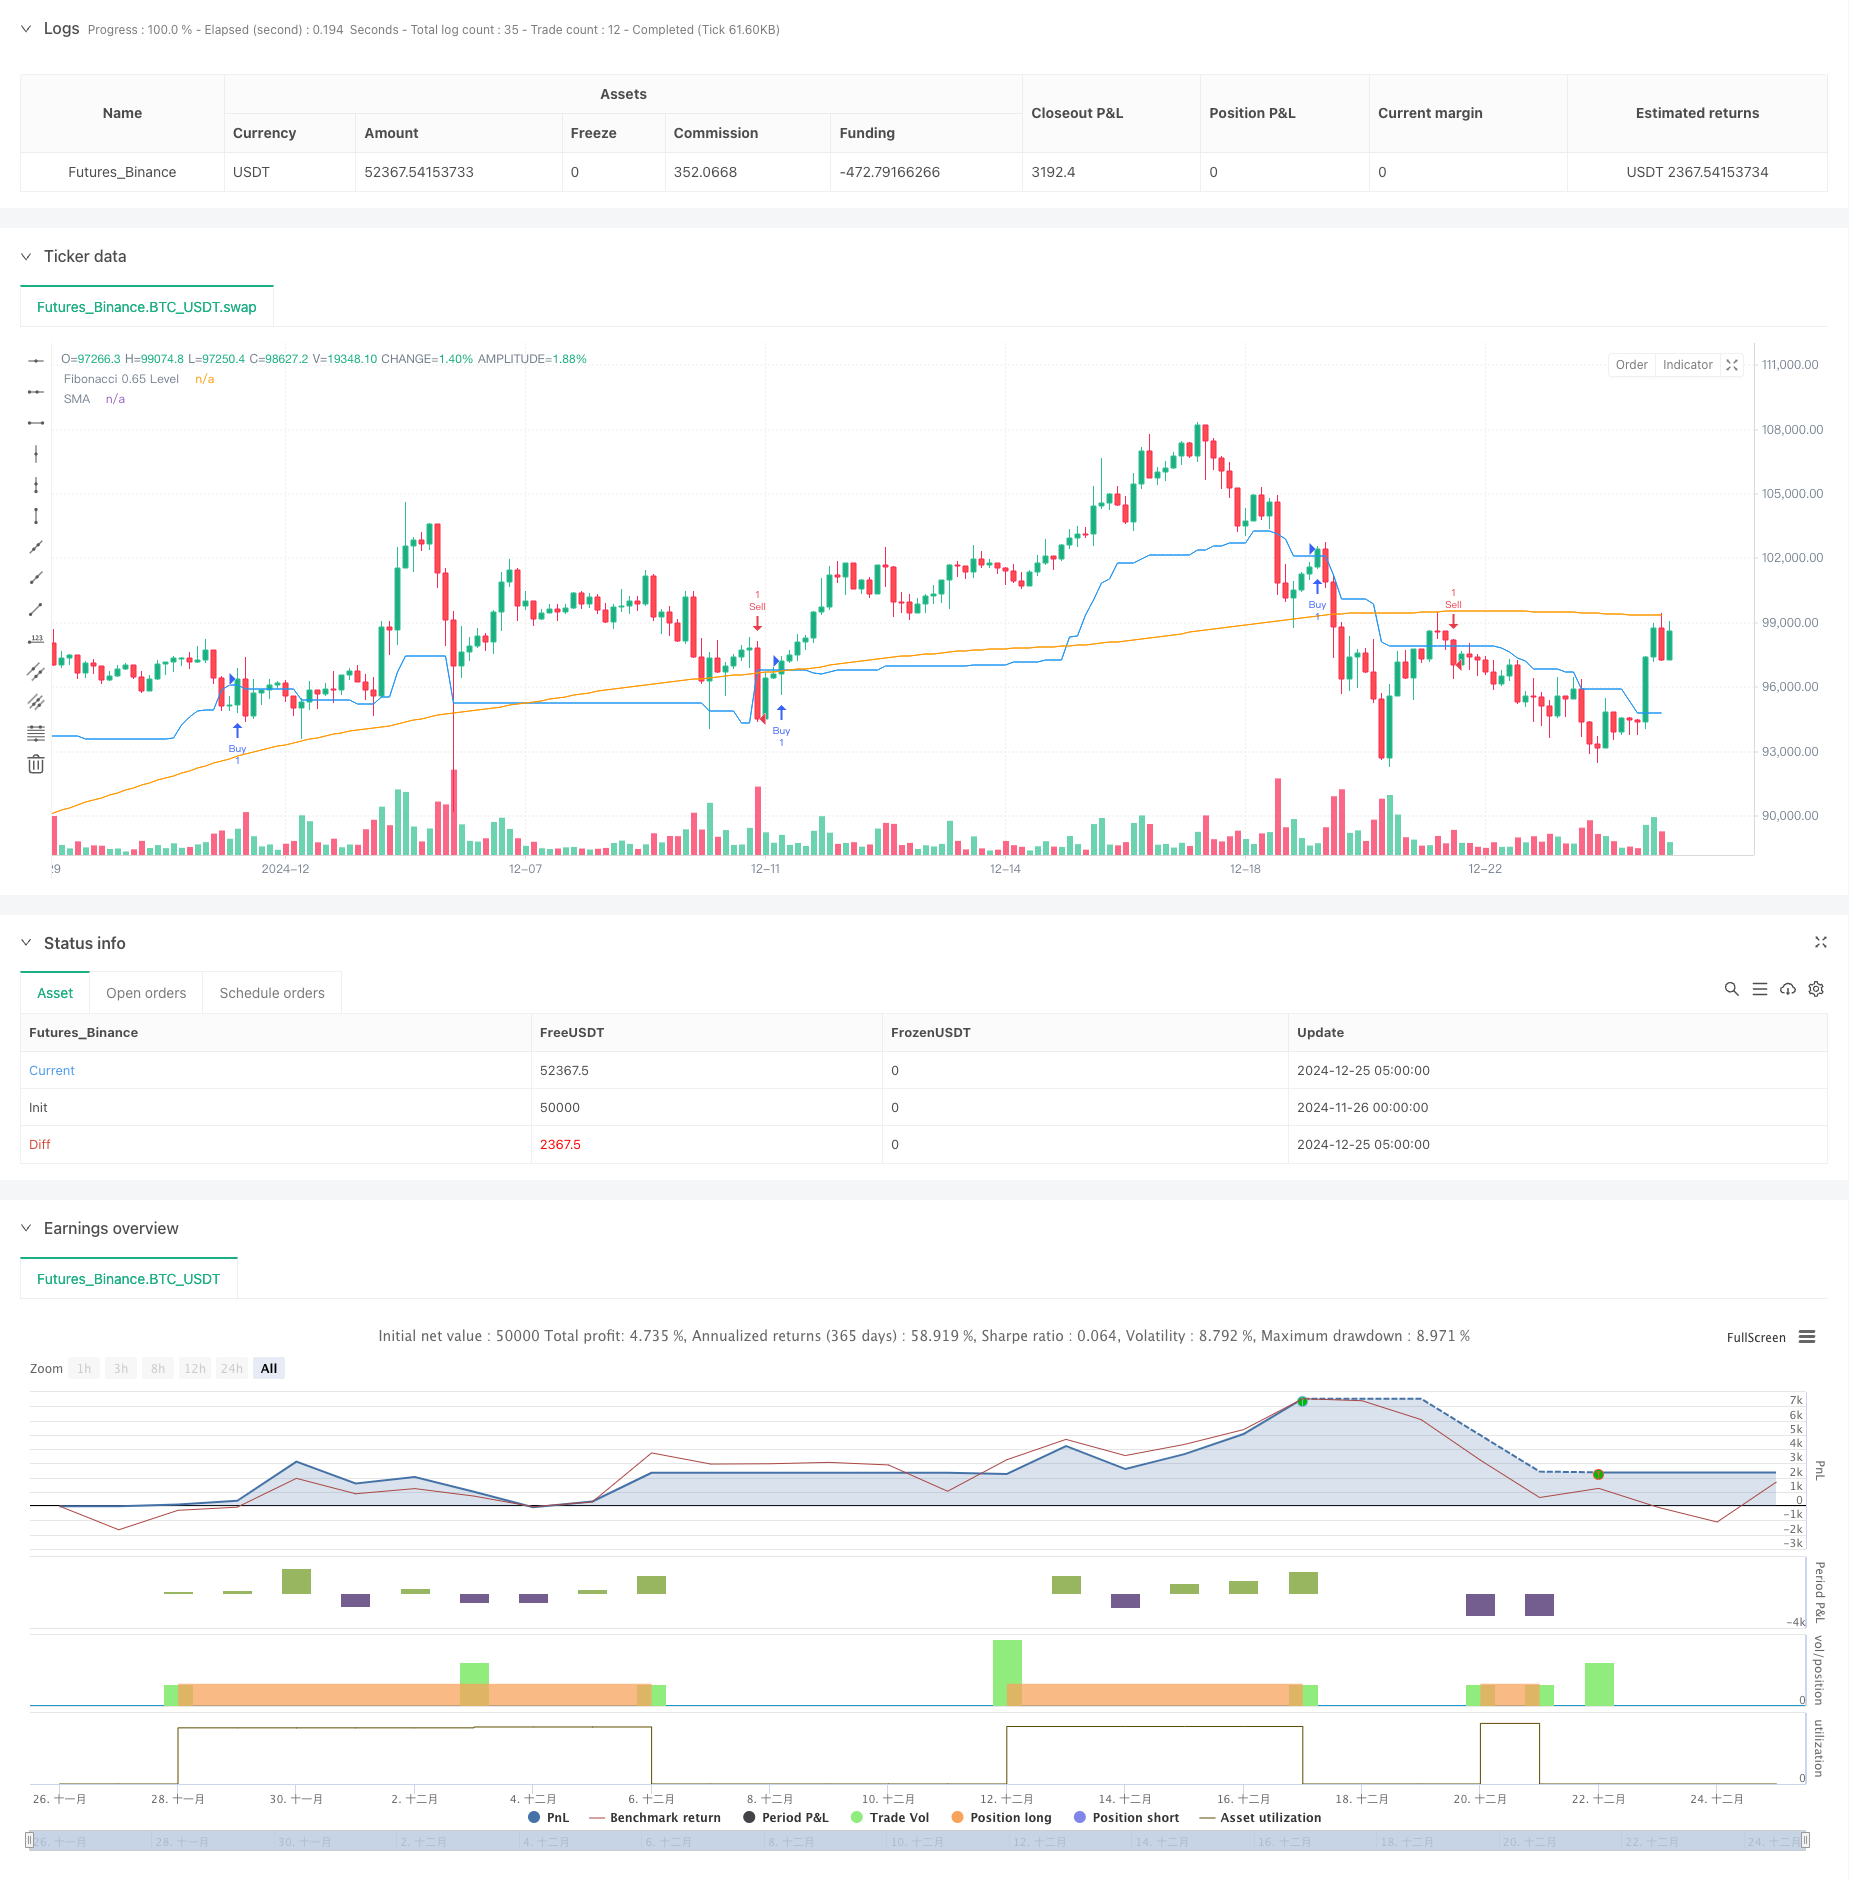
该策略是一个结合了斐波那契回撤、趋势跟踪和风险管理的综合交易系统。它主要基于0.65斐波那契回撤水平作为关键价格参考点,并结合移动平均线来确认市场趋势,同时整合了基于ATR的动态止损止盈机制。该策略在15分钟时间周期上运行,旨在捕捉符合当前市场趋势的高概率交易机会。
策略原理
策略的核心逻辑基于以下几个关键组件:
- 使用38个周期的历史数据计算最高点和最低点,并基于这个范围确定0.65斐波那契回撤水平。
- 采用181周期的简单移动平均线(SMA)作为趋势过滤器,用于确定市场的总体方向。
- 利用12周期的平均真实波幅(ATR)乘以1.8的系数来设置动态的止损和止盈水平。
- 在上升趋势中,当价格从下方突破0.65斐波那契水平时触发做多信号;在下降趋势中,当价格从上方突破该水平时触发做空信号。
策略优势
- 整合了多重技术分析工具,提供了更可靠的交易信号。
- 使用动态的止损止盈水平,能够根据市场波动性自适应调整风险管理参数。
- 通过趋势过滤器确保交易方向与主趋势保持一致,提高了交易成功率。
- 采用百分比仓位管理方式,默认使用5%的账户权益,有效控制风险。
- 策略逻辑清晰,参数可调整性强,适合不同市场环境。
策略风险
- 在横盘市场中可能产生频繁的假突破信号,增加交易成本。
- 181周期的移动平均线可能对市场变化反应较慢,在急剧转向的市场中可能造成损失。
- 固定的ATR乘数可能在不同的市场波动环境下表现不一致。
- 策略依赖于准确的高低点计算,在数据质量不佳的情况下可能产生误判。
策略优化方向
- 引入交易量指标作为辅助确认,提高突破信号的可靠性。
- 考虑加入动态的ATR乘数调整机制,使止损止盈更适应当前市场环境。
- 可以添加市场波动率过滤器,在高波动率期间调整或暂停交易。
- 优化趋势判断机制,可以考虑使用多周期移动平均线组合。
- 增加交易时间过滤,避开市场波动较大的时段。
总结
这是一个设计合理的中期趋势跟踪策略,通过结合斐波那契理论、趋势跟踪和风险管理,构建了一个完整的交易系统。策略的主要特点是在识别市场趋势的基础上,利用价格突破关键水平产生交易信号,并通过动态的止损止盈机制来管理风险。虽然存在一些需要优化的地方,但总体而言这是一个具有实用价值的策略框架。 ||
Overview
This strategy is a comprehensive trading system that combines Fibonacci retracement, trend following, and risk management. It primarily uses the 0.65 Fibonacci retracement level as a key price reference point, incorporates moving averages for trend confirmation, and integrates dynamic stop-loss and take-profit mechanisms based on ATR. The strategy operates on a 15-minute timeframe and aims to capture high-probability trading opportunities aligned with the current market trend.
Strategy Principles
The core logic of the strategy is based on several key components:
- Calculates highest and lowest points over a 38-period lookback window to determine the 0.65 Fibonacci retracement level.
- Uses a 181-period Simple Moving Average (SMA) as a trend filter to determine the overall market direction.
- Employs a 12-period Average True Range (ATR) multiplied by 1.8 to set dynamic stop-loss and take-profit levels.
- Generates long signals when price breaks above the 0.65 Fibonacci level during uptrends, and short signals when price breaks below this level during downtrends.
Strategy Advantages
- Integrates multiple technical analysis tools for more reliable trading signals.
- Implements dynamic stop-loss and take-profit levels that adapt to market volatility.
- Ensures trade direction aligns with the main trend through trend filtering, improving success rate.
- Uses percentage-based position sizing, defaulting to 5% of account equity for effective risk control.
- Features clear logic and adjustable parameters, suitable for various market conditions.
Strategy Risks
- May generate frequent false breakout signals in ranging markets, increasing trading costs.
- The 181-period moving average might be slow to react to market changes, potentially leading to losses in rapidly reversing markets.
- Fixed ATR multiplier may perform inconsistently across different market volatility environments.
- Strategy relies on accurate high-low calculations, which may lead to misinterpretation with poor quality data.
Strategy Optimization Directions
- Introduce volume indicators as confirmation to improve breakout signal reliability.
- Consider implementing dynamic ATR multiplier adjustment mechanism for more adaptive stop-loss and take-profit levels.
- Add market volatility filters to adjust or pause trading during high volatility periods.
- Optimize trend determination mechanism by considering multiple-period moving average combinations.
- Add trading time filters to avoid highly volatile market periods.
Summary
This is a well-designed medium-term trend following strategy that builds a complete trading system by combining Fibonacci theory, trend following, and risk management. The strategy's main feature is generating trading signals based on price breakouts of key levels while identifying market trends, managing risk through dynamic stop-loss and take-profit mechanisms. While there are areas for optimization, it provides a practical strategy framework with real-world application value.[/trans]
Source (PineScript)
/*backtest
start: 2024-11-26 00:00:00
end: 2024-12-25 08:00:00
period: 3h
basePeriod: 3h
exchanges: [{"eid":"Futures_Binance","currency":"BTC_USDT"}]
*/

//@version=5
strategy("Refined Fibonacci Strategy - Enhanced Risk Management", overlay=true)

// Input parameters
fibonacci_lookback = input.int(38, minval=2, title="Fibonacci Lookback Period")
atr_multiplier = input.float(1.8, title="ATR Multiplier for Stop Loss and Take Profit")
sma_length = input.int(181, title="SMA Length")

// Calculating Fibonacci levels
var float high_level = na
var float low_level = na
if (ta.change(ta.highest(high, fibonacci_lookback)))
    high_level := ta.highest(high, fibonacci_lookback)
if (ta.change(ta.lowest(low, fibonacci_lookback)))
    low_level := ta.lowest(low, fibonacci_lookback)

fib_level_0_65 = high_level - ((high_level - low_level) * 0.65)

// Trend Filter using SMA
sma = ta.sma(close, sma_length)
in_uptrend = close > sma
in_downtrend = close < sma

// ATR for Risk Management
atr = ta.atr(12)
long_stop_loss = close - (atr * atr_multiplier)
long_take_profit = close + (atr * atr_multiplier)
short_stop_loss = close + (atr * atr_multiplier)
short_take_profit = close - (atr * atr_multiplier)

// Entry Conditions
buy_signal = close > fib_level_0_65 and close[1] <= fib_level_0_65 and in_uptrend
sell_signal = close < fib_level_0_65 and close[1] >= fib_level_0_65 and in_downtrend

// Execute Trades
if (buy_signal)
    strategy.entry("Buy", strategy.long)
if (sell_signal)
    strategy.entry("Sell", strategy.short)

// Exit Conditions
if (strategy.position_size > 0)
    strategy.exit("Exit Long", "Buy", stop=long_stop_loss, limit=long_take_profit)
if (strategy.position_size < 0)
    strategy.exit("Exit Short", "Sell", stop=short_stop_loss, limit=short_take_profit)

// Plotting
plot(fib_level_0_65, color=color.blue, title="Fibonacci 0.65 Level")
plot(sma, color=color.orange, title="SMA")
Detail
https://www.fmz.com/strategy/476243
Last Modified
2024-12-27 14:10:14