
7.4 KiB
Name
增强型布林带动态止盈止损量化交易策略-Enhanced-Bollinger-Bands-Dynamic-SL-TP-Quantitative-Trading-Strategy
Author
ChaoZhang
Strategy Description
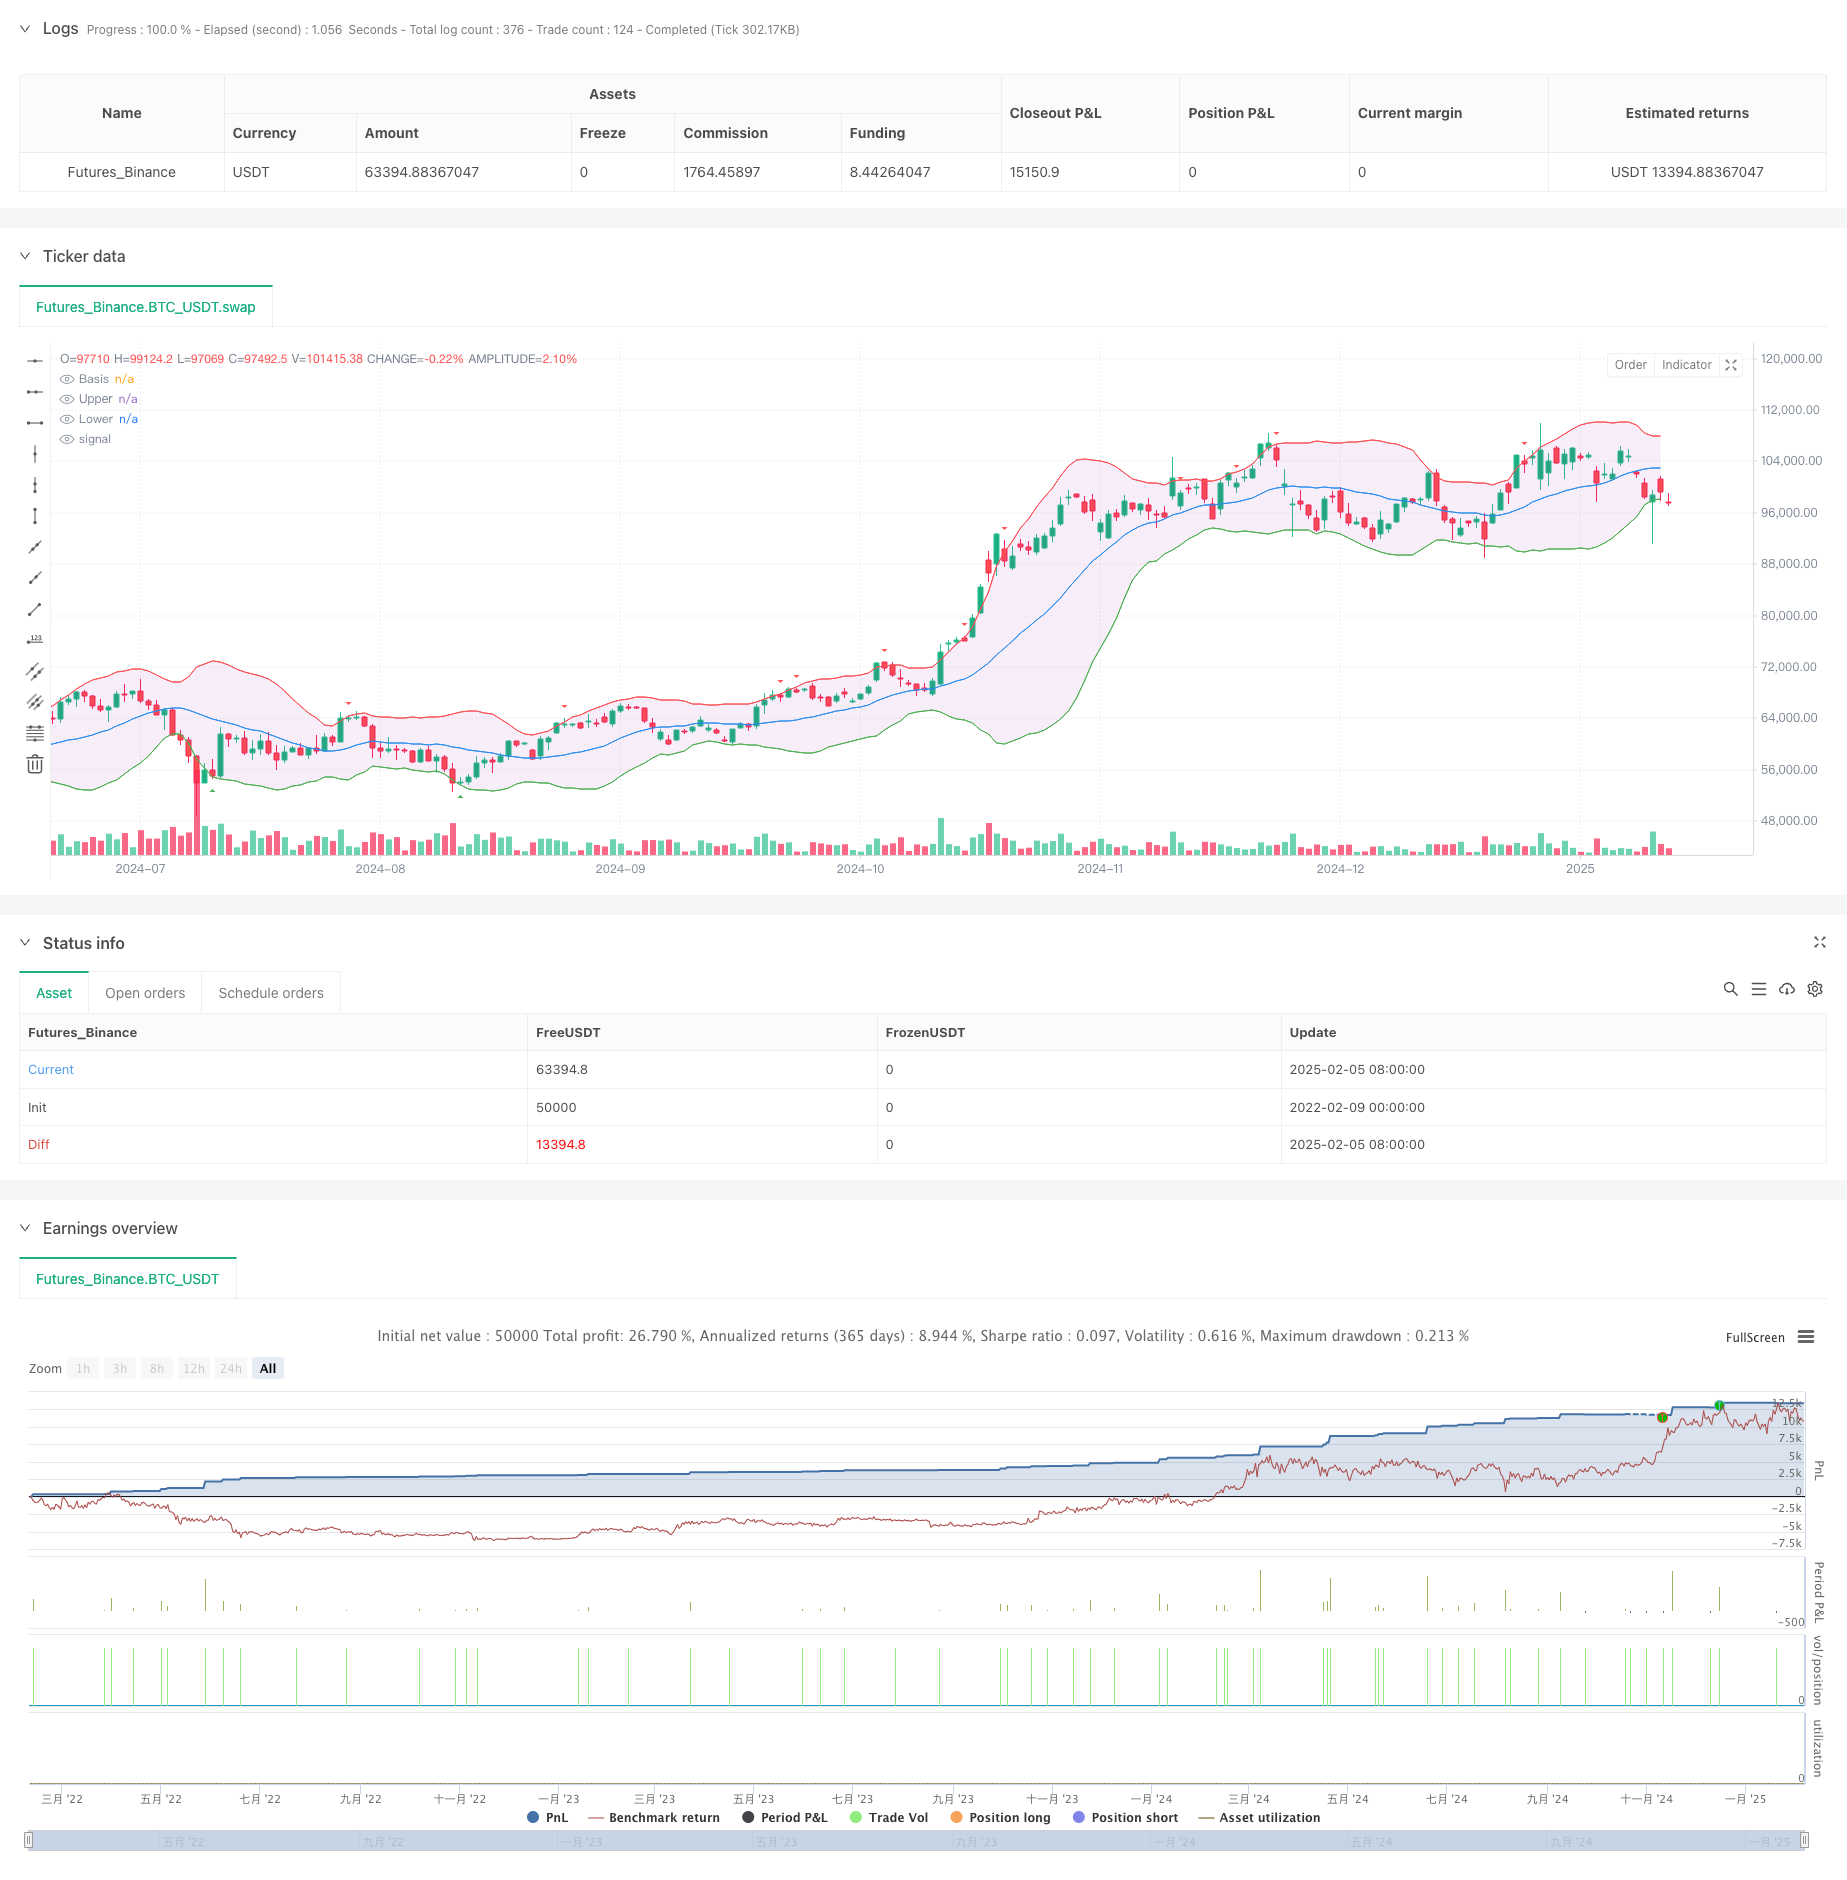
[trans]
概述
本策略是一个基于布林带(Bollinger Bands)的高级量化交易系统,结合了动态止盈止损机制。策略核心是通过布林带上下轨的突破来捕捉市场动量,同时引入了基于点数(Pips)的止盈止损来管理风险。该策略适用于各种交易品种,通过参数优化可以适应不同市场环境。
策略原理
策略主要基于以下核心原理:
- 使用20周期简单移动平均线(SMA)作为布林带的中轨,并用2倍标准差计算上下轨。
- 当价格突破下轨且收盘价位于下轨上方时,触发做多信号;当价格突破上轨且收盘价位于上轨下方时,触发做空信号。
- 采用基于点数的动态止盈止损机制,默认止损设置为10个点,止盈为20个点。
- 通过pipValue参数实现对不同交易品种的适配,使策略具有通用性。
策略优势
- 信号生成机制稳健可靠,通过收盘价确认来降低虚假信号。
- 风险管理系统完善,采用动态止盈止损来保护利润和限制损失。
- 策略参数可调性强,能够适应不同市场环境。
- 视觉化功能完善,便于交易者监控和分析。
- 考虑了实际交易成本,引入了滑点参数提高回测真实性。
策略风险
- 在震荡市场中可能产生频繁的假突破信号。
- 固定点数的止盈止损可能不适合波动性变化较大的市场。
- 参数设置不当可能导致过度交易或错过重要机会。 解决方案:
- 增加趋势过滤器来减少震荡市场的假信号
- 引入基于ATR的动态止盈止损
- 通过回测优化来确定最优参数组合
策略优化方向
- 引入市场波动率指标(如ATR)来动态调整止盈止损距离。
- 增加趋势确认指标来过滤交易信号。
- 添加交易量分析来支持入场决策。
- 实现仓位管理系统来优化资金利用效率。
- 开发自适应参数系统来适应市场状态变化。
总结
这是一个设计完善的量化交易策略,通过布林带突破捕捉市场机会,并辅以科学的风险管理系统。策略具有良好的可扩展性和适应性,通过建议的优化方向可以进一步提升其性能。适合对中长期趋势交易感兴趣的投资者使用。 ||
Overview
This strategy is an advanced quantitative trading system based on Bollinger Bands with dynamic stop-loss and take-profit mechanisms. The core idea is to capture market momentum through breakouts of Bollinger Bands while managing risk using pip-based SL/TP levels. The strategy is applicable to various trading instruments and can be adapted to different market conditions through parameter optimization.
Strategy Principles
The strategy is based on the following core principles:
- Uses a 20-period Simple Moving Average (SMA) as the middle band, with 2 standard deviations for upper and lower bands.
- Generates long signals when price breaks above the lower band and closes above it; generates short signals when price breaks below the upper band and closes below it.
- Implements dynamic SL/TP based on pips, with default settings of 10 pips for stop-loss and 20 pips for take-profit.
- Adapts to different trading instruments through the pipValue parameter, making the strategy universal.
Strategy Advantages
- Robust signal generation mechanism with confirmation through closing prices to reduce false signals.
- Comprehensive risk management system using dynamic SL/TP to protect profits and limit losses.
- Highly adjustable parameters to adapt to different market conditions.
- Complete visualization features for easy monitoring and analysis.
- Considers real trading costs with slippage parameters for more realistic backtesting.
Strategy Risks
- May generate frequent false breakout signals in ranging markets.
- Fixed pip-based SL/TP might not suit markets with varying volatility.
- Improper parameter settings may lead to overtrading or missing important opportunities. Solutions:
- Add trend filters to reduce false signals in ranging markets
- Implement ATR-based dynamic SL/TP
- Optimize parameters through backtesting
Optimization Directions
- Introduce volatility indicators (like ATR) to dynamically adjust SL/TP distances.
- Add trend confirmation indicators to filter trading signals.
- Incorporate volume analysis to support entry decisions.
- Implement position sizing system to optimize capital efficiency.
- Develop adaptive parameter system to adjust to changing market conditions.
Summary
This is a well-designed quantitative trading strategy that captures market opportunities through Bollinger Bands breakouts with scientific risk management. The strategy offers good scalability and adaptability, with potential for further performance enhancement through suggested optimizations. It is suitable for investors interested in medium to long-term trend trading.[/trans]
Source (PineScript)
/*backtest
start: 2022-02-09 00:00:00
end: 2025-02-06 08:00:00
period: 1d
basePeriod: 1d
exchanges: [{"eid":"Futures_Binance","currency":"BTC_USDT"}]
*/

//@version=5
strategy("Enhanced Bollinger Bands Strategy with SL/TP", overlay=true,
  slippage=2)

// 入力パラメータの改善
length = input.int(20, "SMA Length", minval=1)
mult = input.float(2.0, "Standard Deviation Multiplier", minval=0.001, maxval=50)
enableLong = input.bool(true, "Enable Long Positions")
enableShort = input.bool(true, "Enable Short Positions")
pipValue = input.float(0.0001, "Pip Value", step=0.00001)
slPips = input.float(10, "Stop Loss (Pips)", minval=0)
tpPips = input.float(20, "Take Profit (Pips)", minval=0)
showBands = input.bool(true, "Show Bollinger Bands")
showSignals = input.bool(true, "Show Entry Signals")

// ボリンジャーバンド計算
basis = ta.sma(close, length)
dev = mult * ta.stdev(close, length)
upper = basis + dev
lower = basis - dev

// 可視化
plot(showBands ? basis : na, "Basis", color=color.blue)
u = plot(showBands ? upper : na, "Upper", color=color.red)
l = plot(showBands ? lower : na, "Lower", color=color.green)
fill(u, l, color=color.new(color.purple, 90))

// エントリー条件の改善
longCondition = ta.crossover(close, lower) and close > lower and enableLong
shortCondition = ta.crossunder(close, upper) and close < upper and enableShort

// ポジション管理
calcSlPrice(price, isLong) => isLong ? price - slPips * pipValue : price + slPips * pipValue
calcTpPrice(price, isLong) => isLong ? price + tpPips * pipValue : price - tpPips * pipValue

// エントリー&エグジットロジック
if longCondition
    strategy.entry("Long", strategy.long, limit=lower)
    strategy.exit("Long Exit", "Long",
         stop=calcSlPrice(lower, true),
         limit=calcTpPrice(lower, true))

if shortCondition
    strategy.entry("Short", strategy.short, limit=upper)
    strategy.exit("Short Exit", "Short",
         stop=calcSlPrice(upper, false),
         limit=calcTpPrice(upper, false))

// シグナル可視化
plotshape(showSignals and longCondition, style=shape.triangleup, location=location.belowbar, color=color.green, size=size.small)
plotshape(showSignals and shortCondition, style=shape.triangledown, location=location.abovebar, color=color.red, size=size.small)
Detail
https://www.fmz.com/strategy/481110
Last Modified
2025-02-08 15:23:41