
9.8 KiB
Name
基于Z分数和超级趋势的动态交易策略多空切换系统-Z-Score-and-Supertrend-Based-Dynamic-Trading-Strategy-Long-Short-Switching-System
Author
ChaoZhang
Strategy Description
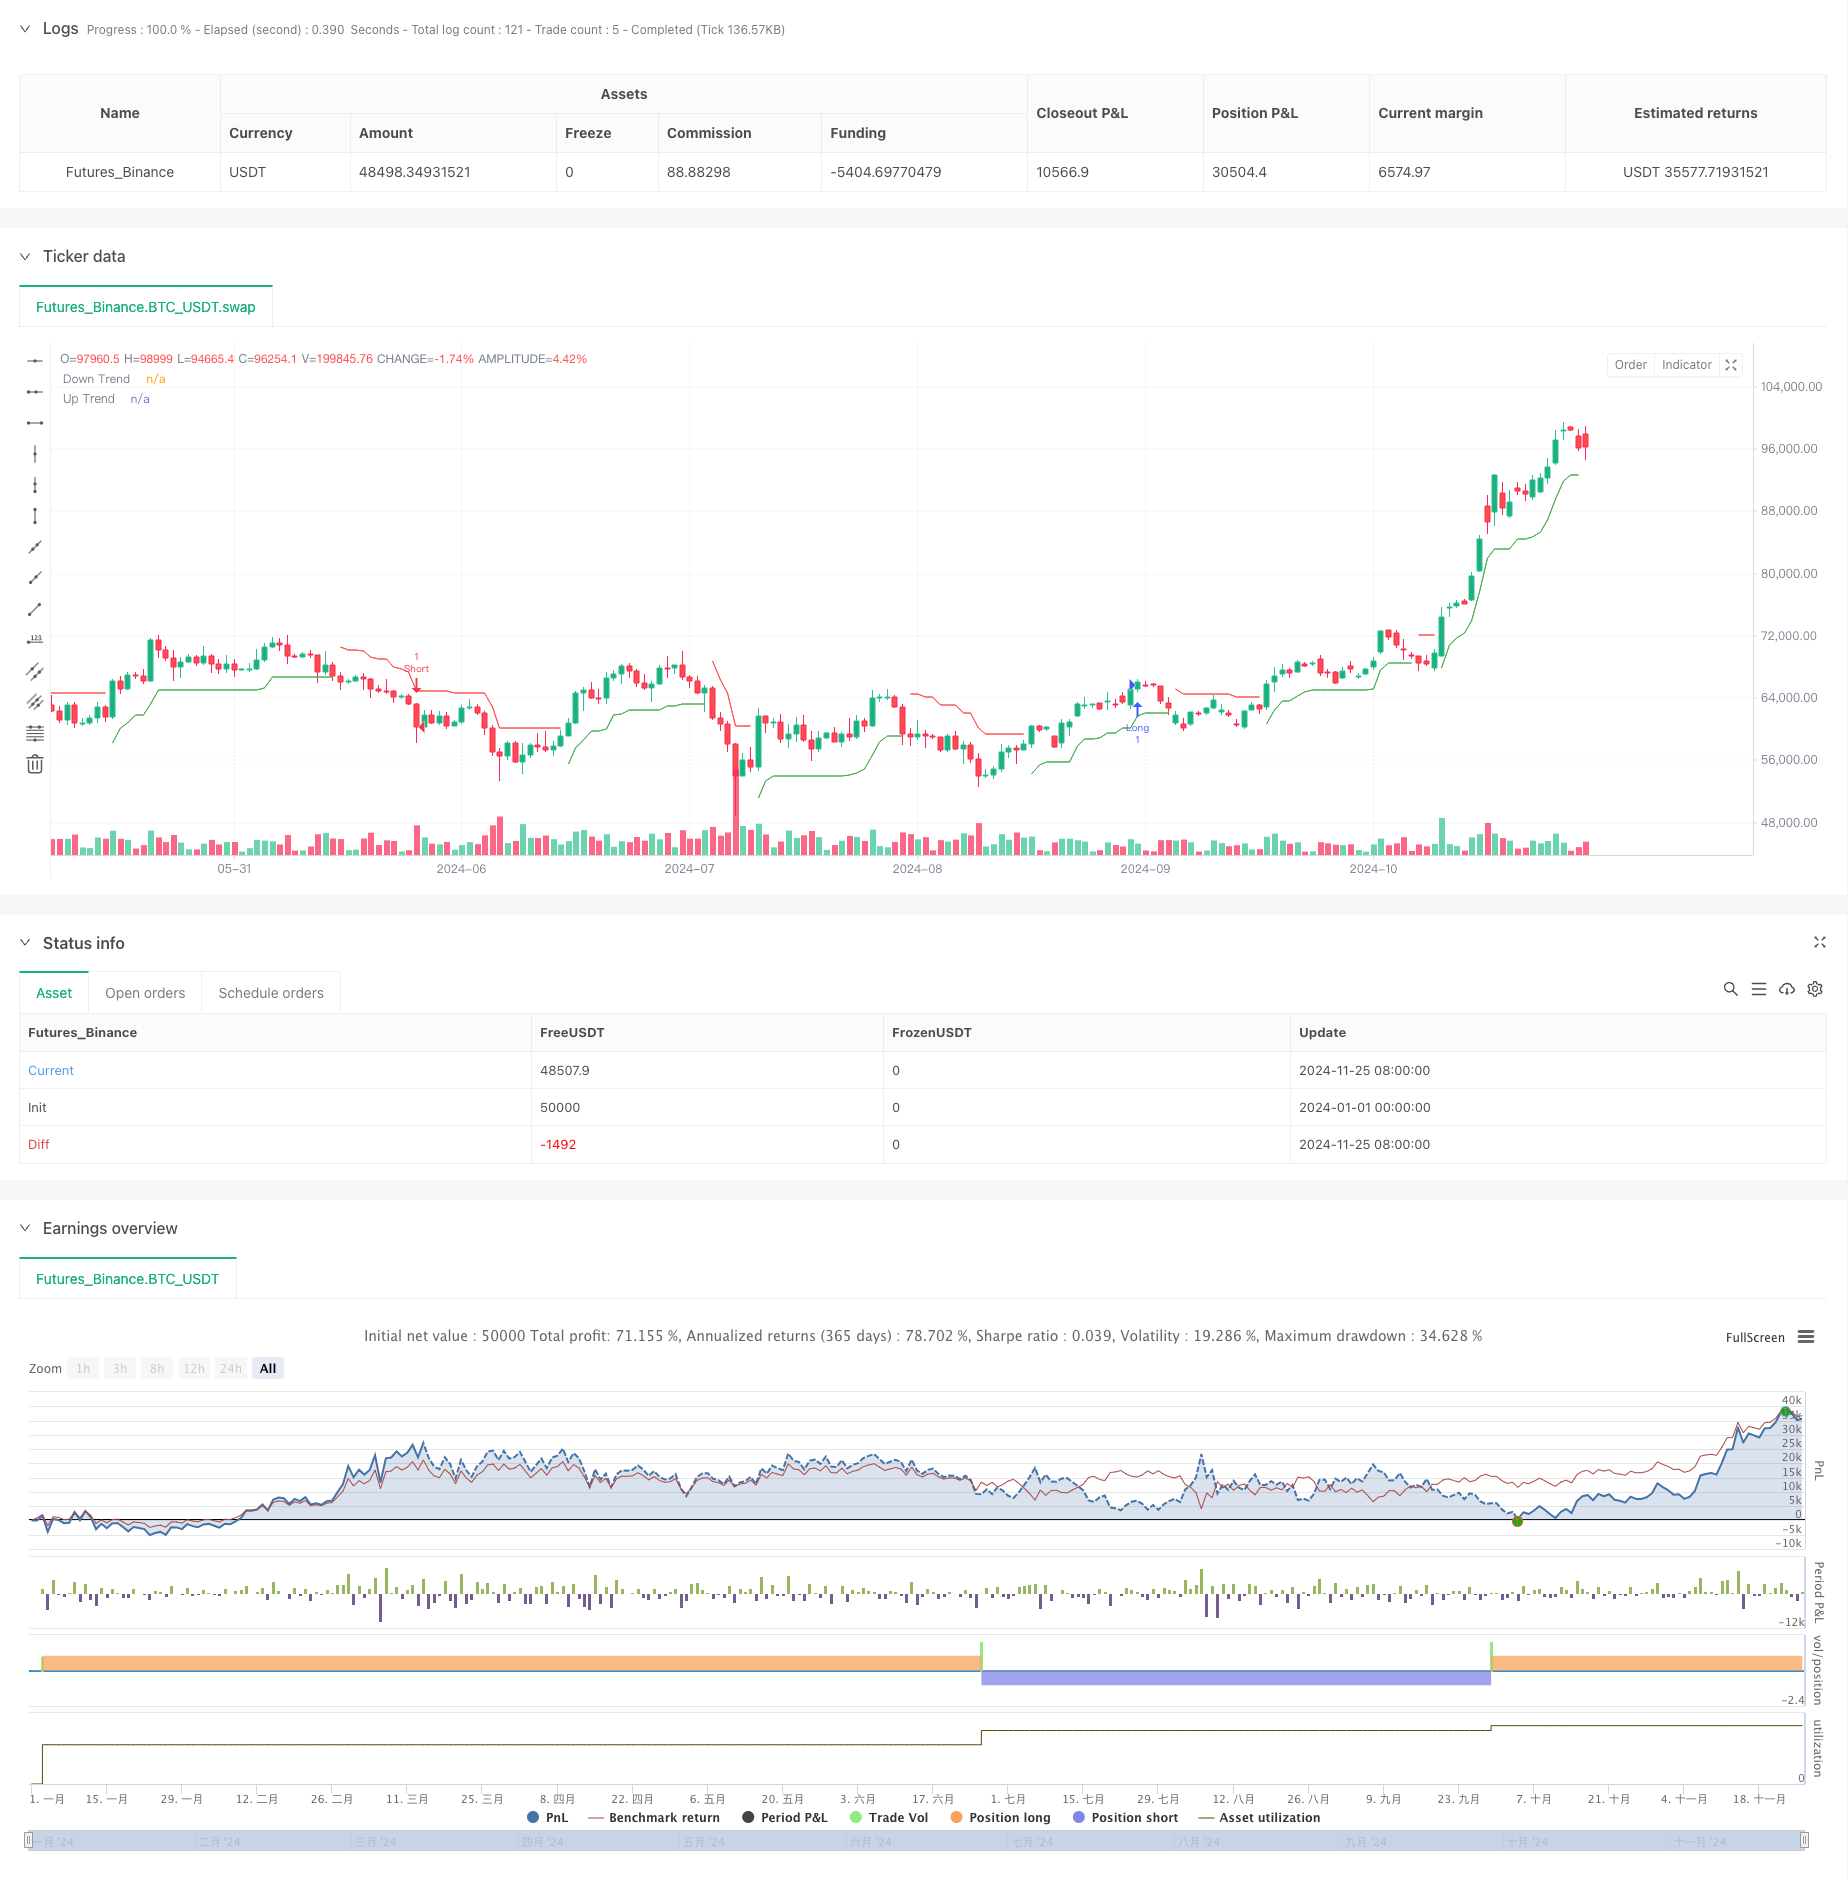
[trans]
概述
本策略是一个结合了Z分数(Z-Score)统计方法、相对强弱指标(RSI)和超级趋势(Supertrend)指标的量化交易系统。策略通过监控价格的统计偏离度,结合动量指标和趋势确认,在市场中寻找高概率的交易机会。该策略不仅能够捕捉市场的超买超卖机会,还能通过趋势确认来过滤虚假信号,实现多空双向交易。
策略原理
策略的核心逻辑建立在三个主要技术指标的协同作用上:首先,通过计算价格的Z分数来衡量当前价格相对于历史均值的偏离程度,其中使用了75周期的移动平均线和标准差。当Z分数超过1.1或低于-1.1时,表明价格出现了显著的统计偏离。其次,引入RSI指标作为动量确认,要求在开仓时RSI需要配合方向(多头时RSI>60,空头时RSI<40)。最后,使用超级趋势指标作为趋势过滤器,该指标基于11周期的ATR和2.0的乘数因子计算。只有当这三个条件同时满足时,策略才会发出交易信号。
策略优势
- 多重信号确认:通过结合统计、动量和趋势三个维度的指标,大大提高了交易信号的可靠性。
- 适应性强:Z分数的计算方法使策略能够适应不同的市场环境,而不受绝对价格水平的影响。
- 风险控制完善:超级趋势指标提供了自动的趋势跟踪和风险控制机制。
- 双向交易:策略能够在多空两个方向上捕捉机会,提高了资金利用效率。
- 信号清晰:策略使用明确的数学模型和客观的指标,避免了主观判断。
策略风险
- 滞后性风险:由于使用了多个周期的移动平均线,策略在快速变化的市场中可能出现信号滞后。
- 假突破风险:在横盘市场中,可能会出现频繁的假突破信号。
- 参数敏感性:策略的效果高度依赖于参数的选择,不同市场环境可能需要不同的参数设置。
- 市场条件依赖:在趋势不明显的市场中,策略的表现可能不够理想。
策略优化方向
- 动态参数调整:可以引入自适应参数机制,根据市场波动率自动调整Z分数阈值和超级趋势的参数。
- 增加市场环境过滤:加入市场环境识别模块,在不同的市场条件下使用不同的参数组合。
- 完善止损机制:引入动态止损策略,如基于ATR的止损或者跟踪止损。
- 优化信号过滤:可以添加成交量确认或其他技术指标来进一步过滤交易信号。
- 引入时间过滤:考虑增加交易时间窗口的限制,避开波动较大的时段。
总结
这是一个综合了统计学方法和技术分析的量化交易策略,通过多重信号确认来提高交易的可靠性。策略的核心优势在于其客观的数学模型和完善的风险控制机制,但同时也需要注意参数优化和市场适应性的问题。通过建议的优化方向,策略还有进一步提升的空间,特别是在动态适应市场环境和风险控制方面。该策略适合在波动性较大且具有明显趋势的市场中使用,对于追求稳健收益的量化交易者来说是一个值得考虑的选择。 ||
Overview
This strategy is a quantitative trading system that combines Z-Score statistical methods, Relative Strength Index (RSI), and Supertrend indicators. The strategy monitors statistical price deviations, combines momentum indicators and trend confirmation to identify high-probability trading opportunities in the market. This strategy not only captures market overbought and oversold opportunities but also filters false signals through trend confirmation, enabling two-way trading.
Strategy Principle
The core logic of the strategy is built on the synergy of three main technical indicators: First, it calculates the Z-score of prices to measure the current price's deviation from its historical mean, using a 75-period moving average and standard deviation. When the Z-score exceeds 1.1 or falls below -1.1, it indicates significant statistical deviation. Second, the RSI indicator is introduced as momentum confirmation, requiring RSI to align with the direction (RSI>60 for long positions, RSI<40 for short positions). Finally, the Supertrend indicator serves as a trend filter, calculated based on an 11-period ATR and a multiplier factor of 2.0. Trading signals are only generated when all three conditions are simultaneously satisfied.
Strategy Advantages
- Multiple Signal Confirmation: Combining indicators from statistical, momentum, and trend dimensions greatly improves the reliability of trading signals.
- High Adaptability: The Z-score calculation method allows the strategy to adapt to different market environments, independent of absolute price levels.
- Comprehensive Risk Control: The Supertrend indicator provides automatic trend following and risk control mechanisms.
- Bilateral Trading: The strategy can capture opportunities in both long and short directions, improving capital utilization efficiency.
- Clear Signals: The strategy uses clear mathematical models and objective indicators, avoiding subjective judgment.
Strategy Risks
- Lag Risk: Due to the use of multiple period moving averages, the strategy may experience signal delays in rapidly changing markets.
- False Breakout Risk: Frequent false breakout signals may occur in ranging markets.
- Parameter Sensitivity: The strategy's effectiveness highly depends on parameter selection, different market environments may require different parameter settings.
- Market Condition Dependency: The strategy's performance may not be ideal in markets without clear trends.
Strategy Optimization Directions
- Dynamic Parameter Adjustment: Introduce adaptive parameter mechanisms to automatically adjust Z-score thresholds and Supertrend parameters based on market volatility.
- Enhanced Market Environment Filtering: Add market environment recognition modules to use different parameter combinations under different market conditions.
- Improved Stop Loss Mechanism: Introduce dynamic stop-loss strategies, such as ATR-based stops or trailing stops.
- Optimized Signal Filtering: Add volume confirmation or other technical indicators to further filter trading signals.
- Time-Based Filtering: Consider adding trading time window restrictions to avoid highly volatile periods.
Summary
This is a quantitative trading strategy that combines statistical methods and technical analysis, using multiple signal confirmations to improve trading reliability. The strategy's core advantages lie in its objective mathematical model and comprehensive risk control mechanisms, while attention must be paid to parameter optimization and market adaptability. Through the suggested optimization directions, there is room for further improvement, especially in dynamically adapting to market environments and risk control. This strategy is suitable for markets with high volatility and clear trends, making it a worthy consideration for quantitative traders pursuing steady returns.[/trans]
Source (PineScript)
/*backtest
start: 2024-01-01 00:00:00
end: 2024-11-26 00:00:00
period: 1d
basePeriod: 1d
exchanges: [{"eid":"Futures_Binance","currency":"BTC_USDT"}]
*/

//@version=5
strategy("Z-Score Long and Short Strategy with Supertrend", overlay=true)

// Inputs for Z-Score
len = input.int(75, "Z-Score Lookback Length")
z_long_threshold = 1.1  // Threshold for Z-Score to open long
z_short_threshold = -1.1  // Threshold for Z-Score to open short

// Z-Score Calculation
z = (close - ta.sma(close, len)) / ta.stdev(close, len)

// Calculate Driver RSI
driver_rsi_length = input.int(14, "Driver RSI Length")  // Input for RSI Length
driver_rsi = ta.rsi(close, driver_rsi_length)  // Calculate the RSI

// Supertrend Parameters
atrPeriod = input.int(11, "ATR Length", minval=1)
factor = input.float(2.0, "Factor", minval=0.01, step=0.01)

// Supertrend Calculation
[supertrend, direction] = ta.supertrend(factor, atrPeriod)

// Conditions for Long and Short based on Z-Score
z_exceeds_long = z >= z_long_threshold and driver_rsi > 60
z_exceeds_short = z <= z_short_threshold and driver_rsi < 40

// Entry Conditions
if (z_exceeds_long and direction < 0) // Enter Long if Z-Score exceeds threshold and Supertrend is down
    strategy.entry("Long", strategy.long)
    label.new(bar_index, low, text="Open Long", style=label.style_label_up, color=color.green, textcolor=color.white, size=size.small)
    alert("Open Long", alert.freq_once_per_bar)  // Alert for Long entry

if (z_exceeds_short and direction > 0) // Enter Short if Z-Score exceeds threshold and Supertrend is up
    strategy.entry("Short", strategy.short)
    label.new(bar_index, high, text="Open Short", style=label.style_label_down, color=color.red, textcolor=color.white, size=size.small)
    alert("Open Short", alert.freq_once_per_bar)  // Alert for Short entry

// Plot Supertrend
upTrend = plot(direction < 0 ? supertrend : na, "Up Trend", color=color.green, style=plot.style_linebr)
downTrend = plot(direction > 0 ? supertrend : na, "Down Trend", color=color.red, style=plot.style_linebr)
fill(upTrend, downTrend, color=color.new(color.green, 90), fillgaps=false)

// Alert conditions for Supertrend changes (optional)
alertcondition(direction[1] > direction, title='Downtrend to Uptrend', message='The Supertrend value switched from Downtrend to Uptrend')
alertcondition(direction[1] < direction, title='Uptrend to Downtrend', message='The Supertrend value switched from Uptrend to Downtrend')
Detail
https://www.fmz.com/strategy/473141
Last Modified
2024-11-27 16:01:20