
11 KiB
Name
基于VWAP的趋势跟随策略VWAP-Trend-Following-Strategy
Author
ChaoZhang
Strategy Description
 [trans]
概述
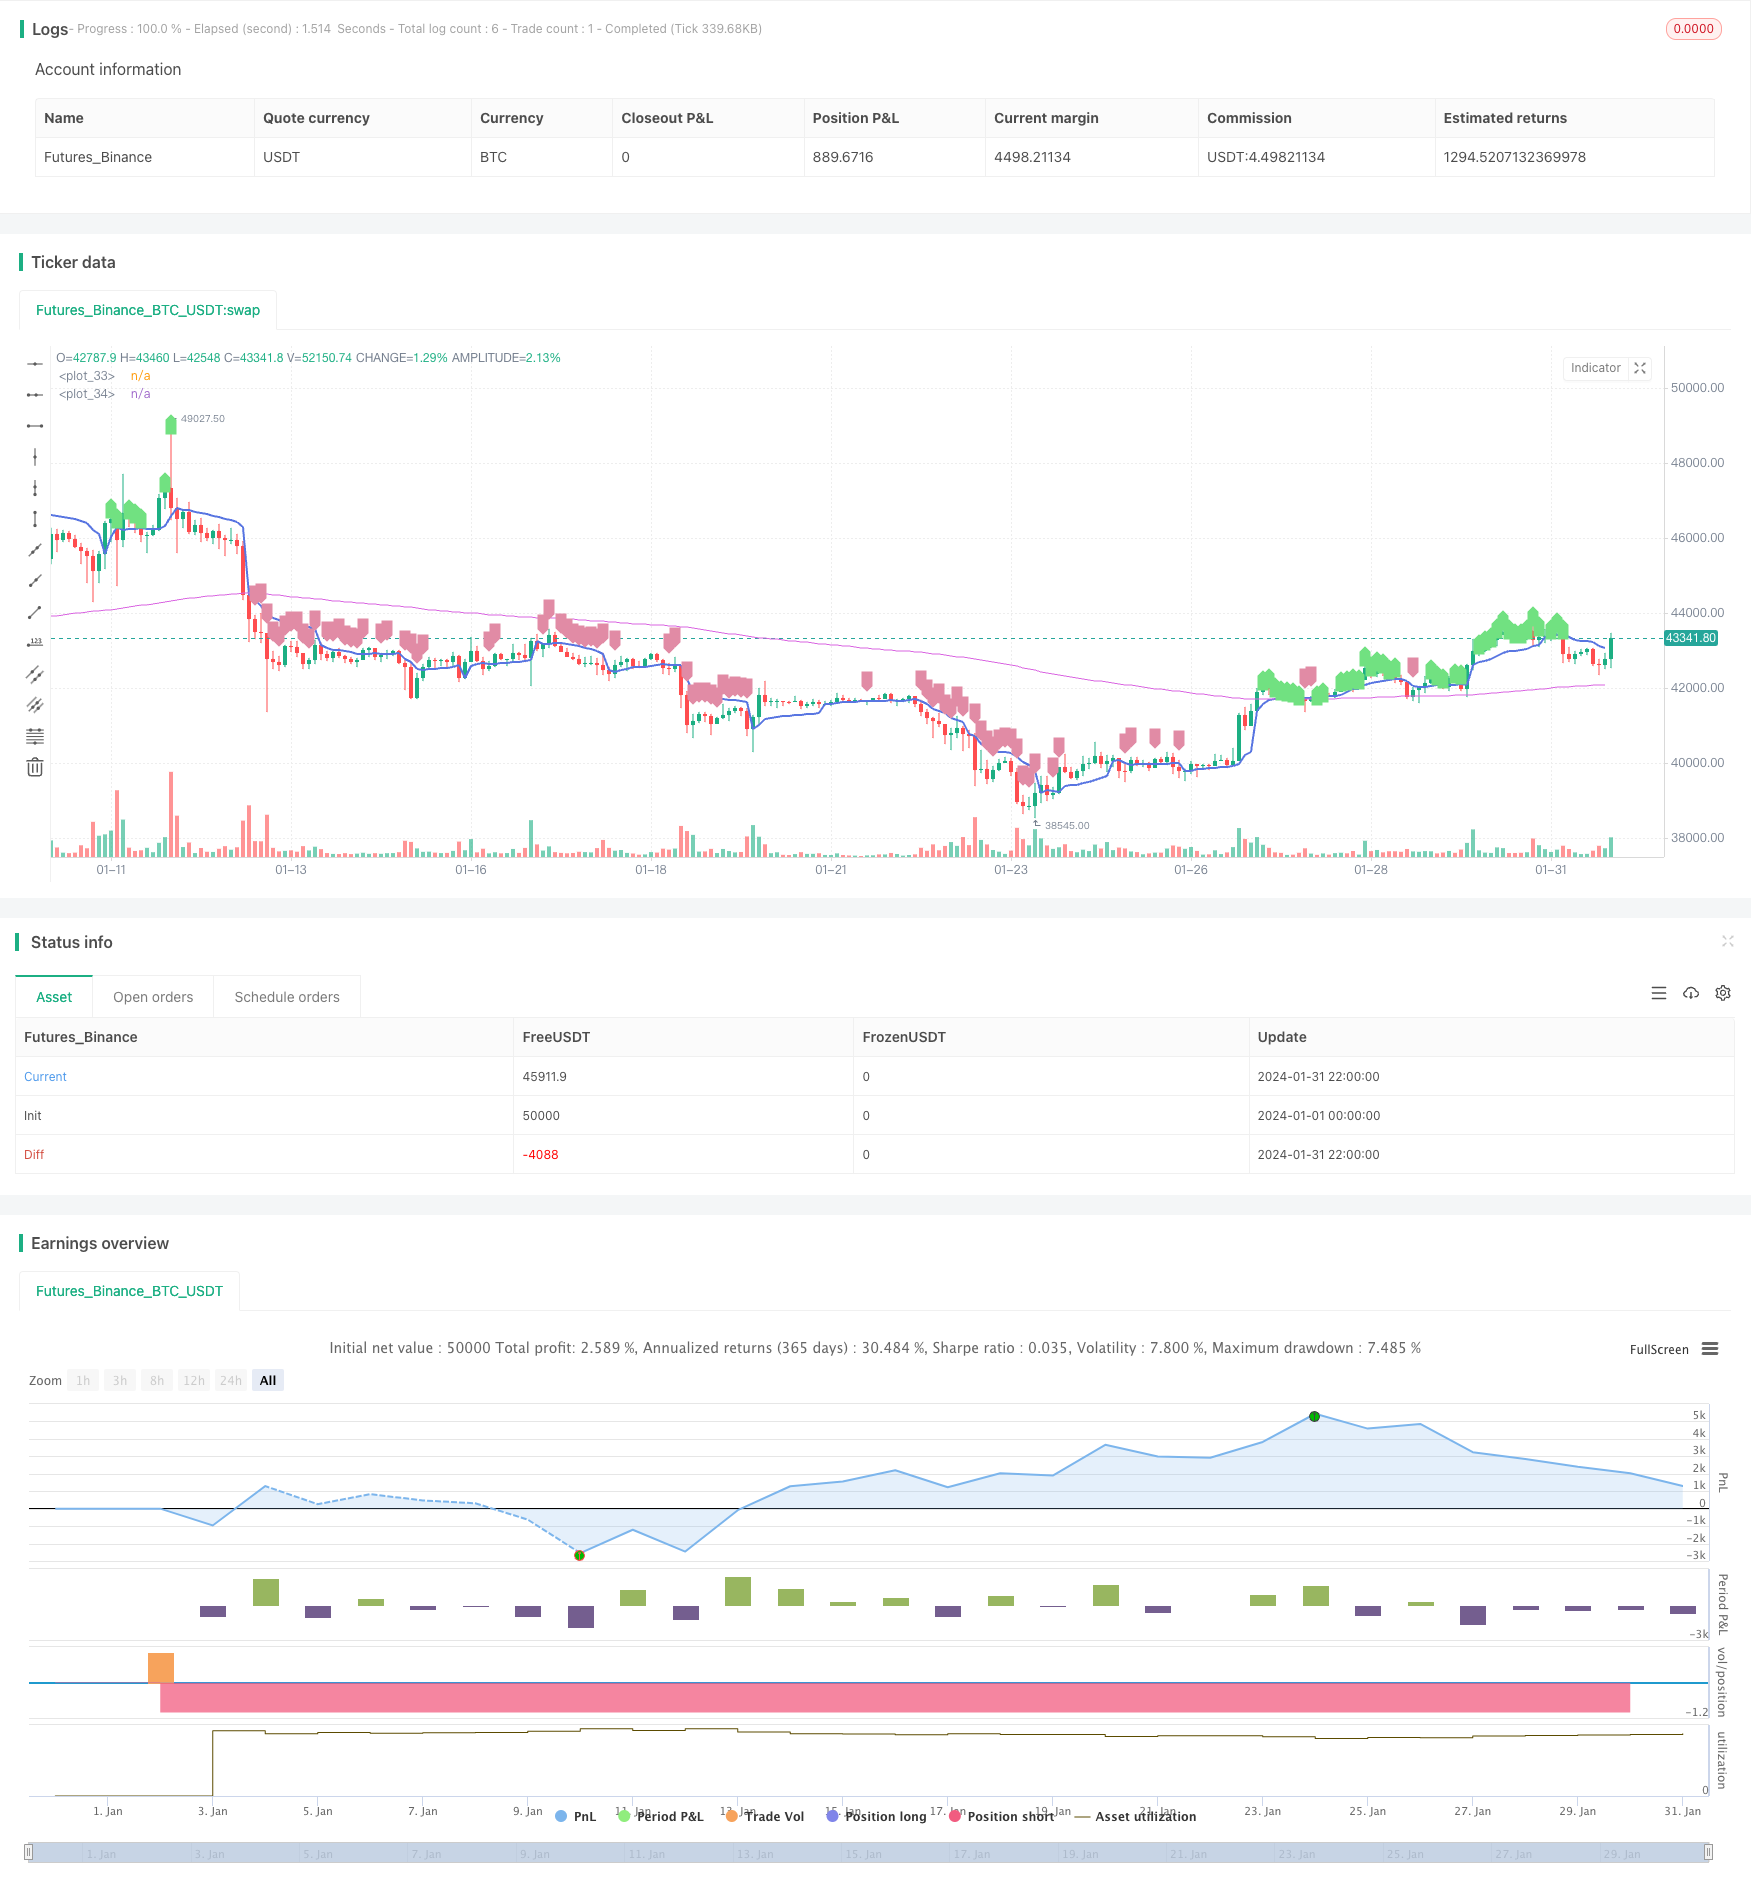
该策略基于VWAP和EMA作为判断趋势方向的指标,VWAP代表典型价格,EMA200代表中长线趋势。当价格高于VWAP和EMA200时做多,低于VWAP和EMA200时做空,属于典型的趋势跟随策略。
策略原理
策略的核心逻辑在于使用VWAP和EMA判断价格趋势。
- VWAP代表价格的典型价格,能反映市场参与者的平均成本。价格高于VWAP时代表着买方力量增加,做多;价格低于VWAP时,代表卖方的力量增强,应当做空。
- EMA200代表价格的中长线趋势走向。价格在EMA200之上代表着中长线看涨,应当做多;价格在EMA200之下时代表着中长线看跌,应当做空。
因此,该策略首先判断价格是否同时高于VWAP和EMA200,如果是则做多;如果价格同时低于VWAP和EMA200,则做空。可以看出,该策略主要依靠VWAP和EMA判断买卖决策。
此外,策略还设置了止盈止损点。做多后设置止盈为进入价的3.5%,止损为1.4%;做空后设置止盈为进入价的2.5%,止损为0.9%。这可以避免过大的亏损。
策略优势
该策略最大的优势在于利用VWAP和EMA判断趋势非常可靠。
- VWAP能准确反映市场参与者的平均成本,是判断趋势非常好的指标;
- EMA200能清晰反映中长线趋势,判断大趋势的方向十分准确可靠。
因此,结合使用VWAP和EMA判断趋势可靠性非常高。当两者判断趋势一致时,做出操作的成功率很高。
此外,设置止盈止损点,可以避免单笔亏损过大。
策略风险
该策略主要的风险在于VWAP和EMA可能发出错误信号。
- 当市场出现剧烈波动时,价格可能短期脱离VWAP,发出错误信号。
- 当新的趋势才刚刚开始时,EMA可能滞后于价格变化,使得策略错过最佳入场时机。
此外,止盈止损设置可能不当,单笔亏损过大的风险依然存在。
为解决上述问题,我们可以对VWAP和EMA的参数设置进行优化,使它们更好地判别新的趋势的开始。同时可以设置自适应的止盈止损,让止盈止损随价格波动做出调整。
策略优化方向
该策略主要可以从以下几个方面进行优化:
- 对VWAP参数进行优化,找到更稳定判断趋势的VWAP参数组合。
- 对EMA周期进行优化,找到判断趋势更准确的EMA参数。
- 增加其他判别趋势的指标,如布林带,KDJ等与VWAP和EMA组合,提高判断准确性。
- 设置自适应止盈止损。按一定规则让止盈止损水平随价格波动进行调整,避免止盈止损过于死板。
- 结合仓位管理。根据回撤、连亏次数等指标调整仓位大小,控制策略整体风险。
总结
该策略整体是一个非常可靠的趋势跟随策略。它利用VWAP和EMA判断趋势方向,思路清晰简单,当两者发出一致信号时,入场的成功概率很大。通过合理设置止盈止损,可以控制风险。我们仍然可以通过多种方式(参数优化、增加指标、自适应止盈止损、仓位管理等)来进一步完善该策略,使其业绩更加优异。
||
Overview
This strategy uses VWAP and EMA as indicators to determine the trend direction. It goes long when the price is above both VWAP and EMA200, and goes short when the price is below both VWAP and EMA200. It's a typical trend following strategy.
Strategy Logic
The core logic of the strategy lies in using VWAP and EMA to judge the price trend.
-
VWAP represents the typical price and reflects the average cost of market participants. When price is above VWAP, it means the buying power increases and should go long. When price is below VWAP, it means the selling power strengthens and should go short.
-
EMA200 represents the mid-long term trend of the price. When price is above EMA200, it means mid-long term outlook is bullish and should go long. When price is below EMA200, it means mid-long term outlook is bearish and should go short.
Therefore, this strategy first judges if the price is above both VWAP and EMA200, if yes then go long; if the price is below both VWAP and EMA200, then go short. We can see that this strategy mainly relies on VWAP and EMA to make trading decisions.
In addition, the strategy also sets take profit and stop loss points. After going long, TP is set to 3.5% of the entry price and SL is set to 1.4% of entry price. After going short, TP is 2.5% of entry price and SL is 0.9% of entry price. This avoids huge losses.
Advantages
The biggest advantage of this strategy is that using VWAP and EMA to determine trends is very reliable.
- VWAP can accurately reflect the average cost of market participants, it's a very good indicator to judge trends.
- EMA200 can clearly reflect the mid-long term trend and determine the direction of major trends very accurately.
Therefore, combining VWAP and EMA to judge trends is highly reliable. When both indicators give consistent signals, the success rate of trading is very high.
In addition, setting TP/SL avoids excessive losses per trade.
Risks
The main risk of this strategy is that VWAP and EMA may give wrong signals.
- When there is violent market fluctuation, the price may deviate from VWAP in short term and give wrong signals.
- When a new trend just begins, EMA may lag the price change and cause missing the best entry timing.
Also, improper TP/SL settings still poses the risk of excessive losses per trade.
To solve the above issues, we can optimize the parameters of VWAP and EMA to make them better in detecting the beginning of new trends. Also we can set adaptive TP/SL to adjust them according to price fluctuation.
Enhancement
The main aspects to enhance this strategy:
- Optimize VWAP parameters to find more stable settings in determining trends.
- Optimize EMA periods to find more accurate settings in judging trends.
- Add other trend indicators like Bollinger Bands, KDJ etc. to combine with VWAP and EMA, to improve accuracy.
- Set adaptive take profit and stop loss based on certain rules to adjust them dynamically according to price fluctuation.
- Incorporate position sizing based on drawdown, consecutive losses etc. to control overall risk.
Conclusion
In conclusion, this is a very reliable trend following strategy. It uses simple logic of VWAP and EMA to determine trend directions. When both indicators give consistent signals, the success rate is very high. By setting proper TP/SL, the risk can be controlled. There are still many ways (parameter optimization, adding indicators, adaptive TP/SL, position sizing etc.) to further improve this strategy and make its performance even better.
[/trans]
Strategy Arguments
| Argument | Default | Description |
|---|---|---|
| v_input_1 | 3.5 | Long Take Profit % |
| v_input_2 | 1.4 | Long Stop Loss % |
| v_input_3 | 2.5 | Short Take Profit % |
| v_input_4 | 0.9 | Short Stop Loss % |
| v_input_5 | 2019 | Backtest Start Year |
| v_input_6 | true | Backtest Start Month |
| v_input_7 | true | Backtest Start Day |
| v_input_8 | 2020 | Backtest Stop Year |
| v_input_9 | 12 | Backtest Stop Month |
| v_input_10 | 31 | Backtest Stop Day |
Source (PineScript)
/*backtest
start: 2024-01-01 00:00:00
end: 2024-01-31 23:59:59
period: 2h
basePeriod: 15m
exchanges: [{"eid":"Futures_Binance","currency":"BTC_USDT"}]
*/

//26m Binance BTCUSDTPERP
//@version=4
strategy("VWAP Trend Follower", initial_capital=100, overlay=true, commission_type=strategy.commission.percent, commission_value=0.04, default_qty_type = strategy.percent_of_equity, default_qty_value = 90, currency = currency.USD )

/// INITIALISE STRATEGY ///
price=close[1]
vprice=vwap(price)
trend=ema(price, 200)

/// RISK MANAGEMENT ///
long_tp_inp = input(3.5, title='Long Take Profit %',step=0.1)/100
long_sl_inp = input(1.4, title='Long Stop Loss %',step=0.1)/100
short_tp_inp = input(2.5, title='Short Take Profit %',step=0.1)/100
short_sl_inp = input(0.9, title='Short Stop Loss %',step=0.1)/100
long_take_level = strategy.position_avg_price * (1 + long_tp_inp)
long_stop_level = strategy.position_avg_price * (1 - long_sl_inp)
short_take_level = strategy.position_avg_price * (1 - short_tp_inp)
short_stop_level = strategy.position_avg_price * (1 + short_sl_inp)
//long_trailing = input(5, title='Trailing Stop Long',step=0.1) / 100
//short_trailing = input(5, title='Trailing Stop short',step=0.1) / 100

/// STRATEGY CONDITIONS ///
aLong= price > trend and price > vprice
entry_long = aLong and aLong[2] and aLong[1]
aShort= price < trend and price < vprice
entry_short = aShort and aShort[2] and aShort[1]
//exit_long =
//exit_short =
//entry_price_long=valuewhen(entry_long,close,0)
//entry_price_short=valuewhen(entry_short,close,0)

/// PLOTTING ///
plot(vprice,                color=#5875E1, linewidth=2)
plot(trend,                 color=#D965E1, linewidth=1)
plotshape(series=aLong,     color=#71E181,style=shape.labelup)
plotshape(series=aShort,    color=#E18BA5,style=shape.labeldown)
//plot(long_take_level,     color=#00E676, linewidth=2)
//plot(long_stop_level,     color=#FF5252, linewidth=1)
//plot(short_take_level,    color=#4CAF50, linewidth=2)
//plot(short_stop_level,    color=#FF5252, linewidth=1)

/// PERIOD ///
testStartYear   = input(2019, "Backtest Start Year")
testStartMonth  = input(1, "Backtest Start Month")
testStartDay    = input(1, "Backtest Start Day")
testPeriodStart = timestamp(testStartYear,testStartMonth,testStartDay,0,0)
testStopYear    = input(2020, "Backtest Stop Year")
testStopMonth   = input(12, "Backtest Stop Month")
testStopDay     = input(31, "Backtest Stop Day")
testPeriodStop  = timestamp(testStopYear,testStopMonth,testStopDay,0,0)
testPeriod() => true

//// STRATEGY EXECUTION ////

if testPeriod()
    if strategy.position_size == 0 or strategy.position_size > 0
        strategy.entry(id="Long", long=true, when=entry_long, comment="Long")
        strategy.exit("Take Profit/ Stop Loss","Long", limit=long_take_level, stop=long_stop_level,comment="Exit Long")//,trail_points=entry_price_long * long_trailing / syminfo.mintick, trail_offset=entry_price_long * long_trailing / syminfo.mintick)
//        strategy.close(id="Long", when=exit_long, comment = "Exit Long")

    if strategy.position_size == 0 or strategy.position_size < 0
        strategy.entry(id="Short", long=false, when=entry_short, comment = "Short")
        strategy.exit("Take Profit/ Stop Loss","Short", limit=short_take_level , stop=short_stop_level,comment = "Exit Short")//, trail_points=entry_price_short * short_trailing / syminfo.mintick, trail_offset=entry_price_short * short_trailing / syminfo.mintick)
//        strategy.close(id="Short", when=exit_short, comment = "Exit Short")
Detail
https://www.fmz.com/strategy/443141
Last Modified
2024-02-29 15:26:56