
8.5 KiB
Name
基于TD序列突破和回撤的买卖点策略-TD-Sequential-Breakout-and-Retracement-Buy-Sell-Strategy
Author
ChaoZhang
Strategy Description
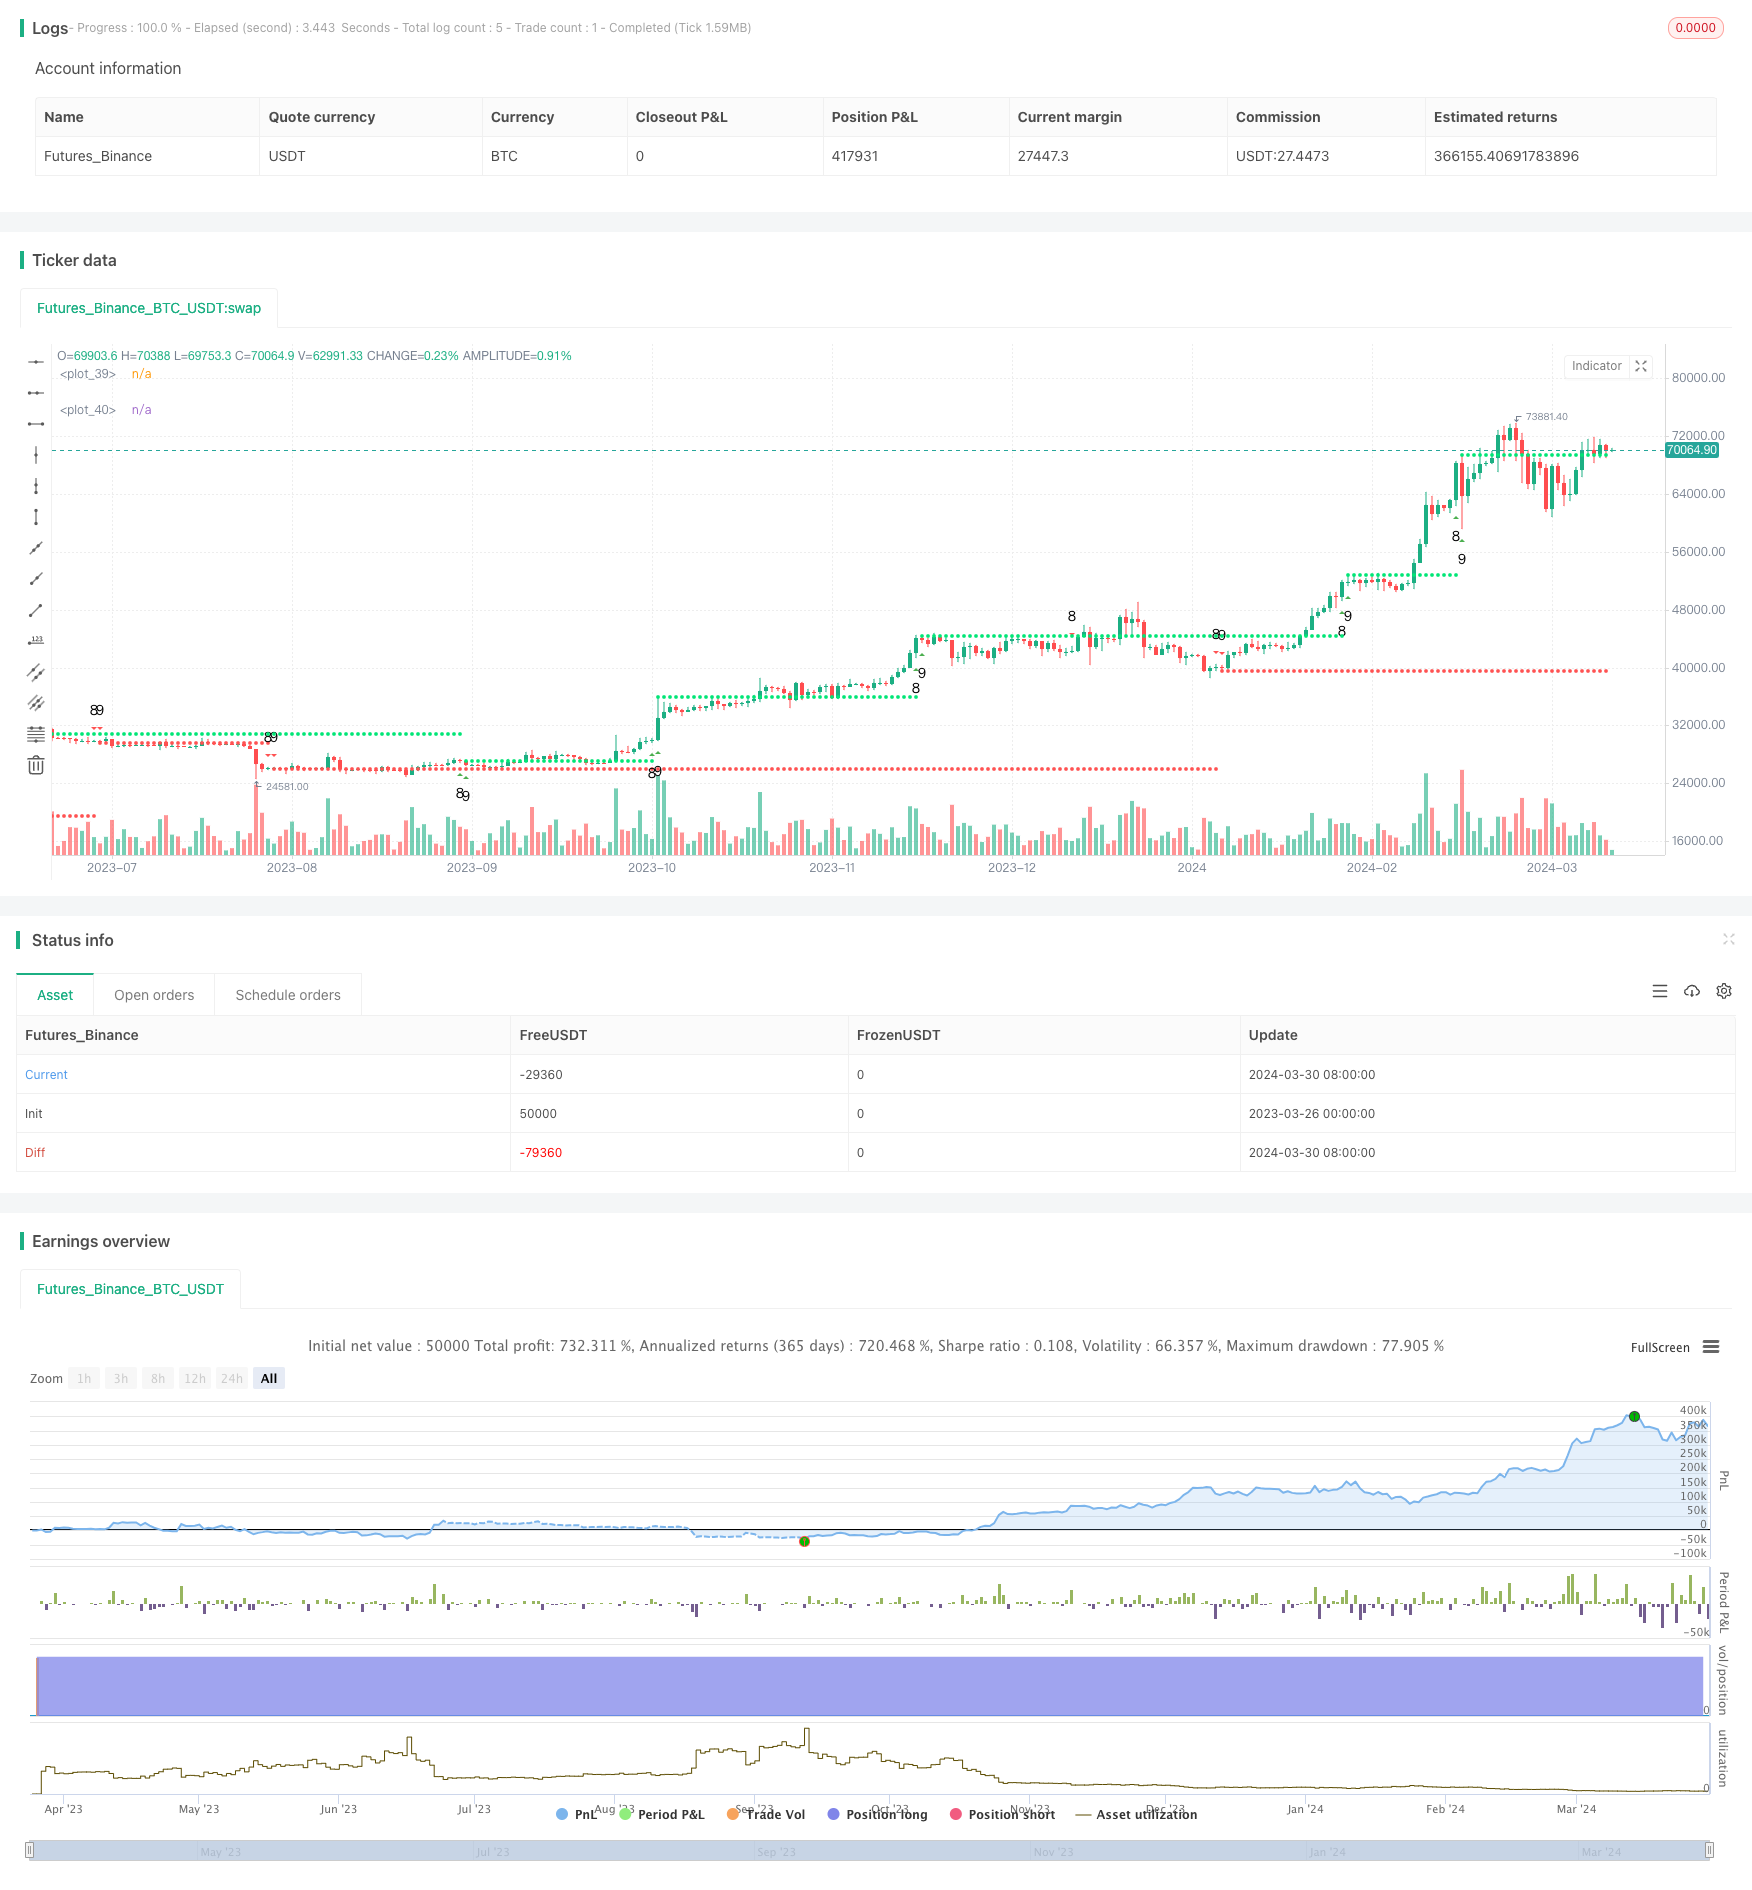 [trans]
概述
该策略是一个基于TD序列的突破和回撤买卖点策略。它通过识别TD序列中的第8根和第9根K线,来确定潜在的趋势反转点。同时,该策略还考虑了TD序列突破后的回撤情况,以提高入场点的精确度。此外,该策略还利用移动平均线作为趋势判断的辅助工具。
策略原理
- 计算TD序列:通过比较当前收盘价与4根K线前的收盘价,来判断是否出现了连续8根或9根上涨(下跌)的K线。
- 确定买卖点:当出现连续8根或9根上涨(下跌)的K线时,在第8根或第9根K线处标记潜在的卖点(买点)。
- 考虑回撤:在TD序列突破后,观察价格是否出现回撤。如果在第13、14、15或16根K线处仍然保持突破状态,则认为突破有效,否则视为无效突破。
- 趋势判断:利用10日和20日移动平均线的关系,来判断当前的趋势方向,作为买卖决策的参考。
策略优势
- 能够有效识别潜在的趋势反转点,特别是在强势趋势中,TD序列突破后的回撤入场点往往能获得较好的风险收益比。
- 通过考虑TD序列突破后的回撤情况,可以有效过滤掉一些虚假信号,提高入场点的精确度。
- 移动平均线的使用可以帮助判断当前的趋势方向,使得策略在顺势操作时更加有效。
策略风险
- 在震荡市场中,TD序列可能会出现较多的虚假信号,导致频繁交易和资金损失。
- 该策略对于参数的选择较为敏感,不同的市场环境可能需要对参数进行优化和调整。
- 策略缺乏明确的止损机制,可能会在市场出现剧烈波动时承受较大的回撤风险。
策略优化方向
- 引入更多的技术指标,如RSI、MACD等,以提高信号的可靠性和过滤效果。
- 对于TD序列突破后的回撤情况,可以考虑引入更加灵活的判断标准,如利用ATR等指标来动态调整回撤的容忍度。
- 在趋势判断方面,可以尝试使用更多的时间周期组合,如短中长期移动平均线的关系,以获得更全面的趋势判断。
- 引入明确的止损机制,如基于ATR的动态止损,以控制单笔交易的最大亏损。
总结
该策略通过TD序列和移动平均线的结合,能够有效识别潜在的趋势反转点,并通过考虑回撤情况来提高入场点的精确度。尽管策略存在一些风险和局限性,但通过引入更多的技术指标、优化趋势判断方法以及设置明确的止损机制等优化措施,可以进一步提高策略的稳健性和盈利能力。
||
Overview
This strategy is a TD Sequential-based breakout and retracement buy/sell strategy. It identifies potential trend reversal points by recognizing the 8th and 9th candles in the TD sequence. Additionally, the strategy considers the retracement after the TD sequence breakout to improve the accuracy of entry points. Moreover, it utilizes moving averages as an auxiliary tool for trend determination.
Strategy Principles
- Calculate the TD sequence: Determine whether there are 8 or 9 consecutive up (down) candles by comparing the current closing price with the closing price 4 candles ago.
- Determine buy/sell points: When there are 8 or 9 consecutive up (down) candles, mark the potential sell (buy) points at the 8th or 9th candle.
- Consider retracement: After the TD sequence breakout, observe whether the price retraces. If the breakout status is maintained at the 13th, 14th, 15th, or 16th candle, the breakout is considered valid; otherwise, it is deemed invalid.
- Trend determination: Use the relationship between the 10-day and 20-day moving averages to determine the current trend direction, which serves as a reference for buy/sell decisions.
Strategy Advantages
- Effectively identifies potential trend reversal points, especially in strong trends where retracement entry points after TD sequence breakouts often yield good risk-reward ratios.
- By considering the retracement after TD sequence breakouts, the strategy can effectively filter out some false signals and improve the accuracy of entry points.
- The use of moving averages helps determine the current trend direction, making the strategy more effective when trading in the direction of the trend.
Strategy Risks
- In choppy markets, the TD sequence may generate many false signals, leading to frequent trades and capital losses.
- The strategy is sensitive to parameter selection, and different market environments may require parameter optimization and adjustment.
- The strategy lacks a clear stop-loss mechanism and may suffer significant drawdowns when the market experiences violent fluctuations.
Strategy Optimization Directions
- Introduce more technical indicators, such as RSI and MACD, to improve signal reliability and filtering effects.
- For retracements after TD sequence breakouts, consider introducing more flexible judgment criteria, such as using indicators like ATR to dynamically adjust the tolerance for retracements.
- In terms of trend determination, try using more time period combinations, such as the relationship between short-, medium-, and long-term moving averages, to obtain a more comprehensive trend judgment.
- Introduce a clear stop-loss mechanism, such as dynamic stop-loss based on ATR, to control the maximum loss per trade.
Summary
By combining TD sequences and moving averages, this strategy can effectively identify potential trend reversal points and improve the accuracy of entry points by considering retracement situations. Although the strategy has some risks and limitations, it can be further enhanced in terms of robustness and profitability by introducing more technical indicators, optimizing trend determination methods, and setting clear stop-loss mechanisms. [/trans]
Strategy Arguments
| Argument | Default | Description |
|---|---|---|
| v_input_1 | true | Numbers |
| v_input_2 | true | SR |
Source (PineScript)
/*backtest
start: 2023-03-26 00:00:00
end: 2024-03-31 00:00:00
period: 1d
basePeriod: 1h
exchanges: [{"eid":"Futures_Binance","currency":"BTC_USDT"}]
*/

//@version=4
strategy("Dipak Shankarrao Chavhan", shorttitle="Dipak Chavhan", overlay=true, pyramiding=0, default_qty_value=10)
Numbers = input(true)
SR = input(true)

var int TD = 0
var int TS = 0
var int TDUp = 0
var int TDDn = 0

TD := close > close[4] ? TD[1] + 1 : 0
TS := close < close[4] ? TS[1] + 1 : 0
TDUp := TD - valuewhen(TD < TD[1], TD, 1)
TDDn := TS - valuewhen(TS < TS[1], TS, 1)

plotshape(Numbers ? (TDUp == 8 ? true : na) : na, style=shape.triangleup, text="8", color=color.new(color.green, 0), location=location.belowbar)
plotshape(Numbers ? (TDUp == 9 ? true : na) : na, style=shape.triangleup, text="9", color=color.new(color.green, 0), location=location.belowbar)
plotshape(Numbers ? (TDDn == 8 ? true : na) : na, style=shape.triangledown, text="8", color=color.new(color.red, 0), location=location.abovebar)
plotshape(Numbers ? (TDDn == 9 ? true : na) : na, style=shape.triangledown, text="9", color=color.new(color.red, 0), location=location.abovebar)

priceflip = barssince(close < close[4])
sellsetup = close > close[4] and priceflip
sell = sellsetup and barssince(priceflip != 9)
sellovershoot = sellsetup and barssince(priceflip != 13)
sellovershoot1 = sellsetup and barssince(priceflip != 14)
sellovershoot2 = sellsetup and barssince(priceflip != 15)
sellovershoot3 = sellsetup and barssince(priceflip != 16)
priceflip1 = barssince(close > close[4])
buysetup = close < close[4] and priceflip1
buy = buysetup and barssince(priceflip1 != 9)
buyovershoot = buysetup and barssince(priceflip1 != 13)
buyovershoot1 = buysetup and barssince(priceflip1 != 14)
buyovershoot2 = buysetup and barssince(priceflip1 != 15)
buyovershoot3 = buysetup and barssince(priceflip1 != 16)
TDbuyh = valuewhen(buy, high, 0)
TDbuyl = valuewhen(buy, low, 0)
TDsellh = valuewhen(sell, high, 0)
TDselll = valuewhen(sell, low, 0)
plot(SR ? (TDbuyh ? TDbuyl : na) : na, style=plot.style_circles, linewidth=2, color=color.red)
plot(SR ? (TDselll ? TDsellh : na) : na, style=plot.style_circles, linewidth=2, color=color.lime)

sma1 = sma(close, 10)
sma2 = sma(close, 20)


if TDbuyh
    strategy.entry("Enter Long", strategy.long)
else if TDselll
    strategy.entry("Enter Short", strategy.short)
Detail
https://www.fmz.com/strategy/446760
Last Modified
2024-04-01 11:23:26