
12 KiB
Name
基于SuperTrend和Fisher变换的趋势跟随长线策略Trend-Following-Long-Term-Strategy-Based-on-SuperTrend-and-Fisher-Transform
Author
ChaoZhang
Strategy Description
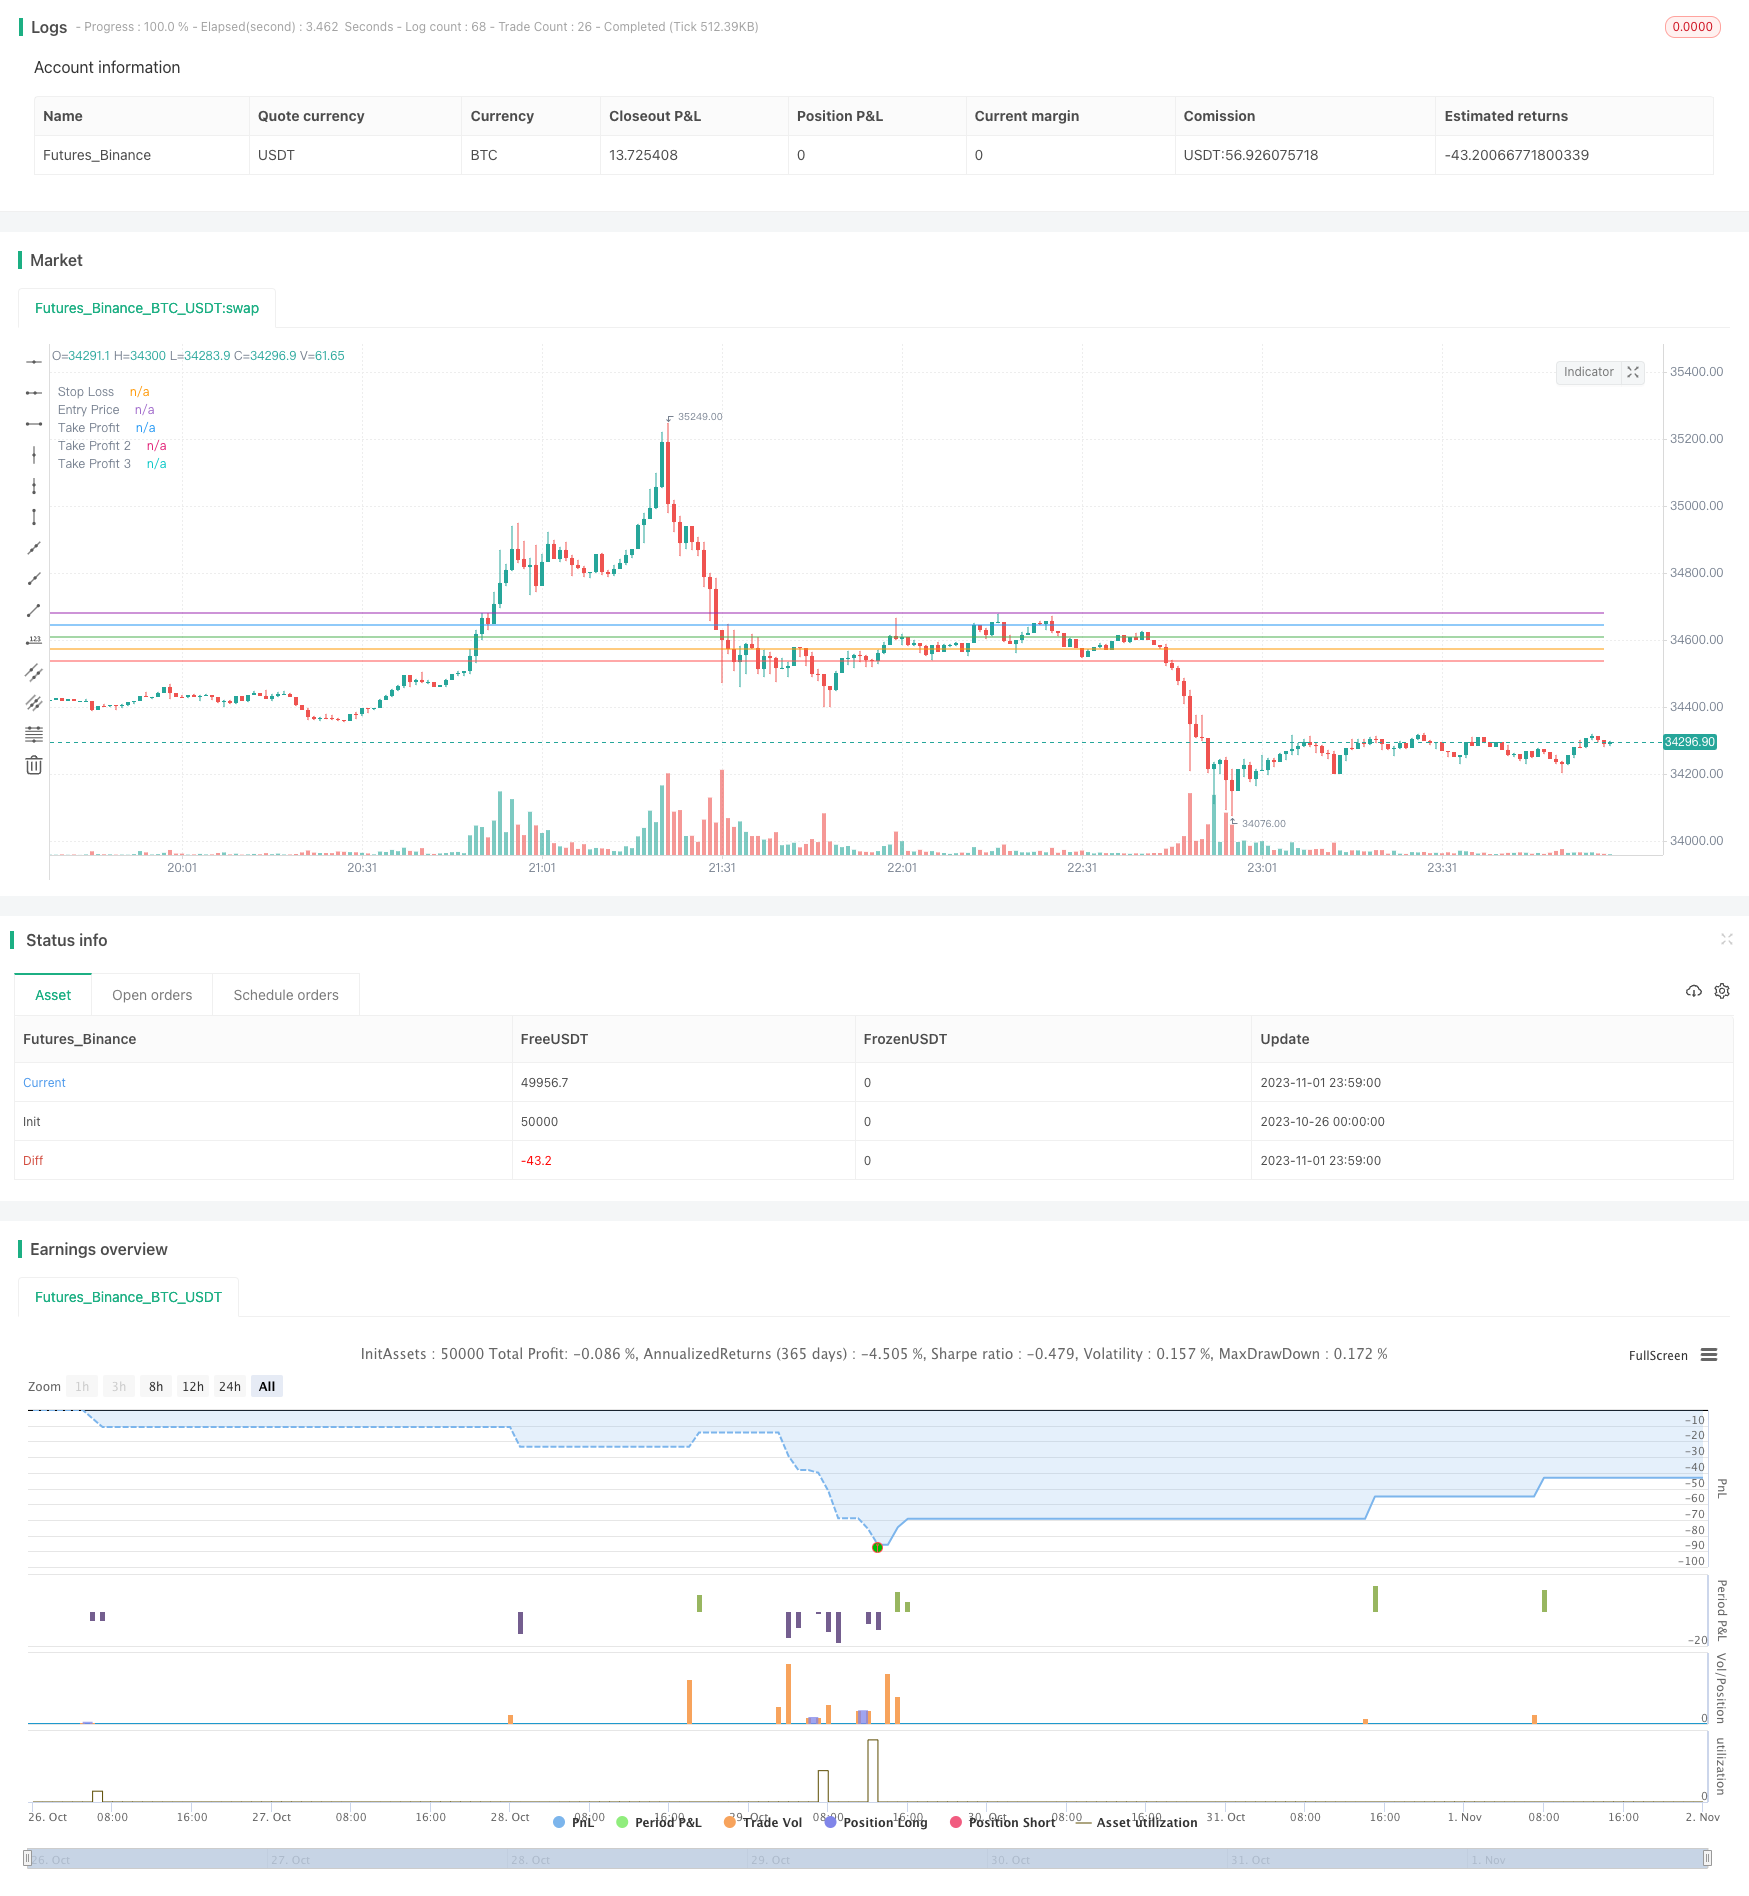 [trans]
概述
该策略融合了SuperTrend和Fisher变换两个指标,实现了一种较为稳定的趋势跟随长线交易策略。当SuperTrend指标发出买入信号,同时Fisher变换指标小于-2.5且上升时,产生买入信号。策略以合理的止损和止盈方式进行持仓管理。
策略原理
-
SuperTrend指标用于判断价格趋势方向。当价格上穿上轨时,为看涨信号;当价格下穿下轨时,为看跌信号。本策略在SuperTrend为看涨时发出买入信号。
-
Fisher变换指标反映价格波动对消费者心理的影响程度。Fisher值在(-2.5, 2.5)区间代表市场neutral,小于-2.5代表市场panic,大于2.5代表市场euphoria。本策略在Fisher小于-2.5且上升时发出买入信号,以捕捉panic到neutral的转折点。
-
策略以合理止损止盈来管理仓位。止损点设置为入场价减去ATR值与ATR倍数的乘积,止盈点设置为入场价加上ATR值与ATR倍数的乘积。止损幅度大于止盈幅度,体现趋势跟随策略的风险控制思想。
-
同时考虑了风险金额管理。根据ATR和风险金额计算头寸规模,使每单位风险不超过设置的风险金额。
优势分析
-
多指标结合,避免单一指标造成交易频繁。SuperTrend判断趋势方向,Fisher变换判断市场心理面,两者结合形成稳定的交易信号。
-
设置合理止损止盈,有利于把握趋势进行长线持有,同时控制风险。
-
采用风险金额管理和最小交易单位,使每笔交易风险可控,避免超过承受能力的大额损失。
-
交易信号稳定,适合长线持有。Fisher变换是平滑指标,有助于过滤市场噪音,避免假信号。
-
指标参数优化空间大。可以根据不同品种不同周期调整SuperTrend的ATR周期和乘数参数,以及Fisher变换的平滑参数,寻找最佳参数组合。
风险分析
-
作为趋势跟随策略,在震荡盘整阶段将积累小额损失。应选择趋势明显的品种和周期运行策略。
-
Fisher变换对极端情况效果不佳。当市场长期维持某一状态时,Fisher值会持续偏离中性区间,此时应暂停策略。
-
止损点过近可能造成过频退出。应合理设置ATR周期和ATR倍数参数,确保止损距离有一定缓冲区间。
-
忽略交易成本会导致小额获利交易亏损。应考虑品种的交易费用水平,适当调整止盈幅度。
-
需长时间参与市场才能体现策略优势。应确保有足够资金支持长线交易,且心态稳定。
优化方向
-
调整ATR周期和ATR倍数参数,优化止损止盈幅度。可以通过回测数据优化参数,也可以动态优化。
-
尝试不同的Fisher变换参数,如平滑周期,寻找更稳定的交易信号。可以结合市场波动率动态调整参数。
-
结合其他指标作为过滤器,避免大盘不确定时的错误交易。可采用均线、波动率等判断大盘走势。
-
测试不同止盈策略,如移动止盈、分批止盈、ATR尾随止盈等,提高盈利能力。
-
优化资金管理策略,如固定比例资金管理、凯利公式等,使盈亏比更高。
-
针对交易费用进行优化,确保小额持仓交易后保持盈利。
总结
该策略整合SuperTrend和Fisher变换等指标优势,形成稳定的趋势跟随长线交易策略。通过止损止盈管理和风险控制,能获得较好的风险回报率。策略有待进一步优化参数、过滤信号、资金管理等方面,以获得更强的实盘表现。但整体思路稳健,值得实盘验证和持续优化。如果管理停利和风险的心态,该策略有望获得稳定的长线收益。
||
Overview
This strategy combines the SuperTrend and Fisher Transform indicators to implement a relatively stable trend following long term trading strategy. It generates buy signals when the SuperTrend indicator gives a buy signal and the Fisher Transform indicator drops below -2.5 and rises. The strategy manages positions properly with stop loss and take profit.
Strategy Logic
-
The SuperTrend indicator is used to determine the direction of the price trend. When the price crosses above the upper band, it is a bullish signal; when the price crosses below the lower band, it is a bearish signal. This strategy issues a buy signal when the SuperTrend is bullish.
-
The Fisher Transform indicator reflects the impact of price fluctuations on consumer psychology. Fisher values between (-2.5, 2.5) represent a neutral market, below -2.5 represents a panicked market, and above 2.5 represents a euphoric market. This strategy issues a buy signal when the Fisher is below -2.5 and rising, to capture the turning point from panic to neutral.
-
The strategy manages positions properly with stop loss and take profit. The stop loss is set at the entry price minus the ATR value multiplied by the ATR multiplier, and take profit is set at the entry price plus the ATR value multiplied by the ATR multiplier. The stop loss amplitude is greater than the take profit amplitude, reflecting the risk control idea of the trend following strategy.
-
It also considers risk amount management. Calculate the position size based on ATR and risk amount so that the risk per unit does not exceed the set risk amount.
Advantage Analysis
-
Combining multiple indicators avoids frequent trading caused by a single indicator. SuperTrend determines trend direction and Fisher Transform determines market psychology to form stable trading signals.
-
Setting proper stop loss and take profit is conducive to capturing trends for long-term holding, while controlling risks.
-
Using risk amount management and minimum tick size makes the risk of each trade controllable, avoiding large losses beyond affordability.
-
Trading signals are stable and suitable for long-term holding. Fisher Transform is a smooth indicator, which helps filter market noise and avoid false signals.
-
Large optimization space for indicator parameters. SuperTrend's ATR period and multiplier, and Fisher's smoothness can be adjusted according to different products and timeframes to find the optimal parameter combination.
Risk Analysis
-
As a trend following strategy, it will accumulate small losses during range-bound periods. Products and timeframes with obvious trends should be selected.
-
Fisher Transform is not effective for extreme situations. When the market stays in one state for a long time, Fisher values will continue to deviate from the neutral zone, in which case the strategy should be suspended.
-
A stop loss too close may cause premature exit. The ATR period and ATR multiplier should be set reasonably to ensure sufficient buffer for the stop loss.
-
Ignoring transaction costs will cause profitable trades to lose money. The transaction costs of the product should be considered and take profit adjusted accordingly.
-
It takes long-time market participation for the strategy to realize its advantage. Ensure sufficient capital to support long-term trading and keep a stable mindset.
Optimization Directions
-
Adjust ATR period, ATR multiplier to optimize stop loss and take profit. Optimize via backtesting or dynamically.
-
Try different Fisher parameters like smooth period to find more stable trading signals. Can dynamically adjust based on market volatility.
-
Add other indicators as filters to avoid wrong trades when the market is uncertain. Judge the market trend using MA, volatility etc.
-
Test different take profit strategies like moving, partial, ATR trailing, etc. to improve profitability.
-
Optimize capital management strategies like fixed fractional, Kelly formula etc. to increase return/risk ratio.
-
Optimize for transaction costs, keep profitable for small positions.
Conclusion
This strategy integrates the advantages of SuperTrend, Fisher Transform and other indicators to form a stable trend following long term trading strategy. Through stop loss, take profit and risk management, it can achieve good risk reward ratio. The strategy needs further optimization on parameters, signal filtering, capital management etc. to improve practical performance. But the overall logic is robust and worth practical verification and continuous optimization. If managing take profit and risk mindset properly, the strategy has the potential to achieve steady long term returns.
[/trans]
Strategy Arguments
| Argument | Default | Description |
|---|---|---|
| v_input_int_1 | 10 | Length |
| v_input_1 | 10 | ATR Period |
| v_input_2_hl2 | 0 | Source: hl2 |
| v_input_float_1 | 2 | ATR Multiplier |
| v_input_float_2 | 10 | Risk Amount ($) |
| v_input_3 | true | Change ATR Calculation Method ? |
Source (PineScript)
/*backtest
start: 2023-10-26 00:00:00
end: 2023-11-02 00:00:00
period: 1m
basePeriod: 1m
exchanges: [{"eid":"Futures_Binance","currency":"BTC_USDT"}]
*/

//@version=5
strategy("Supertrend and Fisher_LONG", overlay=true)

//This block is for  Fisher Transformation Calculation.
len = input.int(10, minval=1, title="Length") // Length is optional. 10 is good but is up to you.
high_ = ta.highest(hl2, len)
low_ = ta.lowest(hl2, len)
round_(val) => val > .99 ? .999 : val < -.99 ? -.999 : val
value = 0.0
value := round_(.66 * ((hl2 - low_) / (high_ - low_) - .5) + .67 * nz(value[1]))
fish1 = 0.0
fish1 := .5 * math.log((1 + value) / (1 - value)) + .5 * nz(fish1[1])
fish2 = fish1[1]

// Buy condition for Fisher transformation.
buy_signal = (fish1 < -2.5) and (fish1 > fish2)
durum = 0 //just for the situation.

if (buy_signal)
    durum := 1 // now it changes from 0 to 1.

// Supertrend indicator inputs and calculations (same as in the indicator)
Periods = input(title='ATR Period', defval=10) // period is 10, but you can change it
src = input(hl2, title='Source')
Multiplier = input.float(title='ATR Multiplier', step=0.1, defval=2) //atr multiplier is important. it is 2 for this strategy but you can find another for best performance
RiskAmount = input.float(title='Risk Amount ($)', defval=10.0, minval=0.0, step=1.0) // ıf you use risk-reward method, risk is 10$ for each position. you can also change it
changeATR = input(title='Change ATR Calculation Method ?', defval=true)

atr2 = ta.sma(ta.tr, Periods)
atr = changeATR ? ta.atr(Periods) : atr2
up = src - Multiplier * atr
up1 = nz(up[1], up)
up := close[1] > up1 ? math.max(up, up1) : up
dn = src + Multiplier * atr
dn1 = nz(dn[1], dn)
dn := close[1] < dn1 ? math.min(dn, dn1) : dn
trend = 1
trend := nz(trend[1], trend)
trend := trend == -1 and close > dn1 ? 1 : trend == 1 and close < up1 ? -1 : trend

// Calculate position size based on risk amount
riskPerContract = atr * Multiplier
contracts = RiskAmount / (riskPerContract * syminfo.mintick)

//short signal condition
buySignal = trend == 1 and trend[1] == -1 and durum == 1

plotshape(buySignal, title='Buy Signal', location=location.belowbar, color=color.green, style=shape.triangleup, size=size.small)

// variables
var float entryPrice = na
var float stopLoss = na
var float takeProfit = na
var float atr1 = na
var float takeProfit2 = na
var float takeProfit3 = na

//it calculates the stop level and reward profit levels using atr.
if (buySignal)
    entryPrice := close
    atr1 := atr
    stopLoss := entryPrice - atr1 * Multiplier
    contracts := entryPrice / (entryPrice - stopLoss) * RiskAmount / entryPrice
    takeProfit := entryPrice + atr1 * Multiplier
    takeProfit2 := entryPrice + 2 * atr1 * Multiplier
    takeProfit3 := entryPrice + 3 * atr1 * Multiplier

if (buySignal)
    strategy.entry("Buy", strategy.long, qty=contracts)

//
if (close <= stopLoss)
    strategy.close("Buy", comment="Stop Loss Hit")
else if (close >= takeProfit)
    strategy.close("Buy", comment="Take Profit Hit")

// draw the stop, entry and profit levels
plot(stopLoss, title="Stop Loss", color=color.red, linewidth=1, style=plot.style_linebr)
plot(entryPrice, title="Entry Price", color=color.orange, linewidth=1, style=plot.style_linebr)
plot(takeProfit, title="Take Profit", color=color.green, linewidth=1, style=plot.style_linebr)
plot(takeProfit2, title="Take Profit 2", color=color.blue, linewidth=1, style=plot.style_linebr)
plot(takeProfit3, title="Take Profit 3", color=color.purple, linewidth=1, style=plot.style_linebr)
Detail
https://www.fmz.com/strategy/430988
Last Modified
2023-11-03 15:42:16