
7.8 KiB
Name
基于Stochastic-RSI的数字货币交易策略Stochastic-RSI-Strategy-for-Cryptocurrency-Trading
Author
ChaoZhang
Strategy Description
 [trans]
一、策略概述
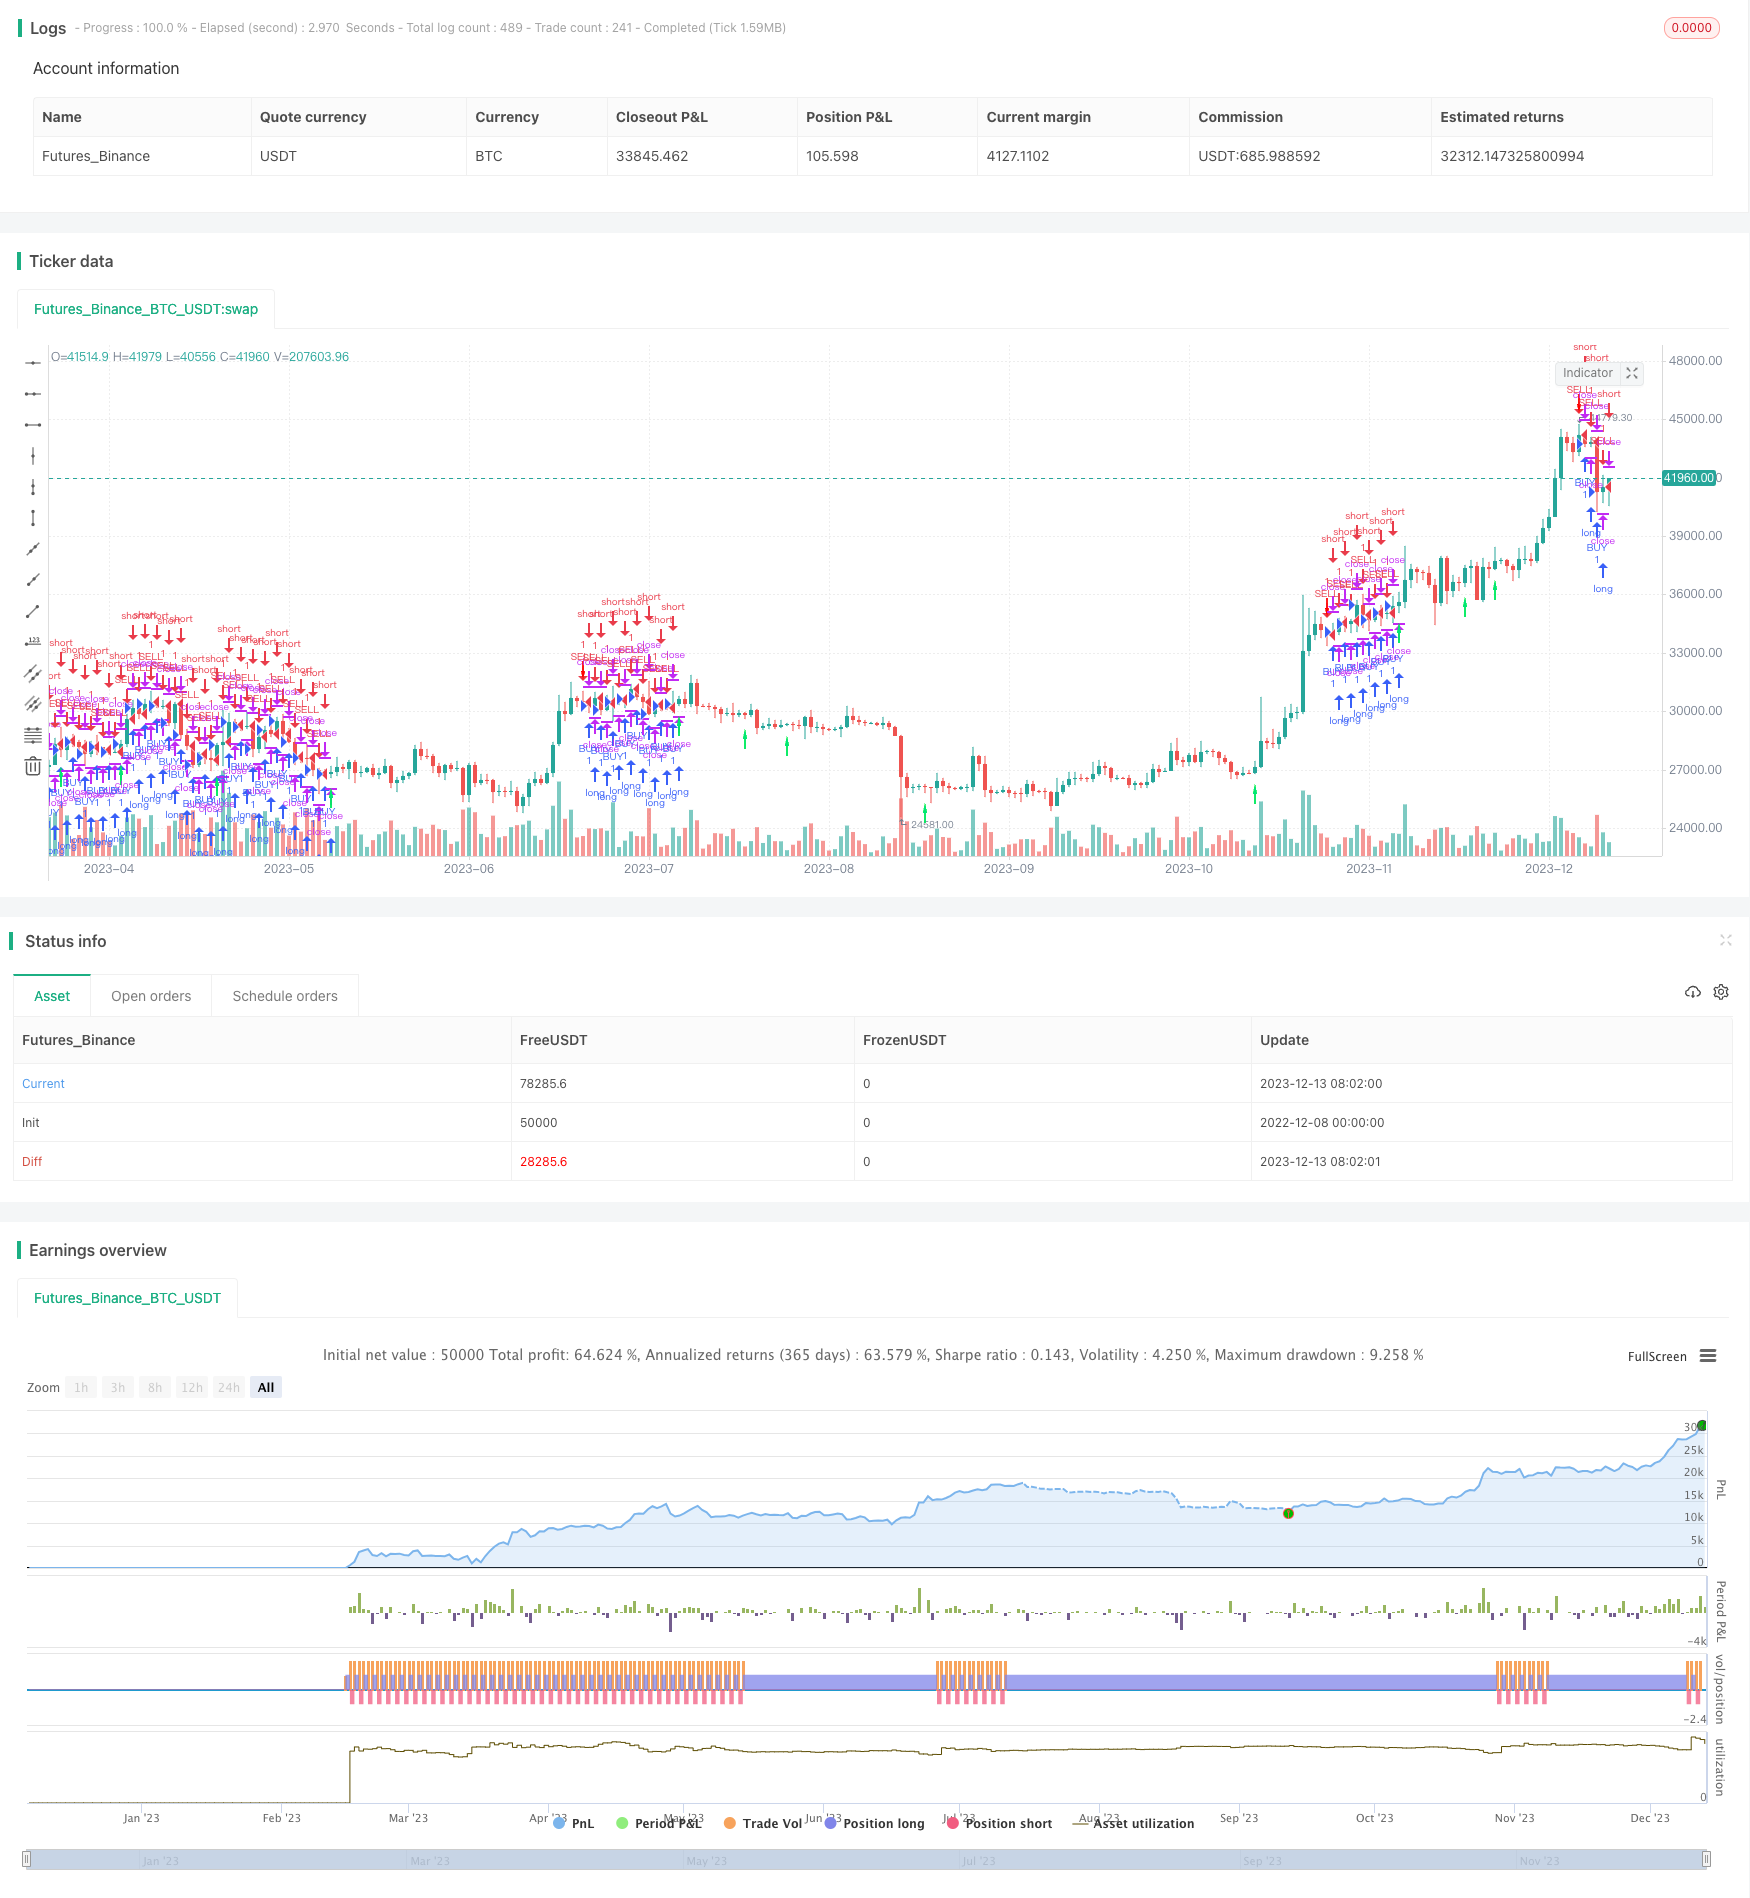
本策略名称为“基于Stochastic RSI的数字货币交易策略”。该策略结合了相对强弱指数(RSI)和随机指数平滑移动平均线(Stochastic RSI)两个指标来识别数字货币的买入和卖出信号。
策略的主要思路是:首先计算RSI值,然后基于RSI构建Stochastic RSI指标,即K值和D值。当K值上穿D值时产生买入信号,当K值下穿D值时产生卖出信号。为过滤假信号,策略还引入了变动速率指数(RVI)和其平滑移动平均线来进行确认。
二、策略详细原理
-
计算长度为14的RSI值。
-
基于RSI构建长度为14的Stochastic RSI指标,得到K值和D值(D为K的3期移动平均)。
-
计算长度为5的RVI和其信号线(即RVI的平滑移动平均线)。
-
当K上穿D时,如果RVI > 信号线并且上一周期RVI < 信号线,则产生买入信号;当K下穿D时,如果RVI <信号线并且上一周期RVI > 信号线,则产生卖出信号。
-
根据产生的信号,进行买入或卖出开仓操作。
三、策略优势分析
-
结合Stochastic RSI和RVI双重确认,可以有效过滤虚假信号。
-
RVI指标可以反映短期内的超买超卖情况,避免在极端点位开仓。
-
Stochastic RSI指标可以识别超买超卖区域,借助KDJ指标的金叉死叉形态来判断买卖点位。
-
回测结果表明,该策略在一些数字货币交易对(如FCT/BTC)上取得了不错的效果。
四、策略风险分析
-
类似的跟踪止损策略,止损点设置得不恰当可能会被套牢。
-
信号产生频率可能过高,交易费用是需要考量的因素。
-
KDJ指标及RVI指标都可能产生虚假信号,从而导致不必要的亏损。
-
策略参数需要针对不同的交易对进行优化,普适性有待考量。
五、策略优化方向
-
增加移动止损来锁定利润,可以参考ATR来设置止损位。
-
优化RVI参数和Stochastic RSI参数,使信号更加明确。
-
增加交易量控制,避免单笔订单过大。
-
增加过滤机制,避免高位开仓。可以引入波动率指标来判断目前是否处于震荡状态。
-
测试不同的数字货币交易对,寻找最佳适配品种。
六、策略总结
本策略首先利用RSI指标构造Stochastic RSI,然后结合RVI指标来确认信号,以发现短期内的超买超卖现象,从而在反转点位打开仓位。优点是双重确认可以过滤假信号,缺点是可能存在参数过拟合风险。总体来说,该策略在一些交易对上取得了不错效果,通过进一步优化,可以获得更稳定的收益。
||
I. Strategy Overview
This strategy is named "Stochastic RSI Strategy for Cryptocurrency Trading". It combines the Relative Strength Index (RSI) and Stochastic RSI indicators to identify buy and sell signals for cryptocurrencies.
The main idea behind the strategy is: First calculate the RSI value, then construct the Stochastic RSI indicator based on RSI, namely the K and D values. When the K value crosses above the D value, a buy signal is generated. When the K value crosses below the D value, a sell signal is generated. To filter out false signals, the strategy also introduces the Rate of Change Index (RVI) and its moving average line for confirmation.
II. Detailed Principles of the Strategy
-
Calculate the 14-period RSI value.
-
Construct a 14-period Stochastic RSI indicator based on RSI to obtain K and D values (D is the 3-period moving average of K).
-
Calculate the 5-period RVI and its signal line (the moving average of RVI).
-
When K crosses above D, if RVI > Signal Line and last period's RVI < Signal Line, a buy signal is generated. When K crosses below D, if RVI < Signal Line and last period's RVI > Signal Line, a sell signal is generated.
-
Open long or short positions based on the generated signals.
III. Advantage Analysis
-
The combination of Stochastic RSI and dual confirmation from RVI can effectively filter out false signals.
-
The RVI indicator can reflect short-term overbought/oversold conditions and avoids opening positions at extreme points.
-
The Stochastic RSI indicator identifies overbought/oversold zones. It uses the golden/dead cross of the KDJ indicator to determine entry points.
-
Backtest results show this strategy has achieved good performance on some cryptocurrency pairs (such as FCT/BTC).
IV. Risk Analysis
-
Improper stop loss placement of similar trailing stop strategies may lead to being stopped out prematurely.
-
High signal frequency may lead to excessive trading fees that should be taken into consideration.
-
Both the KDJ and RVI indicators may generate false signals, resulting in unnecessary losses.
-
The strategy parameters need to be optimized for different trading pairs. General applicability needs to be evaluated.
V. Optimization Directions
-
Add a moving stop loss to lock in profits. The ATR can be referenced to set stop loss levels.
-
Optimize RVI Parameters and Stochastic RSI parameters for cleaner signals.
-
Add trade size control to avoid excessively large single orders.
-
Add filtering mechanisms to avoid opening positions at unfavorable levels. Volatility indicators can be introduced to determine if the market is currently in a choppy state.
-
Test on different cryptocurrency pairs to find the best fit.
VI. Strategy Summary
This strategy first constructs a Stochastic RSI based on the RSI indicator, then uses the RVI indicator for confirmation, in order to detect short-term overbought/oversold conditions and open positions at turning points. The advantage is that dual confirmation can filter out false signals. The disadvantage is the risk of overfitting parameters. Overall, this strategy has achieved good results on some trading pairs. Further optimizations can obtain more consistent profits.
[/trans]
Strategy Arguments
| Argument | Default | Description |
|---|---|---|
| v_input_1 | 5 | Length |
| v_input_2 | 3 | smoothK |
| v_input_3 | 3 | smoothD |
| v_input_4 | 14 | lengthRSI |
| v_input_5 | 14 | lengthStoch |
| v_input_6_close | 0 | RSI Source: close |
Source (PineScript)
/*backtest
start: 2022-12-08 00:00:00
end: 2023-12-14 00:00:00
period: 1d
basePeriod: 1h
exchanges: [{"eid":"Futures_Binance","currency":"BTC_USDT"}]
*/

//@version=4
strategy(title="Stochastic RSI", shorttitle="Stoch RSI", overlay = true)
Per = input(5, title="Length", minval=1)
smoothK = input(3, minval=1)
smoothD = input(3, minval=1)
lengthRSI = input(14, minval=1)
lengthStoch = input(14, minval=1)
src = input(close, title="RSI Source")

rsi1 = rsi(src, lengthRSI)
K = sma(stoch(rsi1, rsi1, rsi1, lengthStoch), smoothK)
D = sma(K, smoothD)


rvi = sum(swma(close-open), Per)/sum(swma(high-low),Per)
sig = swma(rvi)
//plot(rvi, color=green, title="RVI")
//plot(sig, color=red, title="Signal")

//plot(K,  title="K")
//plot(D,  title="D")
Dn = K <= D  and K > 70 and rvi <= sig  and rvi[1] >= sig[1]
Up= K >= D  and K < 30 and rvi >= sig  and rvi[1] <= sig[1]
ARROW =  Up - Dn
plotarrow(ARROW, title="Down Arrow",  colordown=red, transp=0, maxheight=10, minheight=10)
plotarrow(ARROW, title="Up Arrow", colorup=lime,  transp=0, maxheight=10, minheight=10)
long = crossover(Up, Dn)
short = crossunder(Up, Dn)
last_long = long ? time : nz(last_long[1])
last_short = short ? time : nz(last_short[1])
long_signal = crossover(last_long, last_short)
short_signal = crossover(last_short, last_long)

//plot(long_signal, "BUY", color=green)
//plot(short_signal, "SELL", color=red)
strategy.entry("BUY", strategy.long, when=long_signal)
strategy.entry("SELL", strategy.short, when=short_signal)
Detail
https://www.fmz.com/strategy/435463
Last Modified
2023-12-15 10:08:14