
6.8 KiB
Name
基于SMA和ATR的趋势追踪策略SMA-and-ATR-Based-Trend-Tracking-Strategy
Author
ChaoZhang
Strategy Description
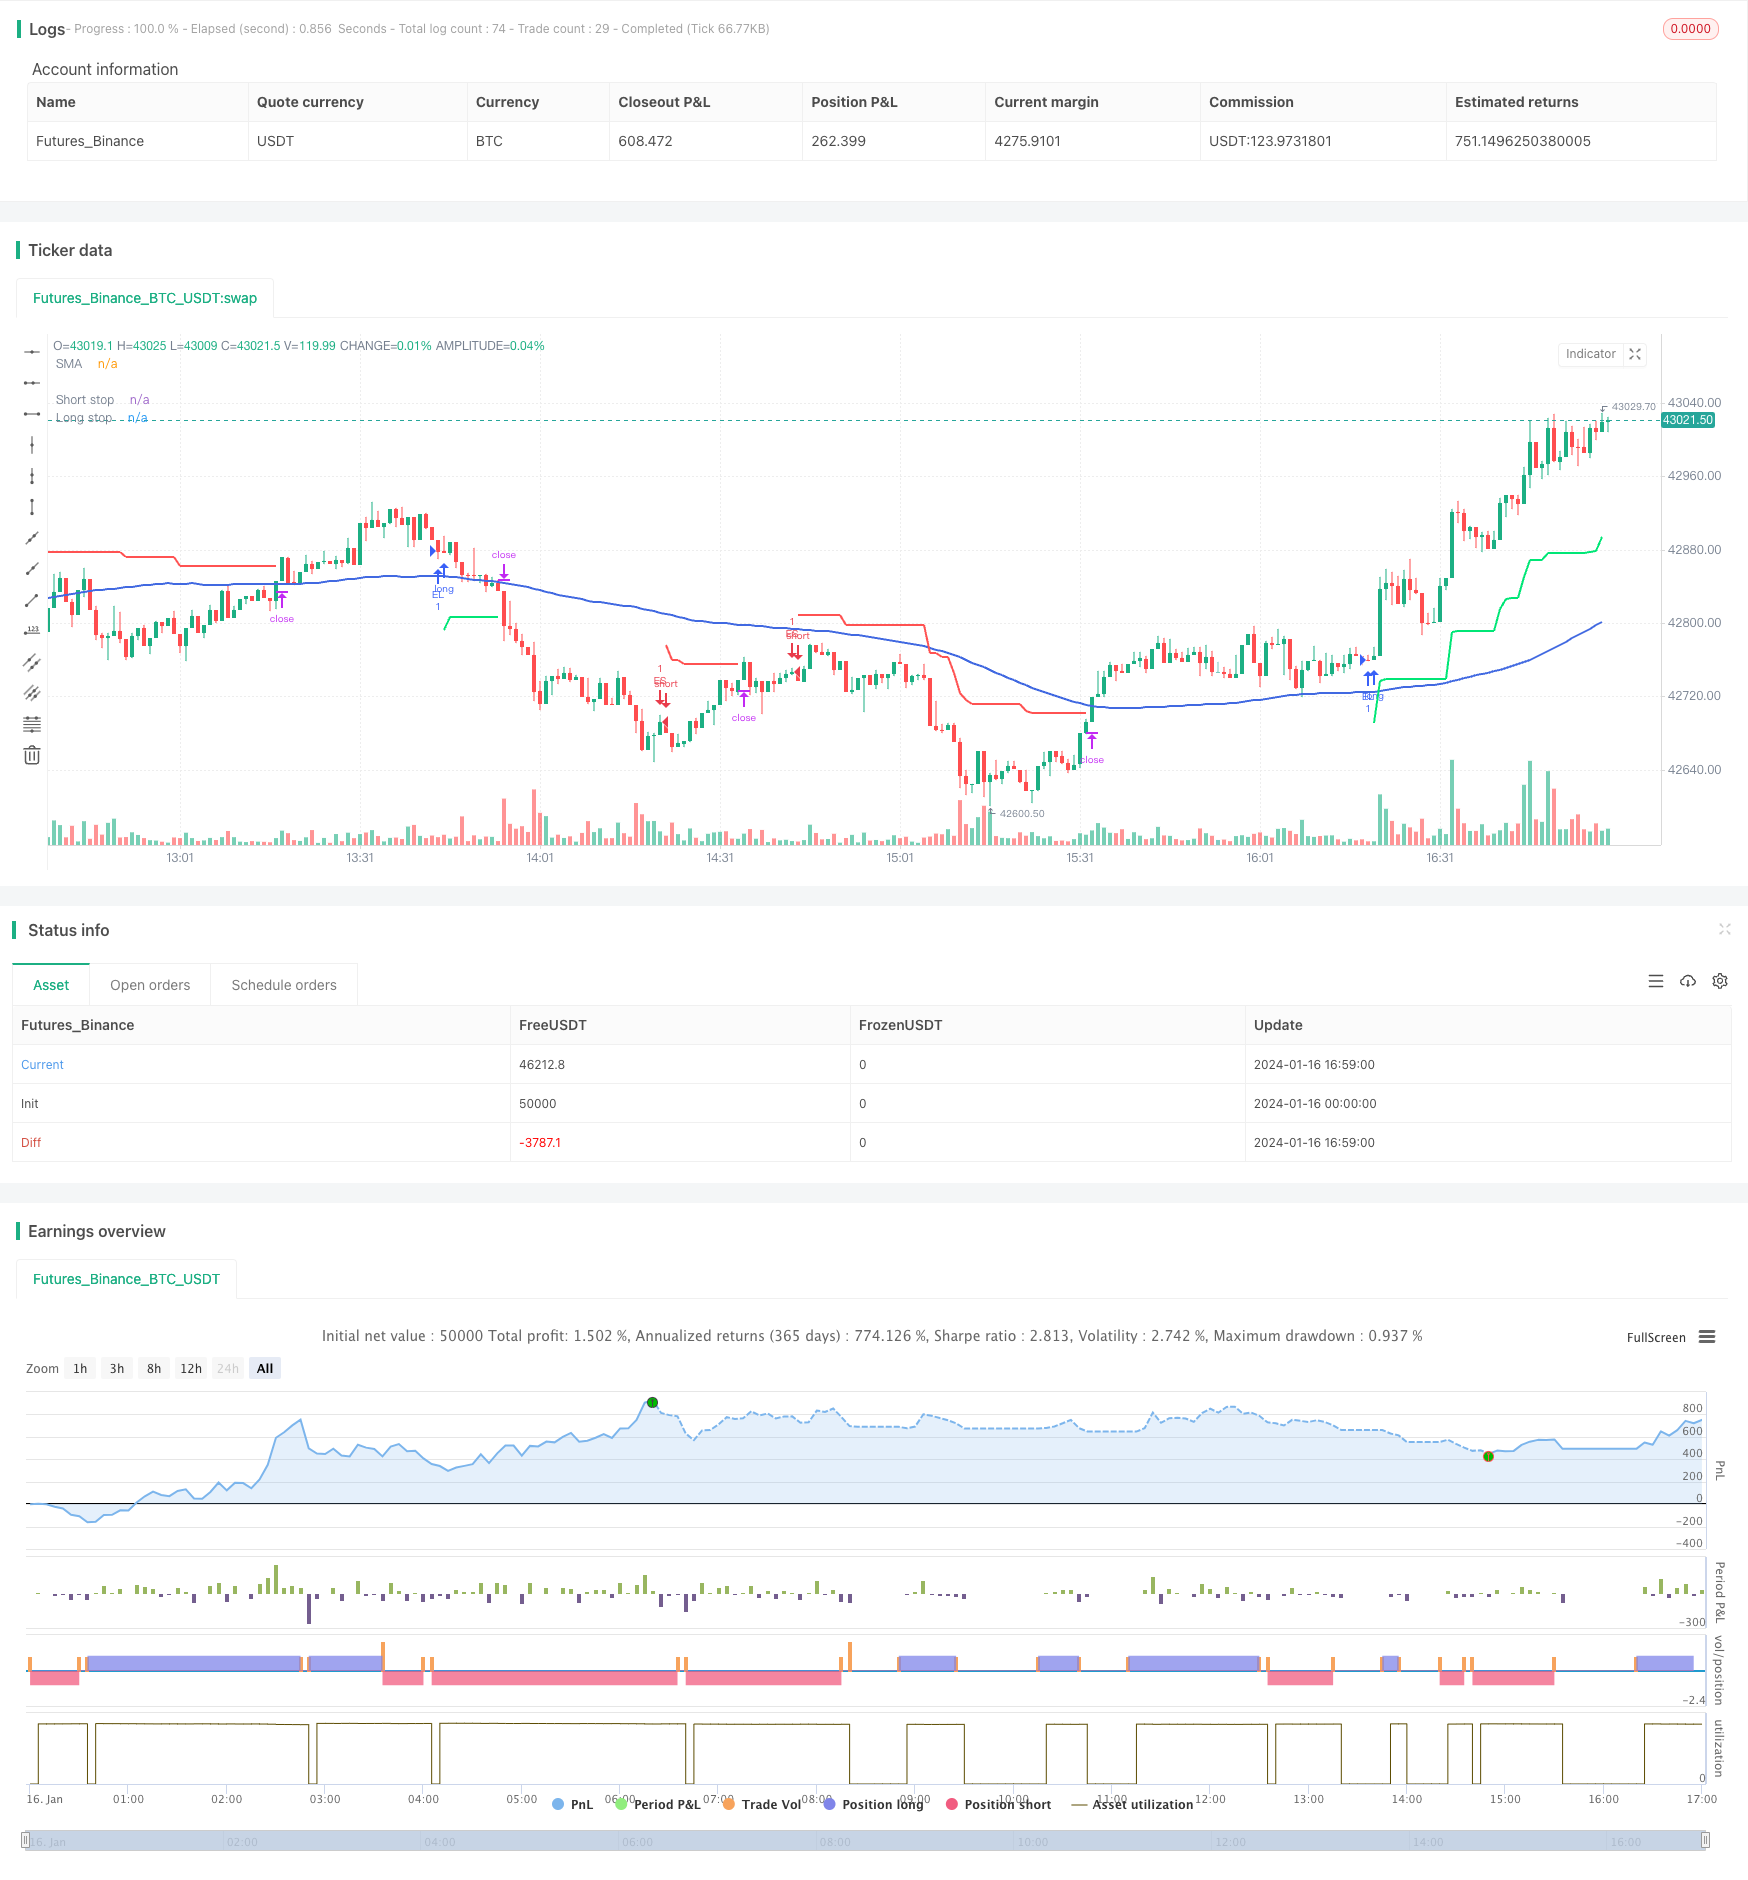 [trans]
一、策略名称
本策略名称为基于SMA和ATR的趋势追踪策略。
二、策略概述
本策略利用SMA指标判断价格趋势方向,并利用ATR指标设置止损位置来追踪趋势。当价格跌破上升趋势时做空,当价格突破下跌趋势时做多,实现趋势交易。
三、策略原理
1. 进入信号
(1)当收盘价上涨且高于SMA时,做多 (2)当收盘价下跌且低于SMA时,做空
2. 止损设置
利用ATR指标的数值乘以设置的止损倍数作为止损位置。
3. 止损更新
每根K线收盘后检查止损位置,并更新为更靠近当前价位的止损值。
4. 退出信号
价格触碰止损线后主动止损退出。
四、策略优势
1. 趋势追踪能力强
利用ATR指标的动态止损设定能够实现对趋势的自动追踪。
2. 回撤控制能力好
严格的止损规则有助于控制单笔交易的最大回撤。
3. 参数设置简单
只有3个参数,方便调整和优化。
五、策略风险
1. 可能出现止损过于宽松
如果止损倍数设置过大,可能导致止损位置过于宽松,从而增加回撤。
2. 假突破带来的风险
价格出现假突破时,可能导致错开趋势方向,应结合其他指标过滤信号。
3. 参数优化风险
过度依赖参数优化可能导致曲线优化。应谨慎评估参数稳定性。
六、策略优化方向
1. 优化止损算法
可以测试其他型的止损算法,如移动止损、比例止损等。
2. 增加过滤信号
可以加入其他指标过滤假突破。例如增加成交量条件等。
3. 评估参数稳定性
通过历史回测评估参数对不同品种和周期的适应性。
七、总结
本策略整体思路清晰,通过SMA判断趋势方向,并利用ATR进行趋势追踪,回撤控制能力良好,适合中长线趋势交易。但实盘中仍需要适当调整参数,并防范过优化的风险。
||
I. Strategy Name
The strategy is named SMA and ATR Based Trend Tracking Strategy.
II. Strategy Overview
This strategy uses the SMA indicator to determine the price trend direction and sets stop loss positions with the ATR indicator to track the trend. It goes short when the price breaks down an uptrend and goes long when the price breaks through a downtrend to implement trend trading.
III. Strategy Principle
1. Entry Signals
(1) Go long when the close price rises and is higher than SMA.
(2) Go short when the close price falls and is lower than SMA.
2. Stop Loss Setting
Use the ATR indicator's value multiplied by the set stop loss multiple as the stop loss position.
3. Stop Loss Updating
After each bar's close, check the stop loss position and update it to a stop loss value closer to the current price.
4. Exit Signals
Actively stop loss when price touches stop loss line.
IV. Advantages of Strategy
1. Strong Trend Tracking Ability
The dynamic stop loss setting of the ATR indicator enables automatic tracking of trends.
2. Good Drawdown Control
Strict stop loss rules help control maximum drawdown per trade.
3. Simple Parameter Setting
Only 3 parameters make adjustment and optimization easy.
V. Risks of Strategy
1. Risk of Stop Loss being too Loose
If the stop loss multiple is set too high, the stop loss position may be too loose, thus increasing drawdown.
2. Risks of False Breakout
Price false breakouts may lead to missing the trend direction. Other indicators should be used to filter signals.
3. Risks of Parameter Optimization
Excessive reliance on parameter optimization may lead to curve fitting. The stability of parameters should be carefully evaluated.
VI. Strategy Optimization Directions
1. Optimizing Stop Loss Algorithm
Other types of stop loss algorithms can be tested, such as moving stop loss, proportional stop loss, etc.
2. Adding Filter Signals
Other indicators can be added to filter false breakouts. For example, adding trading volume conditions.
3. Evaluating Stability of Parameters
Back-testing history to evaluate parameters' adaptability to different products and timeframes.
VII. Summary
The overall idea of this strategy is clear. It judges trend direction through SMA and uses ATR to track trends with good drawdown control. It is suitable for medium-long term trend trading. But parameters still need proper adjustment in live trading, and risks of over-optimization should be prevented.
[/trans]
Strategy Arguments
| Argument | Default | Description |
|---|---|---|
| v_input_int_1 | 100 | SMA Length |
| v_input_int_2 | 10 | ATR Length |
| v_input_float_1 | 4 | Stop Offset Multiple |
Source (PineScript)
/*backtest
start: 2024-01-16 00:00:00
end: 2024-01-16 17:00:00
period: 1m
basePeriod: 1m
exchanges: [{"eid":"Futures_Binance","currency":"BTC_USDT"}]
*/

// This Pine Script™ code is subject to the terms of the Mozilla Public License 2.0 at https://mozilla.org/MPL/2.0/
// © omererkan

//@version=5
strategy(title="SMA with ATR", overlay=true)

smaLen = input.int(100, title="SMA Length")

atrLen     = input.int(10, title="ATR Length")
stopOffset = input.float(4, title="Stop Offset Multiple", step=0.25)


smaValue  = ta.sma(close, smaLen)
stopValue = ta.atr(atrLen) * stopOffset


lowerCloses = close < close[1] and
     close[1] < close[2] and
     close[2] < close[3]

enterLong = close > smaValue and
     lowerCloses


longStop = 0.0
longStop := if enterLong and strategy.position_size < 1
    close - stopValue
else
    math.max(close - stopValue, longStop[1])


higherCloses = close > close[1] and
     close[1] > close[2] and
     close[2] > close[3]

enterShort = close < smaValue and
     higherCloses


shortStop = 0.0
shortStop := if enterShort and strategy.position_size > -1
    close + stopValue
else
    math.min(close + stopValue, shortStop[1])


plot(smaValue, color=#4169e1, linewidth=2, title="SMA")

plot(strategy.position_size > 0 ? longStop : na, color=color.lime,
     style=plot.style_linebr, title="Long stop", linewidth=2)

plot(strategy.position_size < 0 ? shortStop : na, color=color.red,
     style=plot.style_linebr, title="Short stop", linewidth=2)


if enterLong
    strategy.entry("EL", strategy.long)

if enterShort
    strategy.entry("ES", strategy.short)


if strategy.position_size > 0
    strategy.exit("SL Long", from_entry="EL", stop=longStop)

if strategy.position_size < 0
    strategy.exit("SL Short", from_entry="ES", stop=shortStop)


if enterLong
    strategy.cancel("Exit Short")

if enterShort
    strategy.cancel("Exit Long")
Detail
https://www.fmz.com/strategy/439260
Last Modified
2024-01-18 16:04:51