
12 KiB
Name
基于RSI-穿越交易策略The-RSI-Crossover-Trading-Strategy
Author
ChaoZhang
Strategy Description
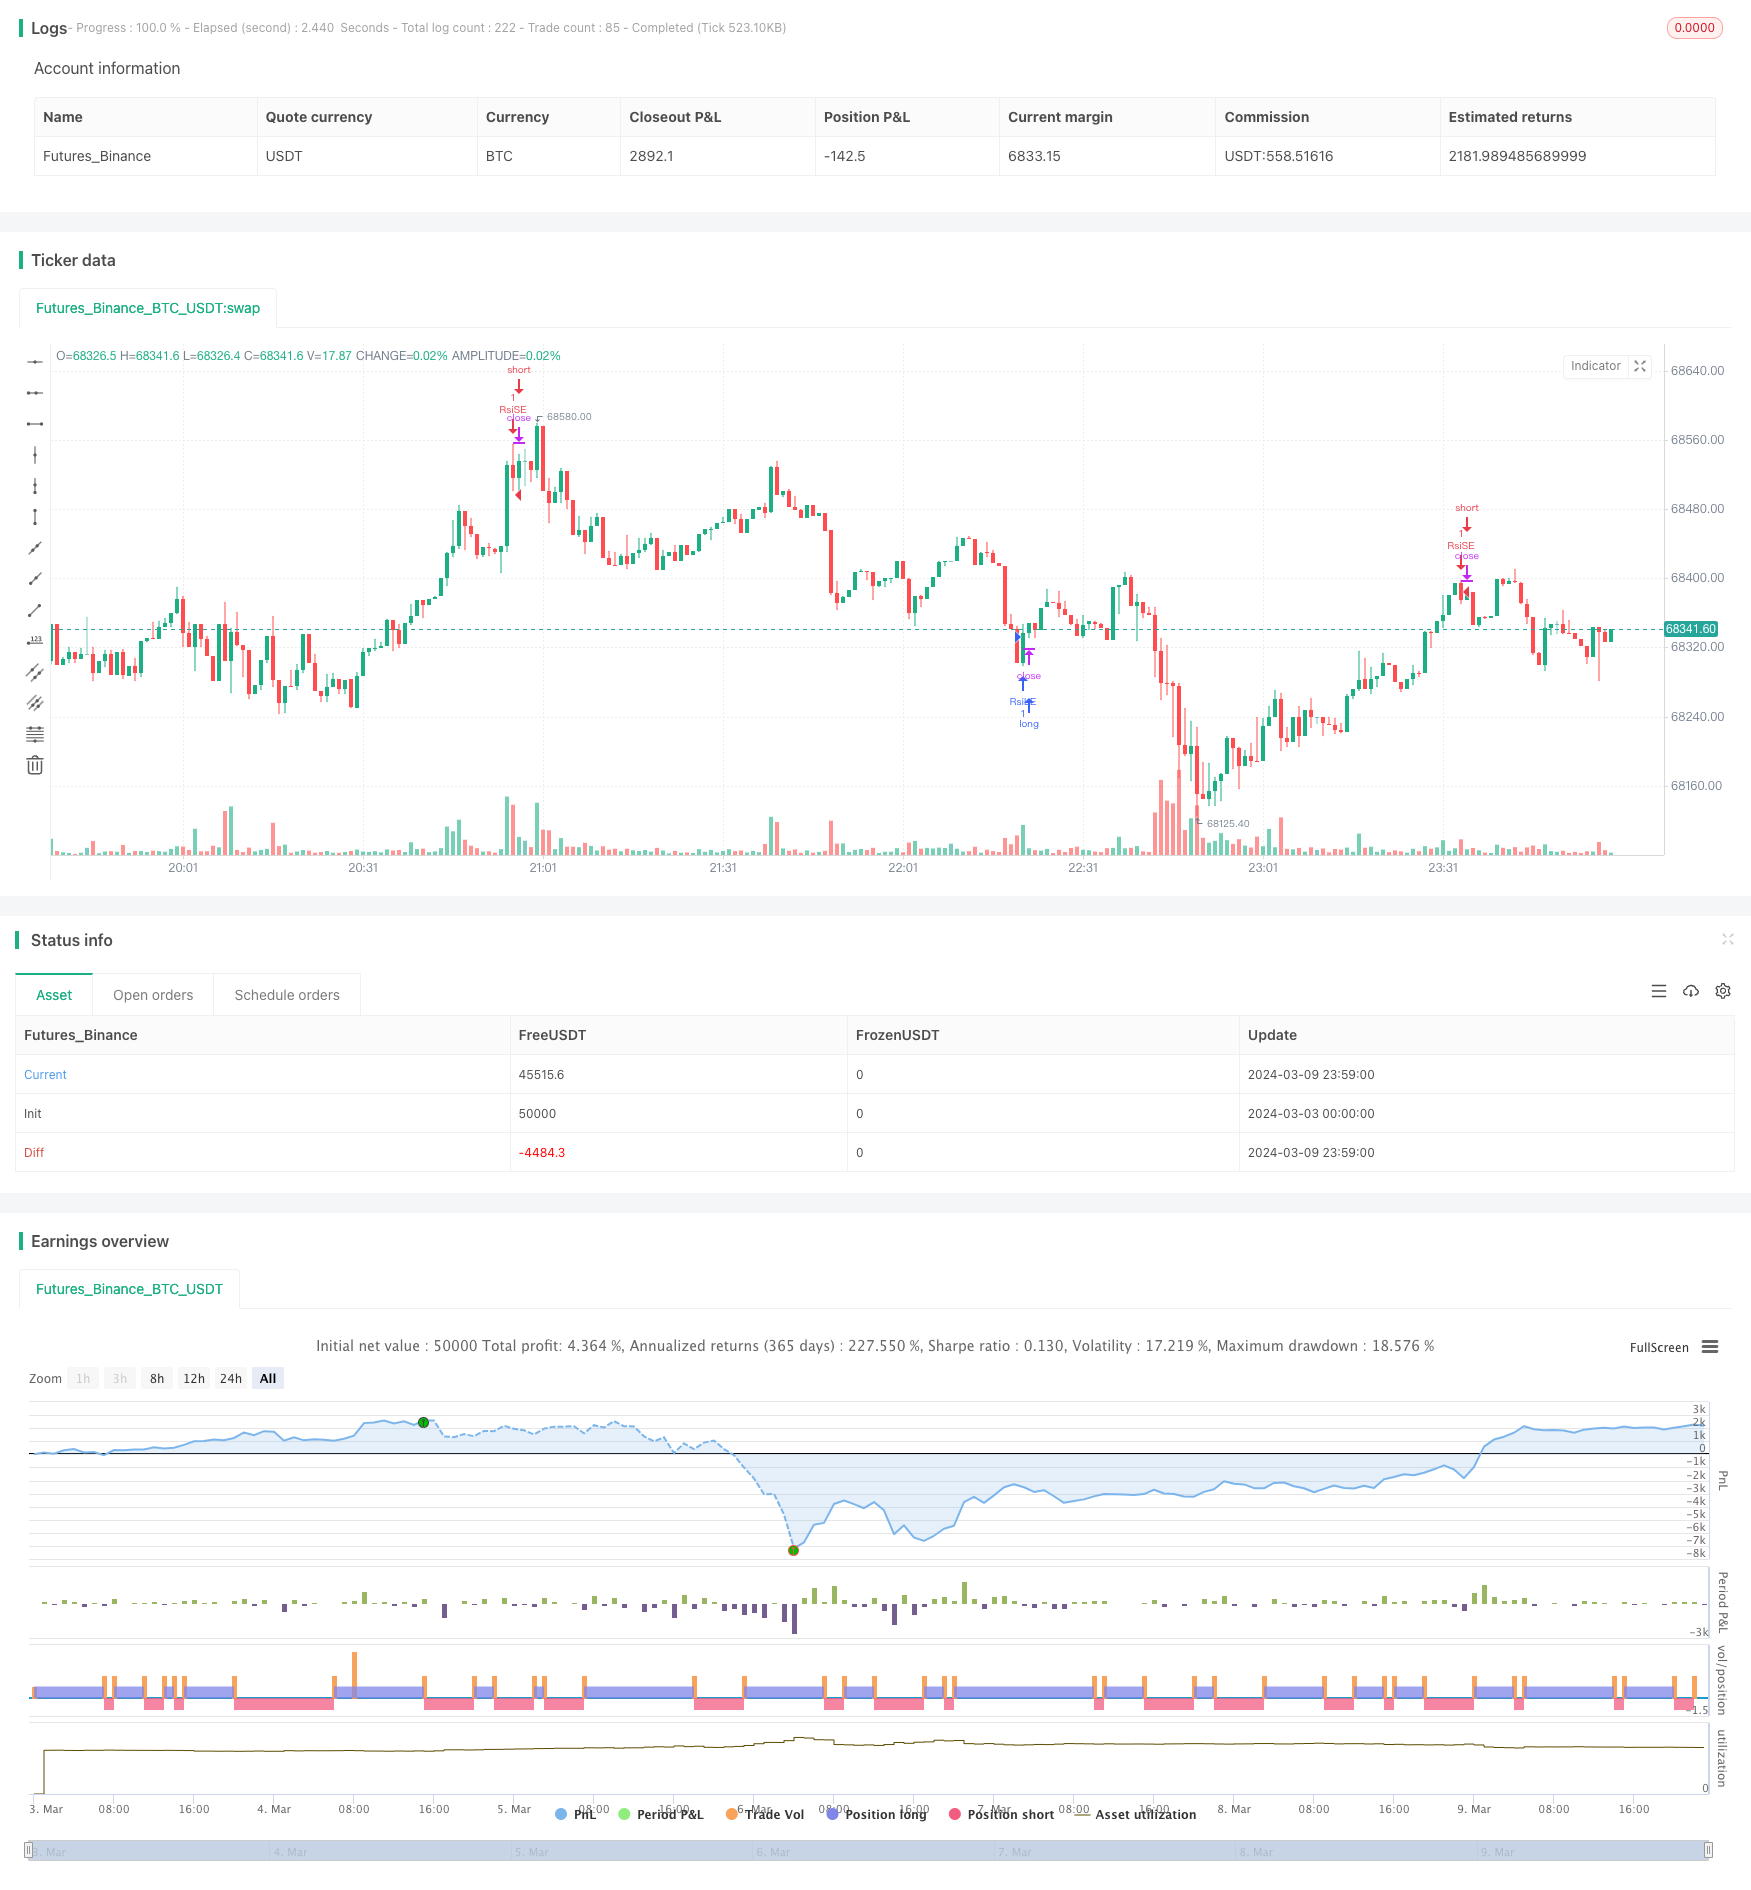 [trans]
策略概述:
RSI 穿越交易策略是一个基于相对强弱指标(RSI)的量化交易策略。该策略利用 RSI 指标的穿越信号来识别市场的超买和超卖状态,从而在合适的时机进行交易。当 RSI 从下向上穿越超卖水平时开多仓,当 RSI 从上向下穿越超买水平时开空仓。同时,该策略还设置了平仓条件,当多头仓位的 RSI 从上向下穿越超买水平或空头仓位的 RSI 从下向上穿越超卖水平时平仓。
策略原理: RSI 是一个动量振荡指标,它通过比较一段时间内的平均收盘价上涨幅度与下跌幅度来衡量市场的超买和超卖状态。RSI 的取值范围在0到100之间。当 RSI 高于70时,通常被认为市场处于超买状态,可能面临回调压力;当 RSI 低于30时,通常被认为市场处于超卖状态,可能有反弹的机会。
该策略的核心是利用 RSI 穿越超买和超卖水平的信号来进行交易决策。具体来说:
- 计算指定周期(默认为19)的 RSI 指标值
- 设定超卖和超买水平(默认分别为35和70)
- 判断 RSI 是否从下向上穿越了超卖水平,如果是则开多仓
- 判断 RSI 是否从上向下穿越了超买水平,如果是则开空仓
- 对于持有的多头仓位,判断 RSI 是否从上向下穿越了超买水平,如果是则平多仓
- 对于持有的空头仓位,判断 RSI 是否从下向上穿越了超卖水平,如果是则平空仓
通过这些简单的判断条件和交易规则,该策略可以较好地捕捉市场的超买超卖状态,并在价格可能出现反转时及时进场或离场。
策略优势:
- 逻辑简单,易于理解和实现。该策略只依赖 RSI 单一指标,判断条件清晰明了,适合新手量化交易者学习使用。
- 无需预测市场走势,只做确定的事。RSI 穿越交易策略并不关心价格是否会继续上涨或下跌,而只在关键的超买和超卖时刻进行交易。这可以在一定程度上避免市场噪音的干扰。
- 适用范围广。RSI 指标可以用于多种不同的市场和品种,如股票、期货、外汇等。不同的市场特征可能需要调整参数,但整体的交易逻辑是共通的。
策略风险:
- 参数敏感。RSI 指标的计算周期、超买和超卖阈值的设置对策略效果有很大影响。不同的参数可能导致截然不同的结果。因此在实际应用中需要根据标的特性和市场环境进行参数优化。
- 趋势性市场表现欠佳。RSI 穿越策略在震荡市中往往表现较好,但在强趋势市场中可能会出现频繁的假信号,导致连续亏损。市场分析不到位、固执己见都可能带来风险。
- 缺乏必要的风控措施。简单的 RSI 穿越策略并未考虑头寸管理、止损止盈等风险控制手段。在剧烈波动的市场中,这可能导致较大的回撤甚至爆仓。
优化方向:
- 参数自适应优化。针对不同品种和市场阶段,采用自适应的方法动态调整 RSI 指标的周期和阈值,以求达到更好的效果。
- 趋势过滤。在使用 RSI 穿越信号的同时,引入其他辅助指标来判断大级别的趋势方向,仅在趋势与信号一致时进场,以避免逆势而为。
- 仓位管理和风险控制。根据市场波动率、个人风险偏好等因素,对每笔交易的头寸大小进行控制。同时,设置合理的止损和止盈条件,以防止单笔交易的亏损过大。
- 组合优化。将 RSI 穿越策略与其他不同类型的策略进行组合,发挥各自的优势,提高整体的稳健性和收益性。
总结: RSI 穿越交易策略是一个简单实用的量化交易策略,通过捕捉市场的超买超卖状态来进行交易决策。它逻辑清晰,适用范围广,但也存在参数敏感、趋势性市场表现欠佳、风控措施不足等问题。在实际应用中,我们可以从参数自适应优化、趋势过滤、仓位管理和风险控制、策略组合等方面入手,不断完善和提升策略的稳健性和盈利能力。量化交易的核心在于用程序来执行已有的成熟交易策略,而优秀的交易策略则需要投资者在实践中不断总结、优化、创新。RSI 穿越交易策略可以作为一个很好的起点,帮助我们理解量化交易的基本思路和方法,但更重要的是要在此基础上学会灵活运用,开发出更加复杂、智能、适应市场变化的策略体系,真正成为赢利的量化投资者。
||
Strategy Overview: The RSI Crossover Trading Strategy is a quantitative trading strategy based on the Relative Strength Index (RSI) indicator. It utilizes the crossover signals of the RSI to identify overbought and oversold market conditions, and makes trades at appropriate timings. When the RSI crosses above the oversold level from below, it opens a long position; when the RSI crosses below the overbought level from above, it opens a short position. The strategy also sets exit conditions: when the RSI of a long position crosses below the overbought level from above or the RSI of a short position crosses above the oversold level from below, it closes the position.
Strategy Principle: RSI is a momentum oscillator that measures the speed and change of price movements by comparing the magnitude of recent gains to recent losses over a specified time period. The RSI ranges from 0 to 100. When the RSI is above 70, it is commonly considered that the market is overbought and may face selling pressure; when the RSI is below 30, the market is thought to be oversold and may have a chance to rebound.
The core of this strategy is to use the crossover signals of RSI above and below the overbought and oversold levels to make trading decisions. Specifically:
- Calculate the RSI value for a specified period (default is 19)
- Set the oversold and overbought levels (default is 35 and 70 respectively)
- Determine if the RSI has crossed above the oversold level from below, if so, open a long position
- Determine if the RSI has crossed below the overbought level from above, if so, open a short position
- For the holding long position, determine if the RSI has crossed below the overbought level from above, if so, close the long position
- For the holding short position, determine if the RSI has crossed above the oversold level from below, if so, close the short position
Through these simple judgment conditions and trading rules, the strategy can capture the overbought and oversold conditions of the market quite well, and enter or exit positions timely when the price may reverse.
Strategy Advantages:
- Simple logic, easy to understand and implement. The strategy relies solely on the RSI indicator, with clear and straightforward judgment conditions, suitable for novice quantitative traders to learn and use.
- No need to predict market trends, only do certain things. The RSI crossover trading strategy does not care whether the price will continue to rise or fall, but only trades at key overbought and oversold moments. This can avoid the interference of market noise to a certain extent.
- Wide range of applications. The RSI indicator can be used in various markets and varieties, such as stocks, futures, foreign exchange, etc. Different market characteristics may require parameter adjustments, but the overall trading logic is common.
Strategy Risks:
- Parameter sensitivity. The calculation period of the RSI indicator and the setting of overbought and oversold thresholds have a great impact on the strategy effect. Different parameters may lead to completely different results. Therefore, parameter optimization is required based on the characteristics of the target and market environment in practical applications.
- Poor performance in trending markets. The RSI crossover strategy often performs better in volatile markets, but in strong trending markets, frequent false signals may occur, leading to consecutive losses. Inadequate market analysis and stubbornness can also bring risks.
- Lack of necessary risk control measures. The simple RSI crossover strategy does not consider position management, stop-loss and stop-profit and other risk control means. In highly volatile markets, this may lead to large drawdowns or even liquidation.
Optimization Direction:
- Adaptive parameter optimization. For different varieties and market stages, adopt an adaptive method to dynamically adjust the period and threshold of the RSI indicator to achieve better results.
- Trend filtering. While using RSI crossover signals, introduce other auxiliary indicators to judge the trend direction of the larger timeframe, and only enter the market when the trend is consistent with the signal to avoid going against the trend.
- Position management and risk control. Control the position size of each transaction according to factors such as market volatility and personal risk preference. At the same time, set reasonable stop-loss and stop-profit conditions to prevent excessive losses from a single transaction.
- Portfolio optimization. Combine the RSI crossover strategy with other different types of strategies to give play to their respective advantages and improve the overall robustness and profitability.
Summary: The RSI Crossover Trading Strategy is a simple and practical quantitative trading strategy that makes trading decisions by capturing overbought and oversold market conditions. It has clear logic, wide applicability, but also has problems such as parameter sensitivity, poor performance in trending markets, and insufficient risk control measures. In practical applications, we can start from adaptive parameter optimization, trend filtering, position management and risk control, strategy combination and other aspects to continuously improve and enhance the robustness and profitability of the strategy. The core of quantitative trading lies in using programs to execute existing mature trading strategies, and excellent trading strategies require investors to continuously summarize, optimize, and innovate in practice. The RSI Crossover Trading Strategy can serve as a good starting point to help us understand the basic ideas and methods of quantitative trading, but more importantly, we need to learn to use it flexibly and develop more complex, intelligent strategy systems that adapt to market changes to truly become profitable quantitative investors. [/trans]
Strategy Arguments
| Argument | Default | Description |
|---|---|---|
| v_input_1 | 19 | length |
| v_input_2 | 35 | overSold |
| v_input_3 | 70 | overBought |
Source (PineScript)
/*backtest
start: 2024-03-03 00:00:00
end: 2024-03-10 00:00:00
period: 1m
basePeriod: 1m
exchanges: [{"eid":"Futures_Binance","currency":"BTC_USDT"}]
*/

//@version=5
strategy("RSI Strategy", overlay=true)

length = input(19)
overSold = input(35)
overBought = input(70)
price = close

vrsi = ta.rsi(price, length)
co = ta.crossover(vrsi, overSold)
cu = ta.crossunder(vrsi, overBought)

if (not na(vrsi))
    if (co)
        strategy.entry("RsiLE", strategy.long, comment="RsiLE")
    if (cu)
        strategy.entry("RsiSE", strategy.short, comment="RsiSE")

// Define exit conditions
exitLong = ta.crossunder(vrsi, overBought)
exitShort = ta.crossover(vrsi, overSold)

// Exit trades based on exit conditions
if exitLong
    strategy.close("RsiLE")
    label.new(x = bar_index, y = low, text = "E", color = color.green, textcolor = color.white, style = label.style_label_down)
if exitShort
    strategy.close("RsiSE")
    label.new(x = bar_index, y = high, text = "E", color = color.red, textcolor = color.white, style = label.style_label_up)
Detail
https://www.fmz.com/strategy/444383
Last Modified
2024-03-11 16:05:04