
11 KiB
Name
基于RSI的低价动态入场与止损策略-Dynamic-Low-Price-Entry-and-Stop-Loss-Strategy-Based-on-RSI
Author
ChaoZhang
Strategy Description
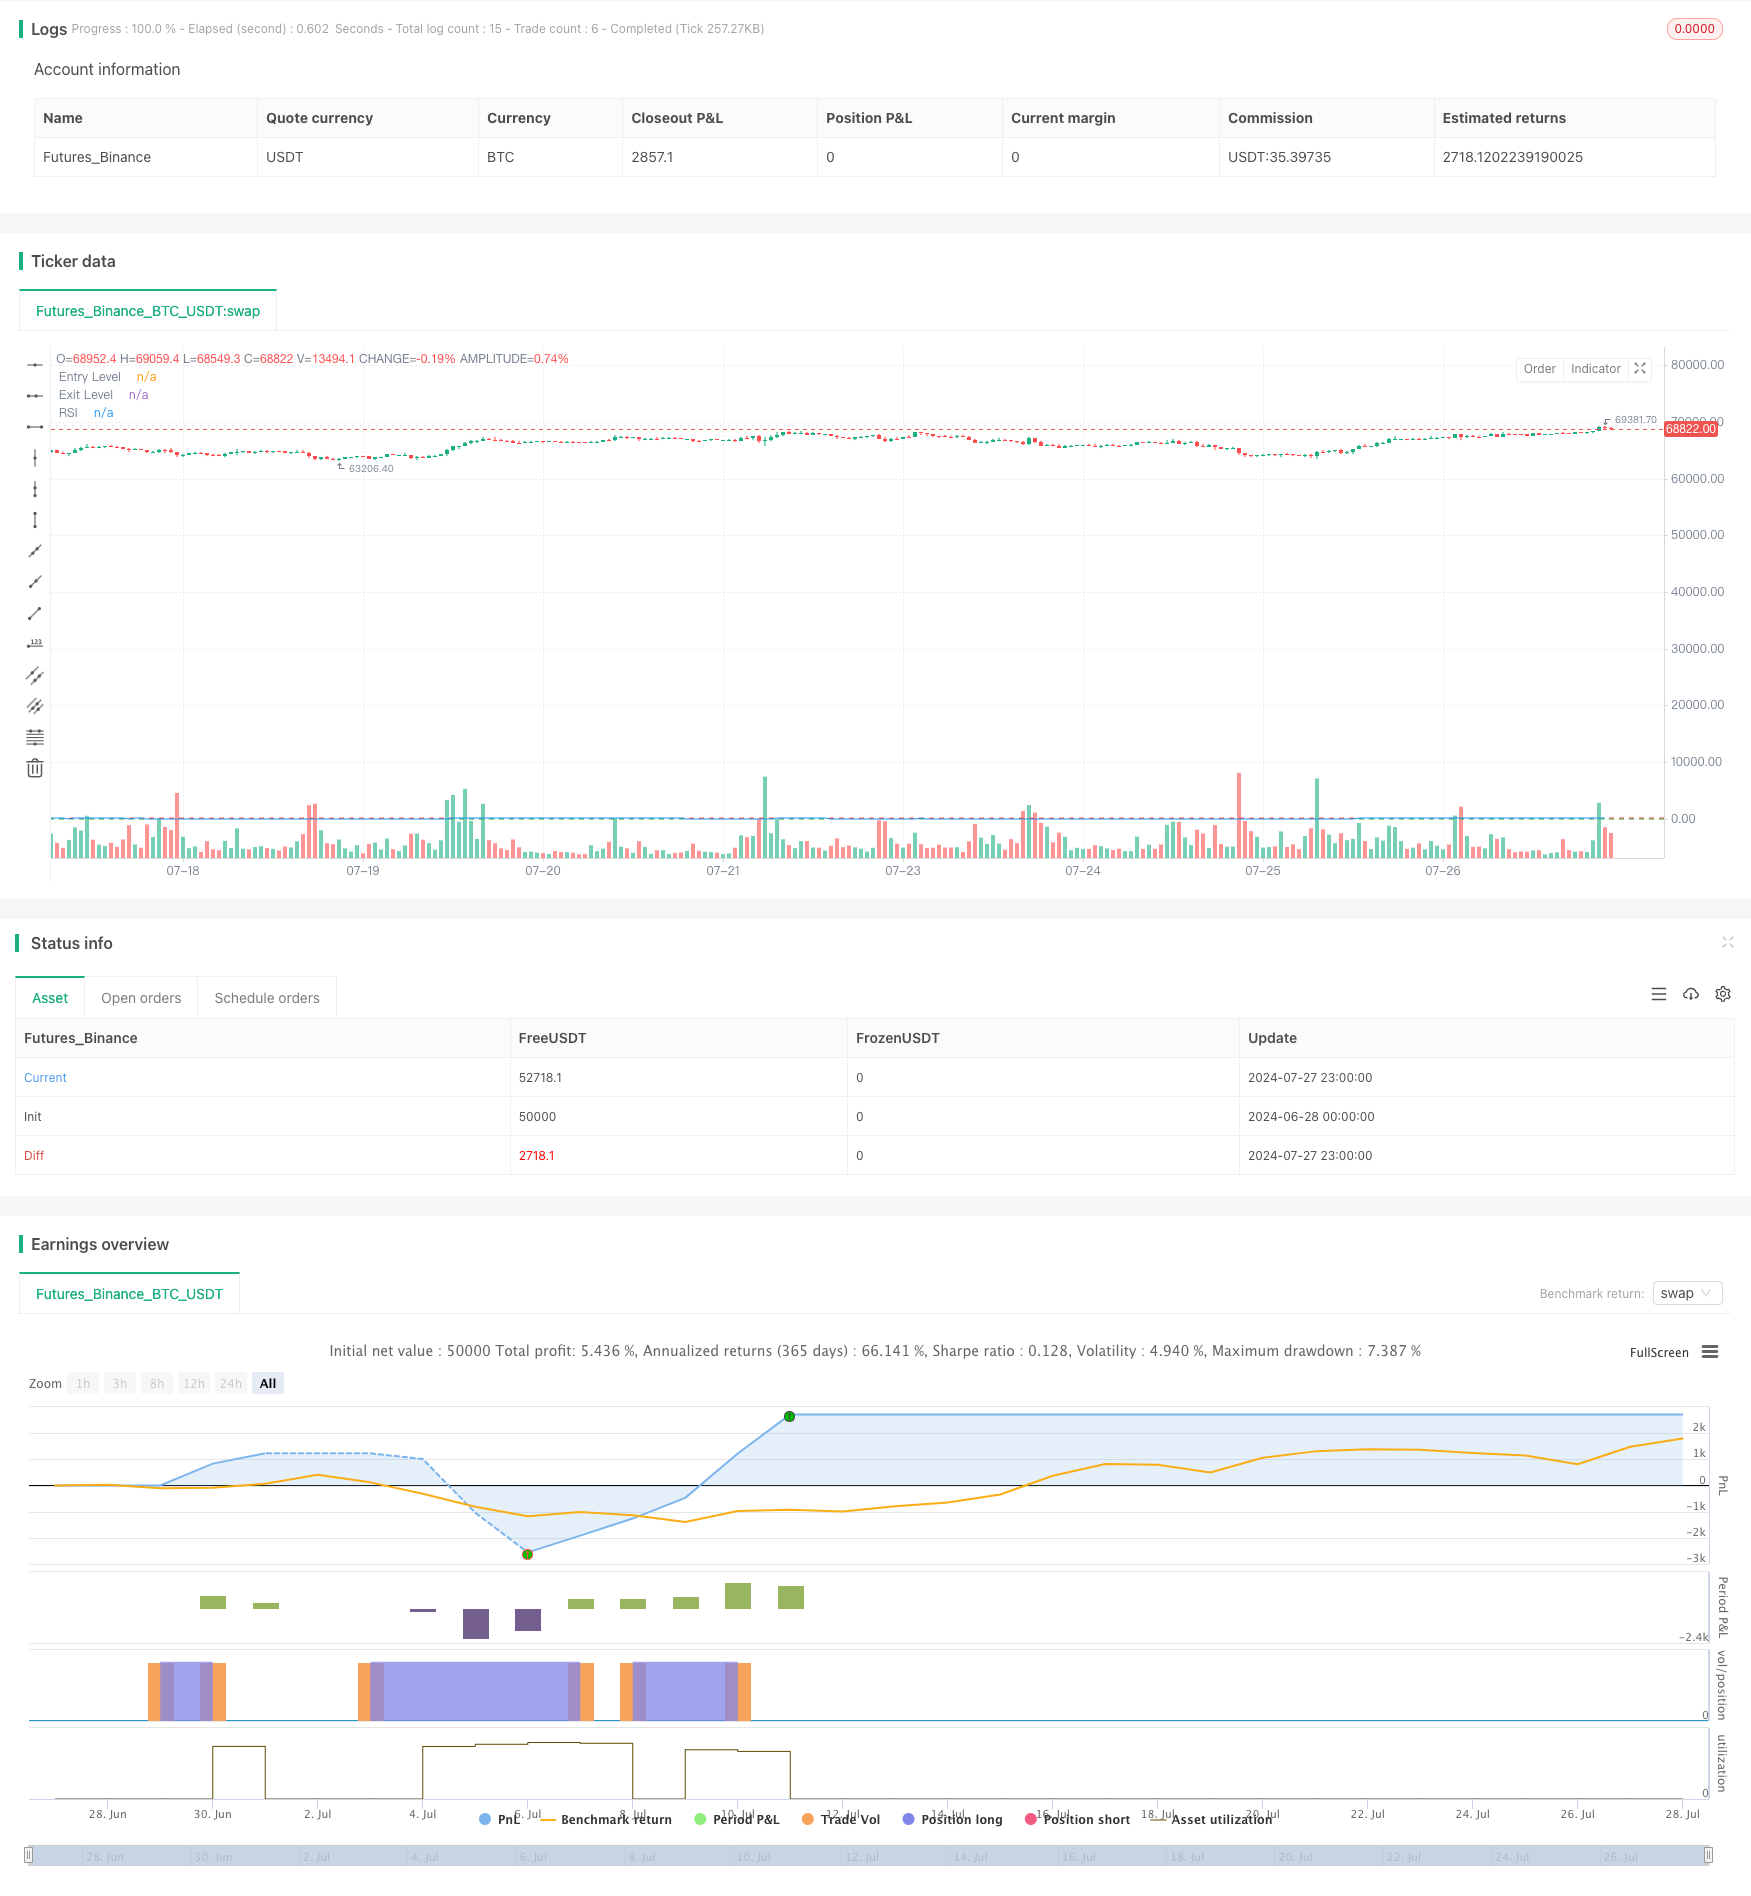
[trans]
概述
这个策略是一个基于相对强弱指数(RSI)的交易系统,专门设计用于某些特定市场。它利用RSI指标的超卖和超买区间来确定入场和出场点,同时结合了动态止损机制来控制风险。该策略的核心思想是在市场超卖时入场做多,并在RSI回升至超买区域或达到预设的最大损失百分比时退出。
策略原理
-
入场条件:当RSI值低于设定的入场阈值(默认为24)时,策略会开仓做多。这里使用的是当日最低价来计算RSI,而不是常用的收盘价,这可能使得策略对市场低点更为敏感。
-
出场条件:策略有两个出场条件: a) 当RSI值超过设定的出场阈值(默认为72)时,表明市场可能已经超买,此时平仓。 b) 当亏损百分比超过预设的最大损失容忍度(默认为20%)时,触发止损平仓。
-
仓位管理:策略默认使用账户总值的10%作为每次交易的资金量。
-
RSI计算:使用14天为周期计算RSI,但基于最低价而非传统的收盘价。
策略优势
-
动态入场:通过使用RSI的低点作为入场信号,策略能够在市场超卖时捕捉潜在的反弹机会。
-
风险控制:结合了技术指标(RSI)和百分比止损两种出场机制,既能在市场转向时及时获利了结,又能在行情不利时控制损失。
-
灵活性:策略允许用户自定义RSI的计算周期、入场和出场阈值,以及最大损失百分比,可以根据不同市场特性进行调整。
-
使用低价计算RSI:这种非传统的RSI计算方法可能更容易捕捉到市场的极端低点,有利于在更低的价格位置入场。
-
简洁明了:策略逻辑相对简单,易于理解和实施,同时也便于后续优化和扩展。
策略风险
-
假突破风险:在波动较大的市场中,RSI可能频繁触发入场信号,导致多次交易被触发后又迅速止损。
-
趋势跟随不足:策略主要依赖RSI反转信号,在强势趋势市场中可能会过早平仓,错失更大的盈利机会。
-
固定百分比止损:虽然设置了止损机制,但固定的百分比止损可能不适合所有市场条件,在某些情况下可能过于宽松或过于紧密。
-
单一指标依赖:策略仅依赖RSI指标,缺乏其他技术指标或基本面因素的验证,可能增加误判风险。
-
特定市场局限性:策略设计针对特定市场,可能不适用于其他类型的金融产品或市场。
策略优化方向
-
多指标结合:考虑引入其他技术指标如移动平均线、布林带等,与RSI结合使用,提高信号的可靠性。
-
自适应参数:可以开发一种机制,根据市场波动性自动调整RSI的计算周期和入场/出场阈值,使策略更具适应性。
-
动态止损:将固定百分比止损改为跟踪止损或ATR(平均真实范围)止损,可能会更好地适应不同的市场波动情况。
-
仓位管理优化:考虑根据RSI的强度或市场波动性动态调整每次交易的资金比例,而不是固定使用10%。
-
增加趋势过滤:引入趋势判断机制,例如使用长期移动平均线,在强势上涨趋势中避免过早平仓。
-
时间过滤:添加交易时间窗口限制,避免在市场波动较小或流动性较差的时段进行交易。
-
回测与优化:对策略进行大范围的参数优化和回测,找出在不同市场条件下表现最佳的参数组合。
总结
这个基于RSI的低价动态入场与止损策略提供了一种简洁而有效的交易方法。通过利用RSI的超卖和超买信号,结合动态止损机制,策略旨在捕捉市场低点并控制风险。其独特之处在于使用最低价计算RSI,这可能使得策略更敏感于市场底部。
然而,策略也存在一些局限性,如过度依赖单一指标和可能的过早平仓问题。为了提高策略的稳健性和适应性,可以考虑引入多指标验证、自适应参数、动态止损等优化方向。同时,针对不同市场特性进行深入的回测和参数优化也是必要的。
总的来说,这个策略为交易者提供了一个良好的起点,可以根据个人交易风格和目标市场特性进行进一步的定制和改进。在实际应用中,建议交易者谨慎评估策略在不同市场环境下的表现,并结合其他分析工具和风险管理技术来增强策略的整体效果。
||
Overview
This strategy is a trading system based on the Relative Strength Index (RSI), specifically designed for certain markets. It utilizes the oversold and overbought zones of the RSI indicator to determine entry and exit points, while incorporating a dynamic stop-loss mechanism to control risk. The core idea of this strategy is to enter long positions when the market is oversold and exit when the RSI rises to the overbought zone or reaches a preset maximum loss percentage.
Strategy Principles
-
Entry Condition: The strategy opens a long position when the RSI value falls below the set entry threshold (default 24). It uses the daily low price to calculate RSI, rather than the commonly used closing price, which may make the strategy more sensitive to market lows.
-
Exit Conditions: The strategy has two exit conditions: a) When the RSI value exceeds the set exit threshold (default 72), indicating potential market overbought, the position is closed. b) When the loss percentage exceeds the preset maximum loss tolerance (default 20%), it triggers a stop-loss closure.
-
Position Management: The strategy defaults to using 10% of the account's total value as the fund amount for each trade.
-
RSI Calculation: RSI is calculated using a 14-day period, but based on the low price rather than the traditional closing price.
Strategy Advantages
-
Dynamic Entry: By using RSI lows as entry signals, the strategy can capture potential rebound opportunities when the market is oversold.
-
Risk Control: Combines both technical indicator (RSI) and percentage stop-loss exit mechanisms, allowing for timely profit-taking when the market turns and controlling losses when the trend is unfavorable.
-
Flexibility: The strategy allows users to customize the RSI calculation period, entry and exit thresholds, and maximum loss percentage, which can be adjusted according to different market characteristics.
-
Using Low Price for RSI Calculation: This non-traditional RSI calculation method may be more likely to capture extreme market lows, favoring entry at lower price positions.
-
Simplicity and Clarity: The strategy logic is relatively simple, easy to understand and implement, while also being convenient for subsequent optimization and expansion.
Strategy Risks
-
False Breakout Risk: In highly volatile markets, RSI may frequently trigger entry signals, leading to multiple trades being initiated and quickly stopped out.
-
Insufficient Trend Following: The strategy mainly relies on RSI reversal signals, which may lead to premature closing of positions in strong trend markets, missing out on larger profit opportunities.
-
Fixed Percentage Stop-Loss: Although a stop-loss mechanism is set, a fixed percentage stop-loss may not be suitable for all market conditions, potentially being too loose or too tight in certain situations.
-
Single Indicator Dependence: The strategy relies solely on the RSI indicator, lacking verification from other technical indicators or fundamental factors, which may increase the risk of misjudgment.
-
Specific Market Limitations: The strategy is designed for specific markets and may not be applicable to other types of financial products or markets.
Strategy Optimization Directions
-
Multi-Indicator Combination: Consider introducing other technical indicators such as moving averages, Bollinger Bands, etc., to be used in conjunction with RSI to improve signal reliability.
-
Adaptive Parameters: Develop a mechanism to automatically adjust the RSI calculation period and entry/exit thresholds based on market volatility, making the strategy more adaptive.
-
Dynamic Stop-Loss: Change the fixed percentage stop-loss to a trailing stop-loss or ATR (Average True Range) stop-loss, which may better adapt to different market volatility situations.
-
Position Management Optimization: Consider dynamically adjusting the fund ratio for each trade based on RSI strength or market volatility, rather than fixed at 10%.
-
Add Trend Filtering: Introduce a trend judgment mechanism, such as using long-term moving averages, to avoid premature closing of positions in strong upward trends.
-
Time Filtering: Add trading time window restrictions to avoid trading during periods of low market volatility or poor liquidity.
-
Backtesting and Optimization: Conduct extensive parameter optimization and backtesting of the strategy to find the best parameter combinations under different market conditions.
Conclusion
This RSI-based dynamic low-price entry and stop-loss strategy provides a concise and effective trading method. By leveraging RSI's oversold and overbought signals combined with a dynamic stop-loss mechanism, the strategy aims to capture market lows while controlling risk. Its unique feature lies in using the low price to calculate RSI, which may make the strategy more sensitive to market bottoms.
However, the strategy also has some limitations, such as over-reliance on a single indicator and potential premature closing of positions. To improve the strategy's robustness and adaptability, consider introducing multi-indicator verification, adaptive parameters, dynamic stop-loss, and other optimization directions. Meanwhile, in-depth backtesting and parameter optimization for different market characteristics are also necessary.
Overall, this strategy provides traders with a good starting point that can be further customized and improved based on personal trading styles and target market characteristics. In practical application, it is recommended that traders carefully evaluate the strategy's performance under different market environments and combine it with other analysis tools and risk management techniques to enhance the overall effectiveness of the strategy.
[/trans]
Source (PineScript)
//@version=5
strategy("Simple RSI Strategy with Low as Source", overlay=true)

// Input parameters
rsiLength = input.int(14, title="RSI Length")
rsiEntryLevel = input.int(24, title="RSI Entry Level")
rsiExitLevel = input.int(72, title="RSI Exit Level")
lossTolerance = input.float(20.0, title="Max Loss %")

// Calculating RSI using the low price
rsi = ta.rsi(low, rsiLength)

// Entry condition
longCondition = rsi < rsiEntryLevel
if (longCondition)
    strategy.entry("Long", strategy.long)

// Recording the entry price
var float entryPrice = na
if (longCondition)
    entryPrice := low

// Exit conditions
percentFromEntry = 100 * (close - entryPrice) / entryPrice
exitCondition1 = rsi > rsiExitLevel
exitCondition2 = percentFromEntry <= -lossTolerance
if (exitCondition1 or exitCondition2)
    strategy.close("Long")

// Plotting
plot(rsi, "RSI", color=color.blue)
hline(rsiEntryLevel, "Entry Level", color=color.green)
hline(rsiExitLevel, "Exit Level", color=color.red)
Detail
https://www.fmz.com/strategy/458023
Last Modified
2024-07-29 13:22:37