
8.9 KiB
Name
基于RSI滤波器的布林带策略Bollinger-Bands-Strategy-with-RSI-Filter
Author
ChaoZhang
Strategy Description
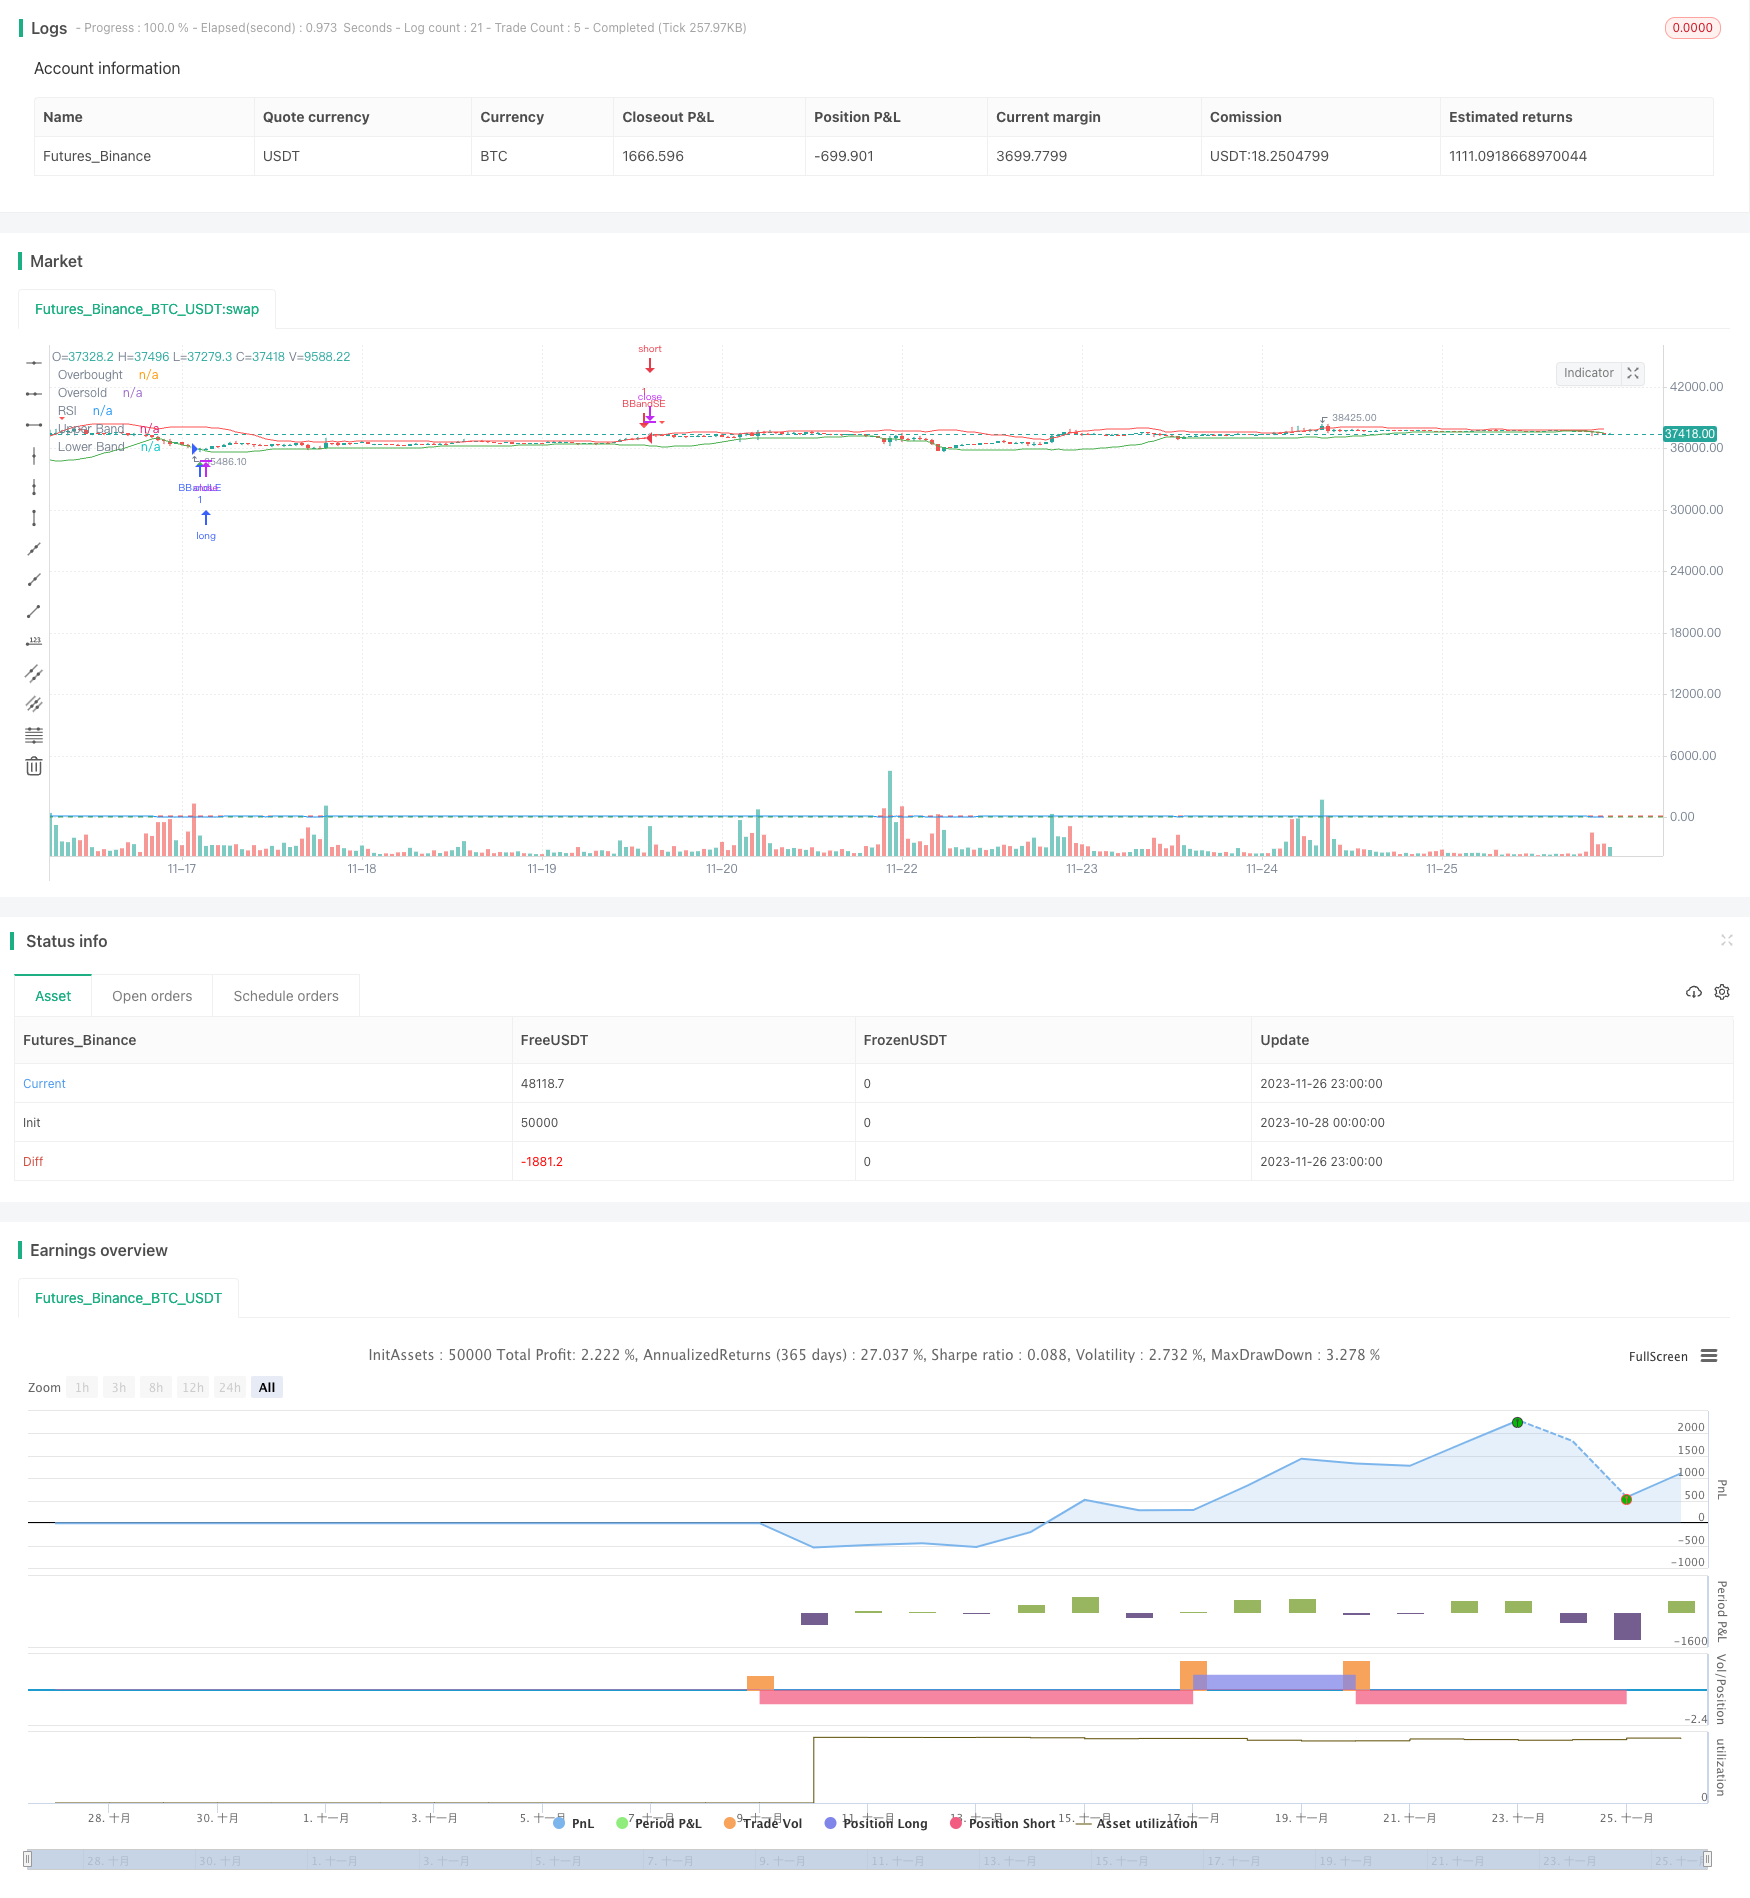
[trans]
概述
本策略名称为“基于RSI滤波器的布林带策略”。它是一个利用布林带原理,结合RSI指标作为滤波器判断入场的量化策略。该策略可以有效判断市场趋势,实现低买高卖,获取较好的收益。
策略原理
本策略的核心指标是布林带。布林带由中线、上线和下线组成。中线是n日移动平均线,上线是中线加上k倍的n日标准差,下线是中线减去k倍的n日标准差。当价格接近上线时,代表市场被高估,应考虑做空;当价格接近下线时,代表市场被低估,应考虑做多。
本策略在布林带的基础上,加入RSI指标作为入场过滤器。RSI可以判断市场是处于超买还是超卖状态。当RSI高于70时代表超买,低于30时代表超卖。本策略只有在布林带发出交易信号的同时,RSI也符合超买超卖条件时,才会考虑入场。
具体来说,当价格从下向上突破布林带下线,同时RSI低于超卖线30时,产生买入信号;当价格从上向下突破布林带上线,同时RSI高于超买线70时,产生卖出信号。
优势分析
本策略结合布林带和RSI指标,可以有效判断市场的超买超卖现象,避免假突破造成不必要的损失。同时,RSI指标作为滤波器,可以过滤掉部分噪音交易信号,让入场时机更加准确。
本策略只需较少的参数,实现过程简单清晰,适合不同水平的量化交易者使用。中长线持有效果更好,避免被市场短期波动干扰。
总的来说,本策略具有如下优势:
- 结合布林带和RSI,判断能力更强
- 减少假突破造成的损失
- 参数简单,容易实施
- 中长线持有,回撤更小
风险分析
本策略也存在一些风险需要警惕:
- 布林带参数设置不当,将导致交易信号的效果变差
- 趋势市场中,布林带常常伴随价格运行,不宜使用
- RSI容易产生背离,影响交易信号准确性
- 交易次数可能较少,容易出现长期亏损
为了控制这些风险,建议:
- 优化布林带参数,选择最佳参数组合
- 关注大级别市场结构,避免使用于震荡趋势中
- 结合其他指标确认RSI信号,防止误信号
- 适当调整持仓时间,防止出现巨额亏损
优化方向
本策略还有进一步优化的空间:
- 可以测试不同的RSI参数设置
- 可以加入止损策略,更好控制风险
- 可以结合其他指标进行组合验证
- 可以通过机器学习方法自动优化参数
这些优化可以使策略更稳定、参数更优化、风险控制更好。
总结
本策略名称为“基于RSI滤波器的布林带策略”。它整合布林带判断超买超卖的能力,以及RSI判断市场Momentum的能力,形成一个较强的量化策略。本策略在判断市场的长短机会上具有独特优势,可以带来较好的超额收益。
尽管如此,本策略也存在一定的改进空间,通过参数优化、风险控制等手段,可以使策略效果更出色,适应更多不同的市场情况,这也是未来的一大研究方向。 ||
Overview
The name of this strategy is “Bollinger Bands Strategy with RSI Filter”. It utilizes the principles of Bollinger Bands combined with the RSI indicator as a filter for entry signals. This strategy can effectively determine market trends for buying low and selling high to achieve decent profits.
Strategy Principle
The core indicator of this strategy is Bollinger Bands, consisting of the middle band, upper band and lower band. The middle band is the n-period moving average, the upper band is the middle band plus k times the n-period standard deviation, and the lower band is the middle band minus k times the n-period standard deviation. When the price approaches the upper band, the market is overvalued and short positions should be considered. When the price approaches the lower band, the market is undervalued and long positions should be considered.
In addition to Bollinger Bands, this strategy incorporates the RSI indicator as a filter for entry signals. The RSI judges whether the market is overbought or oversold. Values above 70 indicate overbought conditions and values below 30 indicate oversold conditions. This strategy only enters trades when Bollinger Bands give signal concurrently with RSI reaching overbought or oversold levels.
Specifically, when the price breaks above the lower Bollinger Band from below while the RSI is below 30, a buy signal is generated. When the price breaks below the upper Bollinger Band from above while the RSI is above 70, a sell signal is generated.
Advantage Analysis
This strategy combines Bollinger Bands with the RSI indicator to effectively identify overbought and oversold market conditions, avoiding unnecessary losses from false breakouts. The RSI acts as a filter to remove some market noise, making entry timing more accurate.
The strategy has few parameters and is simple to implement, suitable for quantitative traders of all skill levels. A mid to long-term holding strategy avoids interference from short-term market fluctuations.
In summary, the advantages are:
- Stronger judgment integrating Bollinger Bands and RSI
- Reduces losses from false breakouts
- Simple parameters, easy to implement
- Smaller drawdowns with mid to long-term holdings
Risk Analysis
Some risks to be aware of with this strategy include:
- Inappropriate Bollinger Bands parameter settings worsen signal quality
- Bollinger Bands tend to follow price action in trending markets
- RSI divergences affect signal accuracy
- Infrequent trading signals risk long-term losses
To control these risks:
- Optimize parameters to find best combinations
- Consider higher timeframe structure to avoid ranging markets
- Confirm RSI signals with other indicators to avoid false signals
- Adjust holding period to prevent severe losses
Optimization Directions
Further improvements:
- Test different RSI parameters
- Incorporate stop losses to better control risk
- Add other indicators to combine confirmations
- Utilize machine learning for automated parameter optimization
These enhancements can improve stability, optimize parameters, and strengthen risk management.
Conclusion
The “Bollinger Bands Strategy with RSI Filter” integrates Bollinger Bands’ overbought/oversold identification with RSI’s momentum gauge to form a robust quantitative strategy. The strategy has unique advantages in determining market opportunities across timeframes, capable of generating significant alpha.
Nonetheless, there is room for improvement via parameter optimization and risk control to adapt performance across diverse market conditions, an area warranting further research.
[/trans]
Strategy Arguments
| Argument | Default | Description |
|---|---|---|
| v_input_int_1 | 20 | length |
| v_input_float_1 | 2 | mult |
| v_input_1 | 14 | RSI Length |
| v_input_2 | 70 | RSI Overbought Level |
| v_input_3 | 30 | RSI Oversold Level |
Source (PineScript)
/*backtest
start: 2023-10-28 00:00:00
end: 2023-11-27 00:00:00
period: 1h
basePeriod: 15m
exchanges: [{"eid":"Futures_Binance","currency":"BTC_USDT"}]
*/

//@version=5
strategy("Bollinger Bands Strategy with RSI Filter", overlay=true)
source = close
length = input.int(20, minval=1)
mult = input.float(2.0, minval=0.001, maxval=50)
basis = ta.sma(source, length)
dev = mult * ta.stdev(source, length)
upper = basis + dev
lower = basis - dev

// RSI Filter
rsiLength = input(14, title="RSI Length")
rsiOverbought = input(70, title="RSI Overbought Level")
rsiOversold = input(30, title="RSI Oversold Level")
rsiValue = ta.rsi(source, rsiLength)

// Buy and Sell Conditions with RSI Filter
buyEntry = ta.crossover(source, lower) and rsiValue < rsiOversold
sellEntry = ta.crossunder(source, upper) and rsiValue > rsiOverbought

// Entry and Exit Logic
if (buyEntry)
    strategy.entry("BBandLE", strategy.long, stop=lower, oca_name="BollingerBands", comment="BBandLE")
else
    strategy.cancel(id="BBandLE")

if (sellEntry)
    strategy.entry("BBandSE", strategy.short, stop=upper, oca_name="BollingerBands", comment="BBandSE")
else
    strategy.cancel(id="BBandSE")

// Plot Bollinger Bands on the chart
plot(upper, color=color.red, title="Upper Band")
plot(lower, color=color.green, title="Lower Band")

// Plot RSI on the chart
hline(rsiOverbought, "Overbought", color=color.red)
hline(rsiOversold, "Oversold", color=color.green)
plot(rsiValue, color=color.blue, title="RSI")

// Plot buy and sell signals on the chart
plotshape(series=buyEntry, title="Buy Signal", color=color.green, style=shape.triangleup, location=location.belowbar)
plotshape(series=sellEntry, title="Sell Signal", color=color.red, style=shape.triangledown, location=location.abovebar)
Detail
https://www.fmz.com/strategy/433528
Last Modified
2023-11-28 12:12:41