
8.6 KiB
Name
基于RSI指标和200日SMA滤波器的间接强度指数策略Indirect-Strength-Index-Strategy-Based-on-RSI-Indicator-and-200-day-SMA-Filter
Author
ChaoZhang
Strategy Description
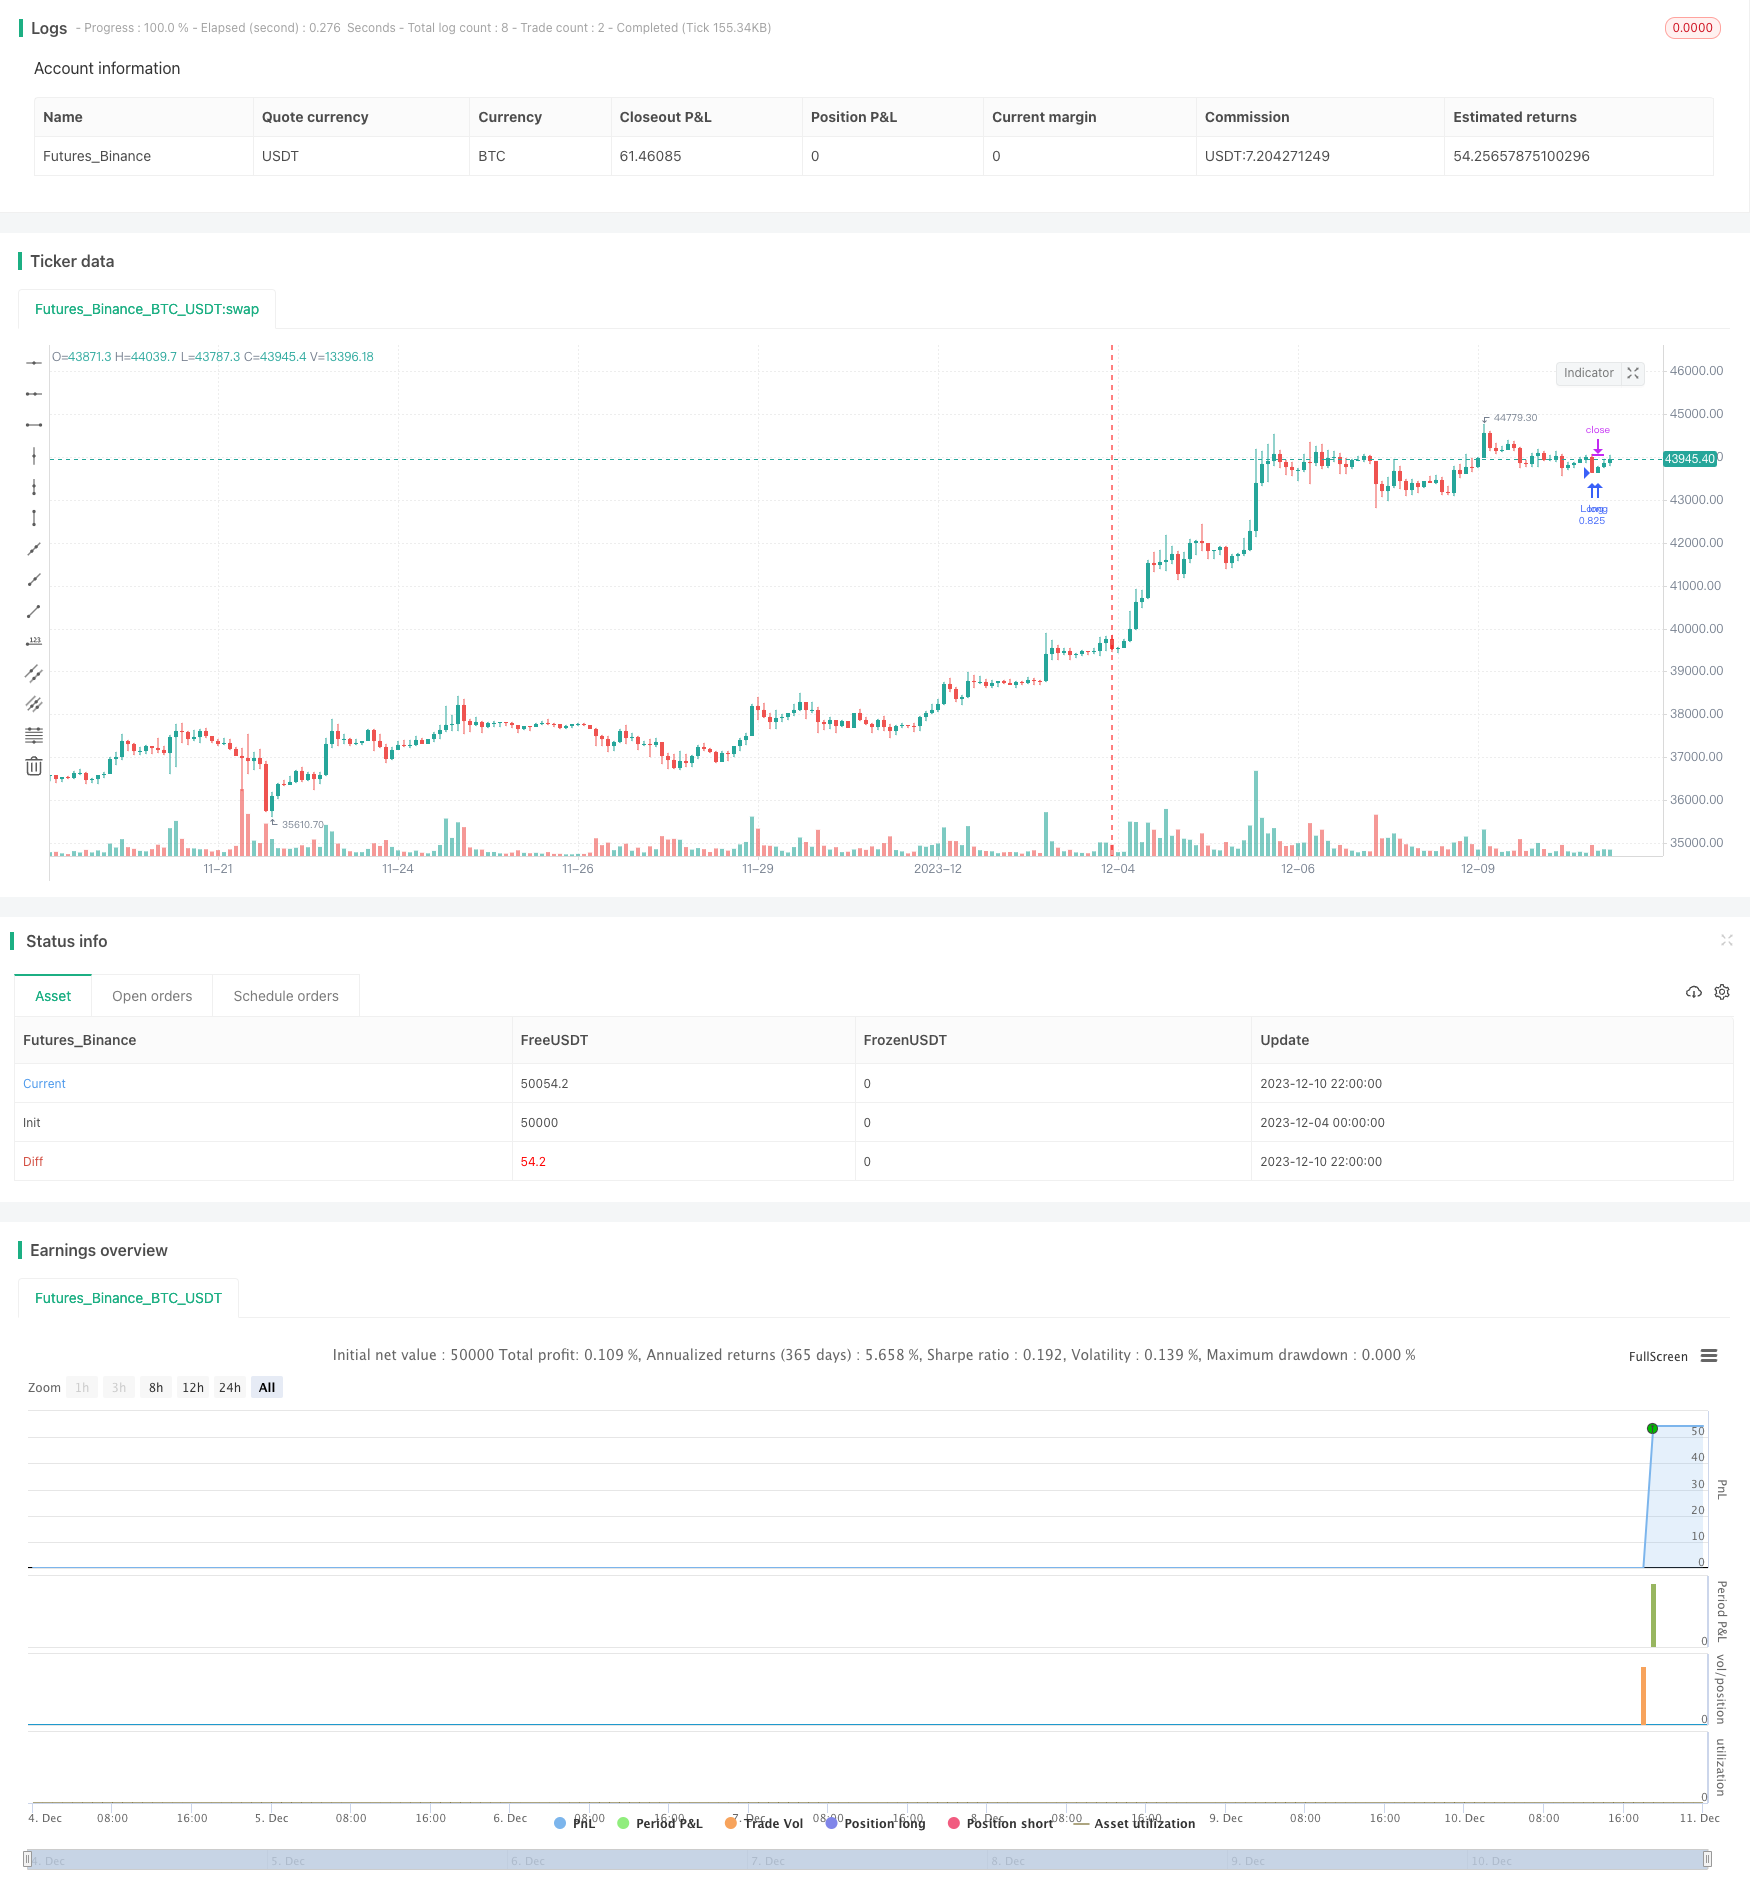 [trans]
概述
该策略主要基于相对强弱指数(RSI)指标判断过买过卖情况,以200日简单移动平均线(200 Day Simple Moving Average, SMA)作为主要的价格趋势滤波器,在确定趋势方向的基础上,利用RSI指标寻找较佳的入场和出场时机,实现盈利。相比单一使用RSI指标,该策略增加了趋势判断,可以更加准确地把握市场走势,在牛市中追涨杀跌,在熊市中反其道而行之,从而获取更高的策略收益。
策略原理
该策略主要由RSI指标和200日SMA滤波器两部分组成。
RSI指标部分主要判断价格是否进入超买超卖区域。其计算公式为:
RSI = 100 - 100 / (1 + RSI上涨天数的平均涨幅 / RSI下跌天数的平均跌幅)
根据经验参数,当RSI < 30时为超卖,>70时为超买。
200日SMA滤波器主要判断大盘趋势方向。当价格高于200日SMA时为牛市,否则为熊市。
根据以上两者综合判断,策略有如下入场和出场逻辑:
多头入场:RSI < 45 且 收盘价 > 200日SMA
多头出场:RSI > 75 且 收盘价 > 200日SMA
空头入场:RSI > 65 且 收盘价 < 200日SMA
空头出场:RSI < 25 且 收盘价 < 200日SMA
这样,就利用RSI指标的精确判断在大趋势中寻找较优入场和出场点,进而获取较高策略收益。
策略优势分析
该策略最大的优势在于利用RSI指标和200日SMA滤波器的配合,使得策略更加稳定和精确:
- 200日SMA有效判断大盘趋势,避免了单一RSI指标的误判
- RSI指标可以在大盘趋势中寻找较佳入场出场点
- 策略操作简单,容易实施
此外,该策略还具有如下优势:
- 适用于各种品种,包括股票指数、数字货币和贵金属
- 资金利用效率高
- 可谨慎加入止损,有效控制单笔损失
策略风险分析
该策略也存在一些风险:
- 大盘发生突发性调整时,可能产生较大亏损
- RSI指标和200日SMA指标存在一定程度的滞后
- 交易频繁,交易成本较高
为控制这些风险,可采取如下措施:
- 适当调整仓位管理,防范突发事件的冲击
- 优化RSI和SMA的参数,降低滞后概率
- 适当调整交易频率,降低交易成本
策略优化方向
该策略可从以下几个方面进行优化:
- 动态调整RSI参数,根据市场波动程度选择合适的参数
- 测试其他均线指标如EMA是否能带来更好效果
- 增加自动止损机制
- 增加仓位管理模块,根据资金规模动态调整仓位
- 优化入场出场逻辑,测试能否带来更好收益
总结
该策略整体运行效果良好,具有判断准确、操作简单、适用范围广等优点。加入止损和仓位管理后,可谨慎实盘运行。后续可从参数优化、止损优化、仓位管理等方面进行策略增强,使策略效果更加出色。
||
Overview
This strategy mainly uses the Relative Strength Index (RSI) indicator to judge overbought and oversold situations, and uses the 200-day Simple Moving Average (200 Day SMA) as the main price trend filter. On the basis of determining the trend direction, it uses the RSI indicator to find better entry and exit timing to achieve profitability. Compared with using the RSI indicator alone, this strategy increases trend judgment and can more accurately grasp market trends, chase rises and sell declines in a bull market, and do the opposite in a bear market, thereby obtaining higher strategy returns.
Strategy Principle
The strategy consists mainly of two parts: the RSI indicator and the 200-day SMA filter.
The RSI indicator section mainly judges whether the price has entered the overbought or oversold zone. Its calculation formula is:
RSI = 100 - 100 / (1 + Average gain of up days in RSI / Average loss of down days in RSI)
According to empirical parameters, when RSI < 30, it is oversold; when >70, it is overbought.
The 200-day SMA filter mainly judges the overall market trend direction. When the price is above the 200-day SMA, it is a bull market, otherwise it is a bear market.
Based on the above two judgments, the strategy has the following entry and exit logic:
Long entry: RSI < 45 and Close price > 200-day SMA
Long exit: RSI > 75 and Close price > 200-day SMA
Short entry: RSI > 65 and Close price < 200-day SMA
Short exit: RSI < 25 and Close price < 200-day SMA
Thus, the strategy uses the precise judgment of the RSI indicator to find better entry and exit points in the overall trend and thereby achieve higher returns.
Advantage Analysis
The biggest advantage of this strategy is using the combination of the RSI indicator and 200-day SMA filter to make the strategy more stable and precise:
- The 200-day SMA effectively judges the overall market trend and avoids misjudgments of single RSI indicators
- The RSI indicator can find better entry and exit points within the overall market trend
- The strategy operation is simple and easy to implement
In addition, the strategy also has the following advantages:
- Applicable to various products including stock indices, cryptocurrencies and precious metals
- High capital utilization efficiency
- Can cautiously add a stop loss to effectively control single losses
Risk Analysis
The strategy also has some risks:
- Sudden adjustments in the overall market may lead to greater losses
- There is some degree of lag in RSI and SMA indicators
- High trading frequency leads to higher trading costs
To control these risks, the following measures can be taken:
- Adjust position sizing appropriately to guard against impacts of unexpected events
- Optimize RSI and SMA parameters to reduce lag probability
- Adjust trading frequency appropriately to reduce trading costs
Optimization Directions
The strategy can be optimized in the following aspects:
- Dynamically adjust RSI parameters based on market volatility
- Test whether other moving average indicators like EMA can bring better results
- Increase automatic stop loss mechanism
- Add position sizing module to dynamically adjust positions based on capital
- Optimize entry and exit logic to test if better returns can be achieved
Conclusion
The overall performance of this strategy is good, with the advantages of accurate judgment, simple operation, and wide applicability. After adding stop loss and position sizing, it can be carefully run in live trading. Follow-up aspects like parameter optimization, stop loss optimization, position sizing can further enhance the strategy.
[/trans]
Strategy Arguments
| Argument | Default | Description |
|---|---|---|
| v_input_int_1 | 14 | RSI lenght |
| v_input_int_2 | 200 | SMA Lenght |
| v_input_float_1 | 5 | stop loss |
Source (PineScript)
/*backtest
start: 2023-12-04 00:00:00
end: 2023-12-11 00:00:00
period: 2h
basePeriod: 15m
exchanges: [{"eid":"Futures_Binance","currency":"BTC_USDT"}]
*/

// This work is licensed under a Attribution-NonCommercial-ShareAlike 4.0 International (CC BY-NC-SA 4.0) https://creativecommons.org/licenses/by-nc-sa/4.0/
// © LuxAlgo

//@version=5

strategy('Relative Strength Index Extremes with 200-Day Moving Average Filte', overlay=true, pyramiding=1, initial_capital=10000, default_qty_type=strategy.cash, default_qty_value=36000, calc_on_order_fills=false, slippage=0, commission_type=strategy.commission.percent, commission_value=0.01)

// Rsi
rsi_lenght = input.int(14, title='RSI lenght', minval=0)
rsi_up = ta.rma(math.max(ta.change(close), 0), rsi_lenght)
rsi_down = ta.rma(-math.min(ta.change(close), 0), rsi_lenght)
rsi_value = rsi_down == 0 ? 100 : rsi_up == 0 ? 0 : 100 - 100 / (1 + rsi_up / rsi_down)


//Sma
Length1 = input.int(200, title='  SMA Lenght', minval=1)
SMA1 = ta.sma(close, Length1)

//Strategy Logic

Long = rsi_value < 45 and close > SMA1
Long_exit = rsi_value > 75 and close > SMA1

Short = rsi_value > 65 and close < SMA1
Short_exit = rsi_value < 25 and close < SMA1


if Long
    strategy.entry('Long', strategy.long)

if Short
    strategy.entry('Short', strategy.short)

strategy.close_all(Long_exit or Short_exit)

pera(pcnt) =>
    strategy.position_size != 0 ? math.round(pcnt / 100 * strategy.position_avg_price / syminfo.mintick) : float(na)
stoploss = input.float(title=' stop loss', defval=5, minval=0.5)
los = pera(stoploss)

strategy.exit('SL', loss=los)


//by wielkieef
Detail
https://www.fmz.com/strategy/435127
Last Modified
2023-12-12 15:26:06