
6.8 KiB
Name
基于RSI和MACD的低风险稳健型加密货币高频交易策略-Low-Risk-Stable-Cryptocurrency-High-Frequency-Trading-Strategy-Based-on-RSI-and-MACD
Author
ChaoZhang
Strategy Description
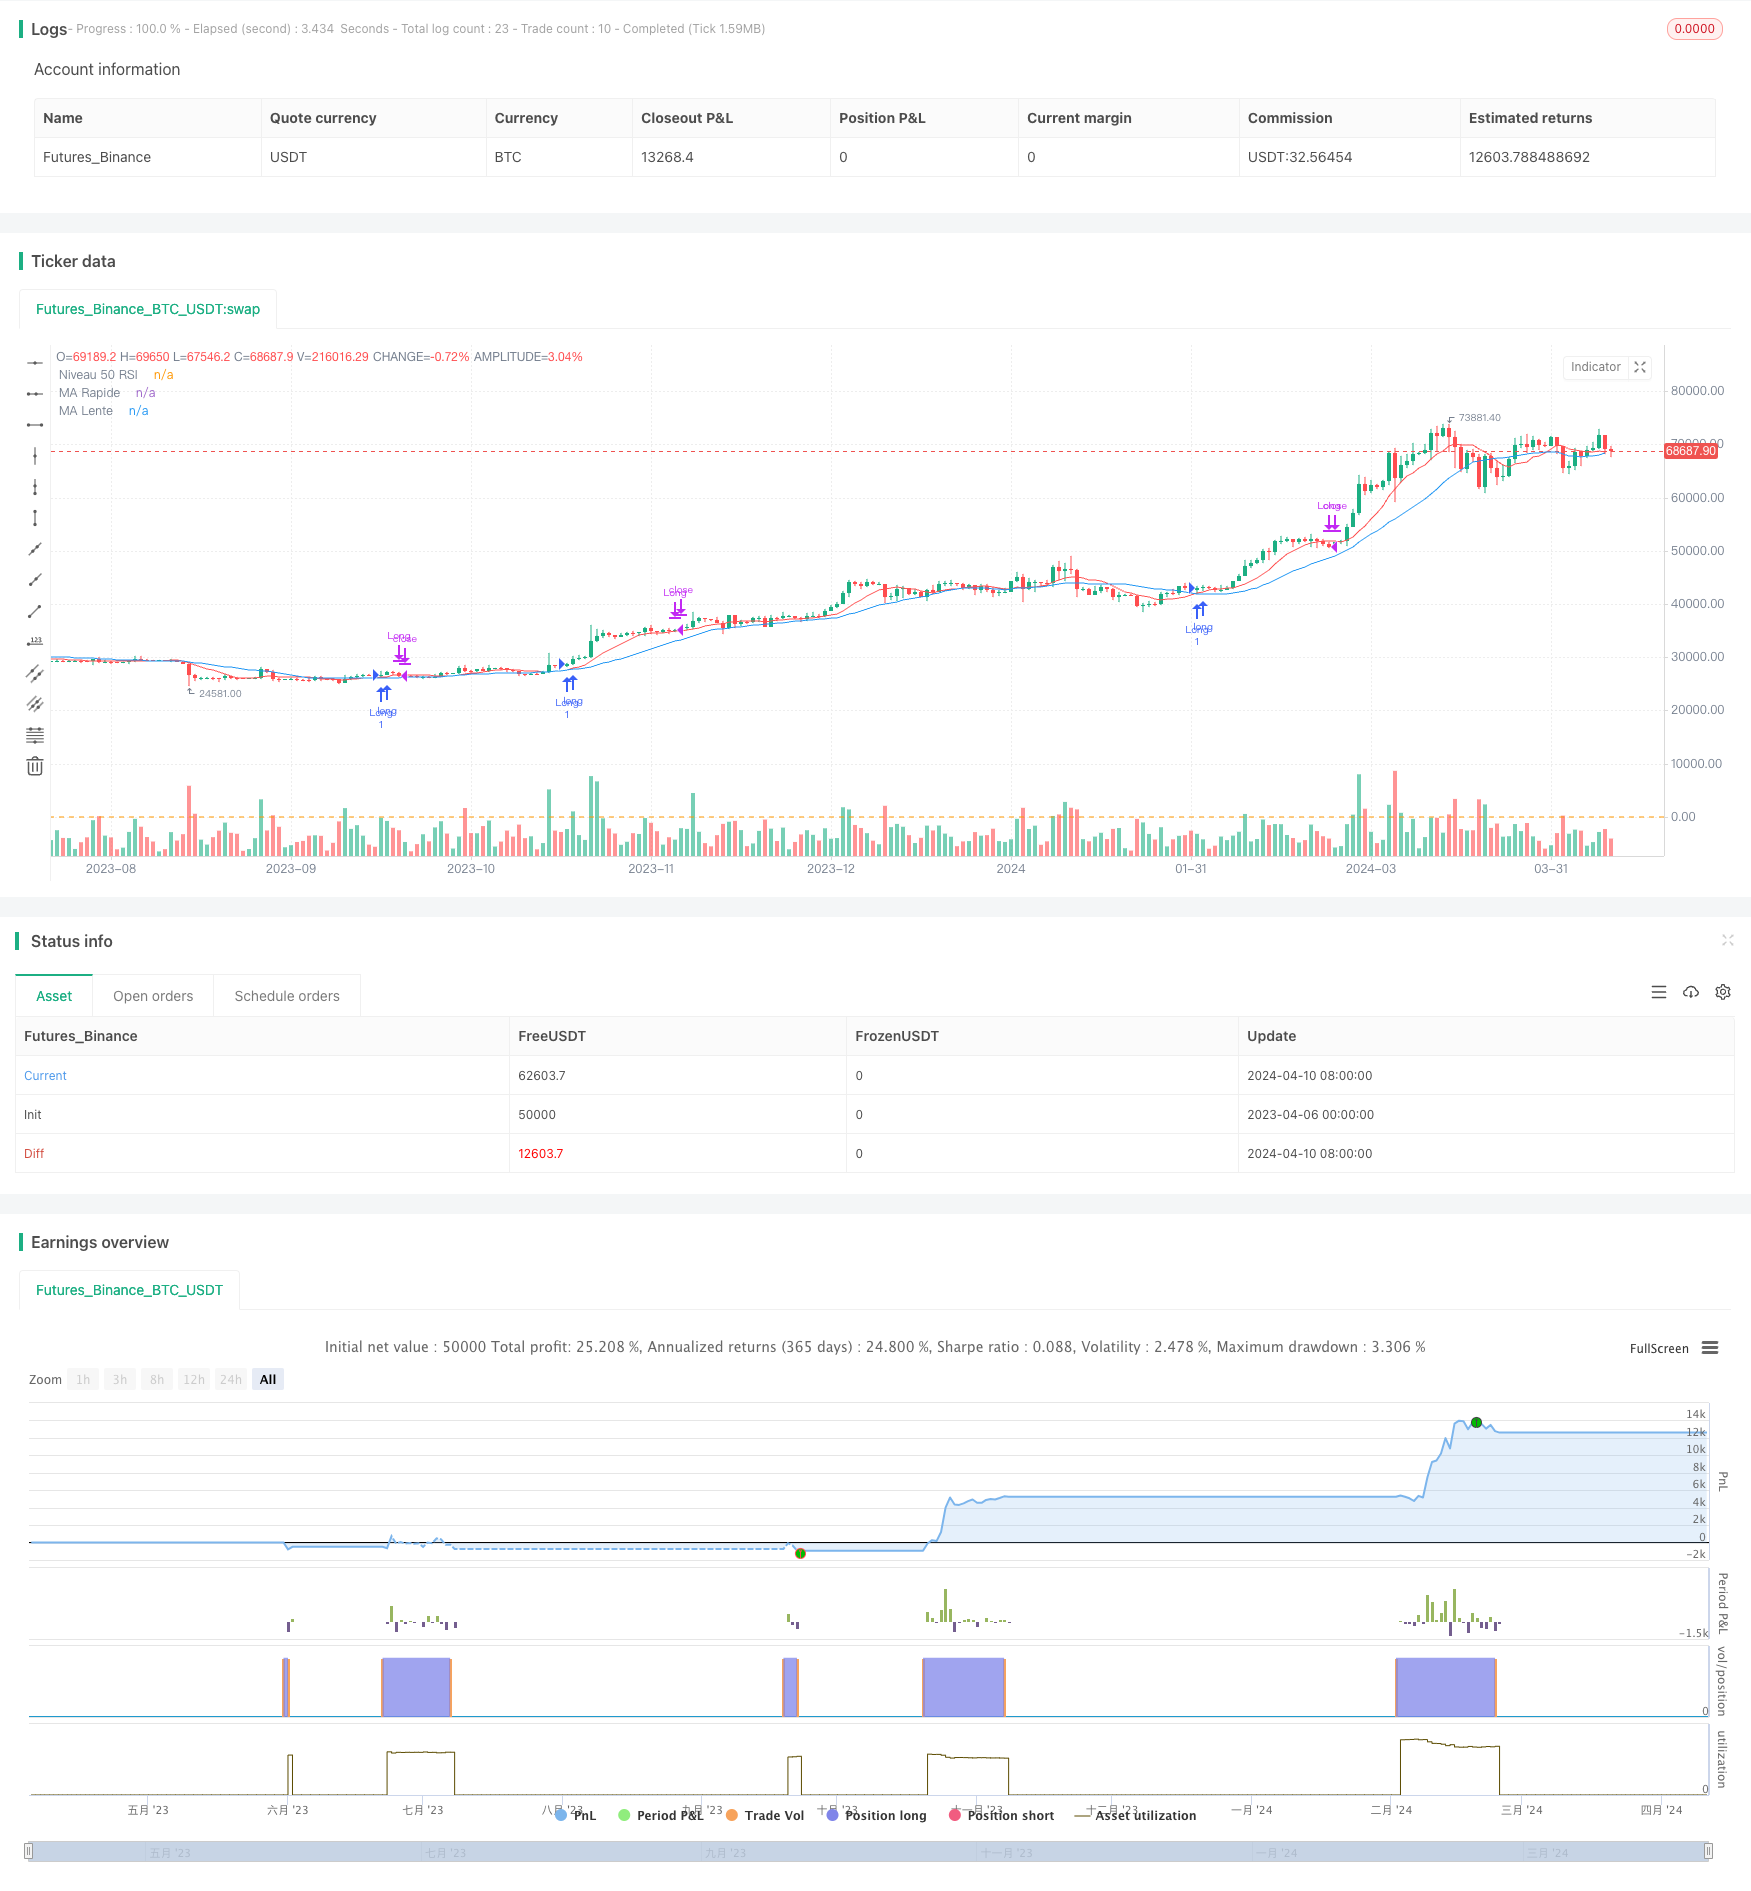 [trans]
概述
该策略是一个基于相对强弱指数(RSI)和移动平均线收敛散度(MACD)指标的加密货币高频交易策略。它使用两条不同周期的移动平均线(MA)来判断趋势,并结合RSI和MACD指标来确认入场和出场信号。该策略旨在实现低风险、稳健的盈利。
策略原理
- 计算快速MA和慢速MA,分别使用9个周期和21个周期。
- 计算14个周期的RSI指标。
- 计算MACD指标,快线周期为12,慢线周期为26,信号线周期为9。
- 当快速MA上穿慢速MA,且RSI大于50,MACD快线大于信号线时,开多单。
- 当快速MA下穿慢速MA,或RSI小于50,或MACD快线小于信号线时,平多单。
策略优势
- 结合多个指标确认信号,提高入场准确性,降低假信号风险。
- 使用不同周期MA判断趋势,适应不同市场状态。
- 止损条件严格,一旦趋势反转或动能减弱即平仓,有效控制回撤。
- 高频交易,交易次数多,单次盈亏比适中,积少成多,稳健增益。
策略风险
- 在震荡市中,MA交叉可能频繁发生,导致交易次数过多,手续费成本增加。
- RSI和MACD指标都是滞后指标,可能出现信号延迟,错失最佳入场机会。
- 策略参数固定,缺乏动态调整,可能无法适应市场变化。
策略优化方向
- 引入波动率指标,如ATR,在高波动率市场中提高止损,降低交易频率。
- 对RSI和MACD指标的参数进行优化,找到最佳参数组合,提高信号准确性。
- 加入仓位管理,根据市场趋势强度和账户收益率动态调整仓位,提高收益风险比。
- 结合其他类型指标,如量价指标,形态指标等,构建多因子模型,提高策略稳健性。
总结
该策略是一个基于MA、RSI、MACD指标的高频交易策略,通过严格的信号确认和止损条件,在趋势型市场中可以获得稳健的低风险收益。但在震荡市中可能面临频繁交易的问题,同时也存在信号滞后的风险。未来可以从优化参数、动态仓位管理、多因子模型等方面对策略进行优化,以提高适应性和收益风险比。
||
Overview
This strategy is a cryptocurrency high-frequency trading strategy based on the Relative Strength Index (RSI) and Moving Average Convergence Divergence (MACD) indicators. It uses two moving averages (MA) with different periods to determine the trend, and combines RSI and MACD indicators to confirm entry and exit signals. The strategy aims to achieve low-risk, stable profits.
Strategy Principle
- Calculate the fast MA and slow MA using 9 and 21 periods respectively.
- Calculate the RSI indicator with a 14-period.
- Calculate the MACD indicator with a fast period of 12, a slow period of 26, and a signal period of 9.
- When the fast MA crosses above the slow MA, and RSI is greater than 50, and the MACD fast line is greater than the signal line, open a long position.
- When the fast MA crosses below the slow MA, or RSI is less than 50, or the MACD fast line is less than the signal line, close the long position.
Strategy Advantages
- Combining multiple indicators to confirm signals, improving entry accuracy and reducing false signal risk.
- Using MAs with different periods to determine trends, adapting to different market conditions.
- Strict stop-loss conditions, closing positions once the trend reverses or momentum weakens, effectively controlling drawdowns.
- High-frequency trading with multiple trades, moderate profit/loss ratio per trade, accumulating small gains for steady growth.
Strategy Risks
- In a choppy market, MA crossovers may occur frequently, leading to excessive trading and increased transaction costs.
- Both RSI and MACD are lagging indicators, which may result in delayed signals and missed optimal entry opportunities.
- The strategy parameters are fixed and lack dynamic adjustment, which may not adapt to market changes.
Strategy Optimization Directions
- Introduce volatility indicators, such as ATR, to increase stop-loss levels and reduce trading frequency in high-volatility markets.
- Optimize the parameters of RSI and MACD indicators to find the best combination and improve signal accuracy.
- Incorporate position management, dynamically adjusting positions based on market trend strength and account profitability to improve risk-adjusted returns.
- Combine other types of indicators, such as volume-price indicators and pattern indicators, to build a multi-factor model and enhance strategy robustness.
Summary
This strategy is a high-frequency trading strategy based on MA, RSI, and MACD indicators. By using strict signal confirmation and stop-loss conditions, it can achieve stable, low-risk returns in trending markets. However, it may face frequent trading issues in choppy markets and also has the risk of lagging signals. Future optimizations can be made in areas such as parameter optimization, dynamic position management, and multi-factor models to improve adaptability and risk-adjusted returns. [/trans]
Strategy Arguments
| Argument | Default | Description |
|---|---|---|
| v_input_1 | 9 | Longueur MA Rapide |
| v_input_2 | 21 | Longueur MA Lente |
| v_input_3 | 14 | Longueur RSI |
| v_input_4 | 12 | MACD Rapide |
| v_input_5 | 26 | MACD Lent |
| v_input_6 | 9 | Signal MACD |
Source (PineScript)
/*backtest
start: 2023-04-06 00:00:00
end: 2024-04-11 00:00:00
period: 1d
basePeriod: 1h
exchanges: [{"eid":"Futures_Binance","currency":"BTC_USDT"}]
*/

//@version=5
strategy("Scalping Amélioré avec RSI et MACD", overlay=true)

// Paramètres des indicateurs
fastLength = input(9, title="Longueur MA Rapide")
slowLength = input(21, title="Longueur MA Lente")
rsiLength = input(14, title="Longueur RSI")
macdFast = input(12, title="MACD Rapide")
macdSlow = input(26, title="MACD Lent")
macdSignal = input(9, title="Signal MACD")

// Calcul des indicateurs
fastMA = ta.sma(close, fastLength)
slowMA = ta.sma(close, slowLength)
rsi = ta.rsi(close, rsiLength)
[macdLine, signalLine, _] = ta.macd(close, macdFast, macdSlow, macdSignal)

// Conditions d'entrée
longCondition = ta.crossover(fastMA, slowMA) and rsi > 50 and macdLine > signalLine
if (longCondition)
    strategy.entry("Long", strategy.long)

// Conditions de sortie
exitCondition = ta.crossunder(fastMA, slowMA) or rsi < 50 or macdLine < signalLine
if (exitCondition)
    strategy.close("Long")

// Affichage des indicateurs
plot(fastMA, color=color.red, title="MA Rapide")
plot(slowMA, color=color.blue, title="MA Lente")
hline(50, "Niveau 50 RSI", color=color.orange)
Detail
https://www.fmz.com/strategy/448066
Last Modified
2024-04-12 16:54:53