
13 KiB
Name
基于RSI和双均线的1小时趋势追踪策略-RSI-and-Dual-Moving-Average-Based-1-Hour-Trend-Following-Strategy
Author
ChaoZhang
Strategy Description
 [trans]
概述
该策略采用相对强弱指数(RSI)和两条简单移动平均线(SMA)作为主要指标,在1小时时间框架内产生多头和空头信号。通过放宽RSI和SMA的条件设置,提高了信号触发的频率。同时,策略还利用平均真实波动幅度(ATR)指标进行风险管理,动态设置止盈和止损位。
该策略的主要思路如下:
- 使用RSI指标识别潜在的超买和超卖状态,分别作为做多和做空的信号。
- 使用快速SMA和慢速SMA的交叉来判断潜在的上涨趋势(金叉)和下跌趋势(死叉)。
- 当RSI和SMA同时满足做多或做空条件时,开仓建立相应方向的头寸。
- 利用ATR指标计算动态止盈和止损位,控制每笔交易的风险。
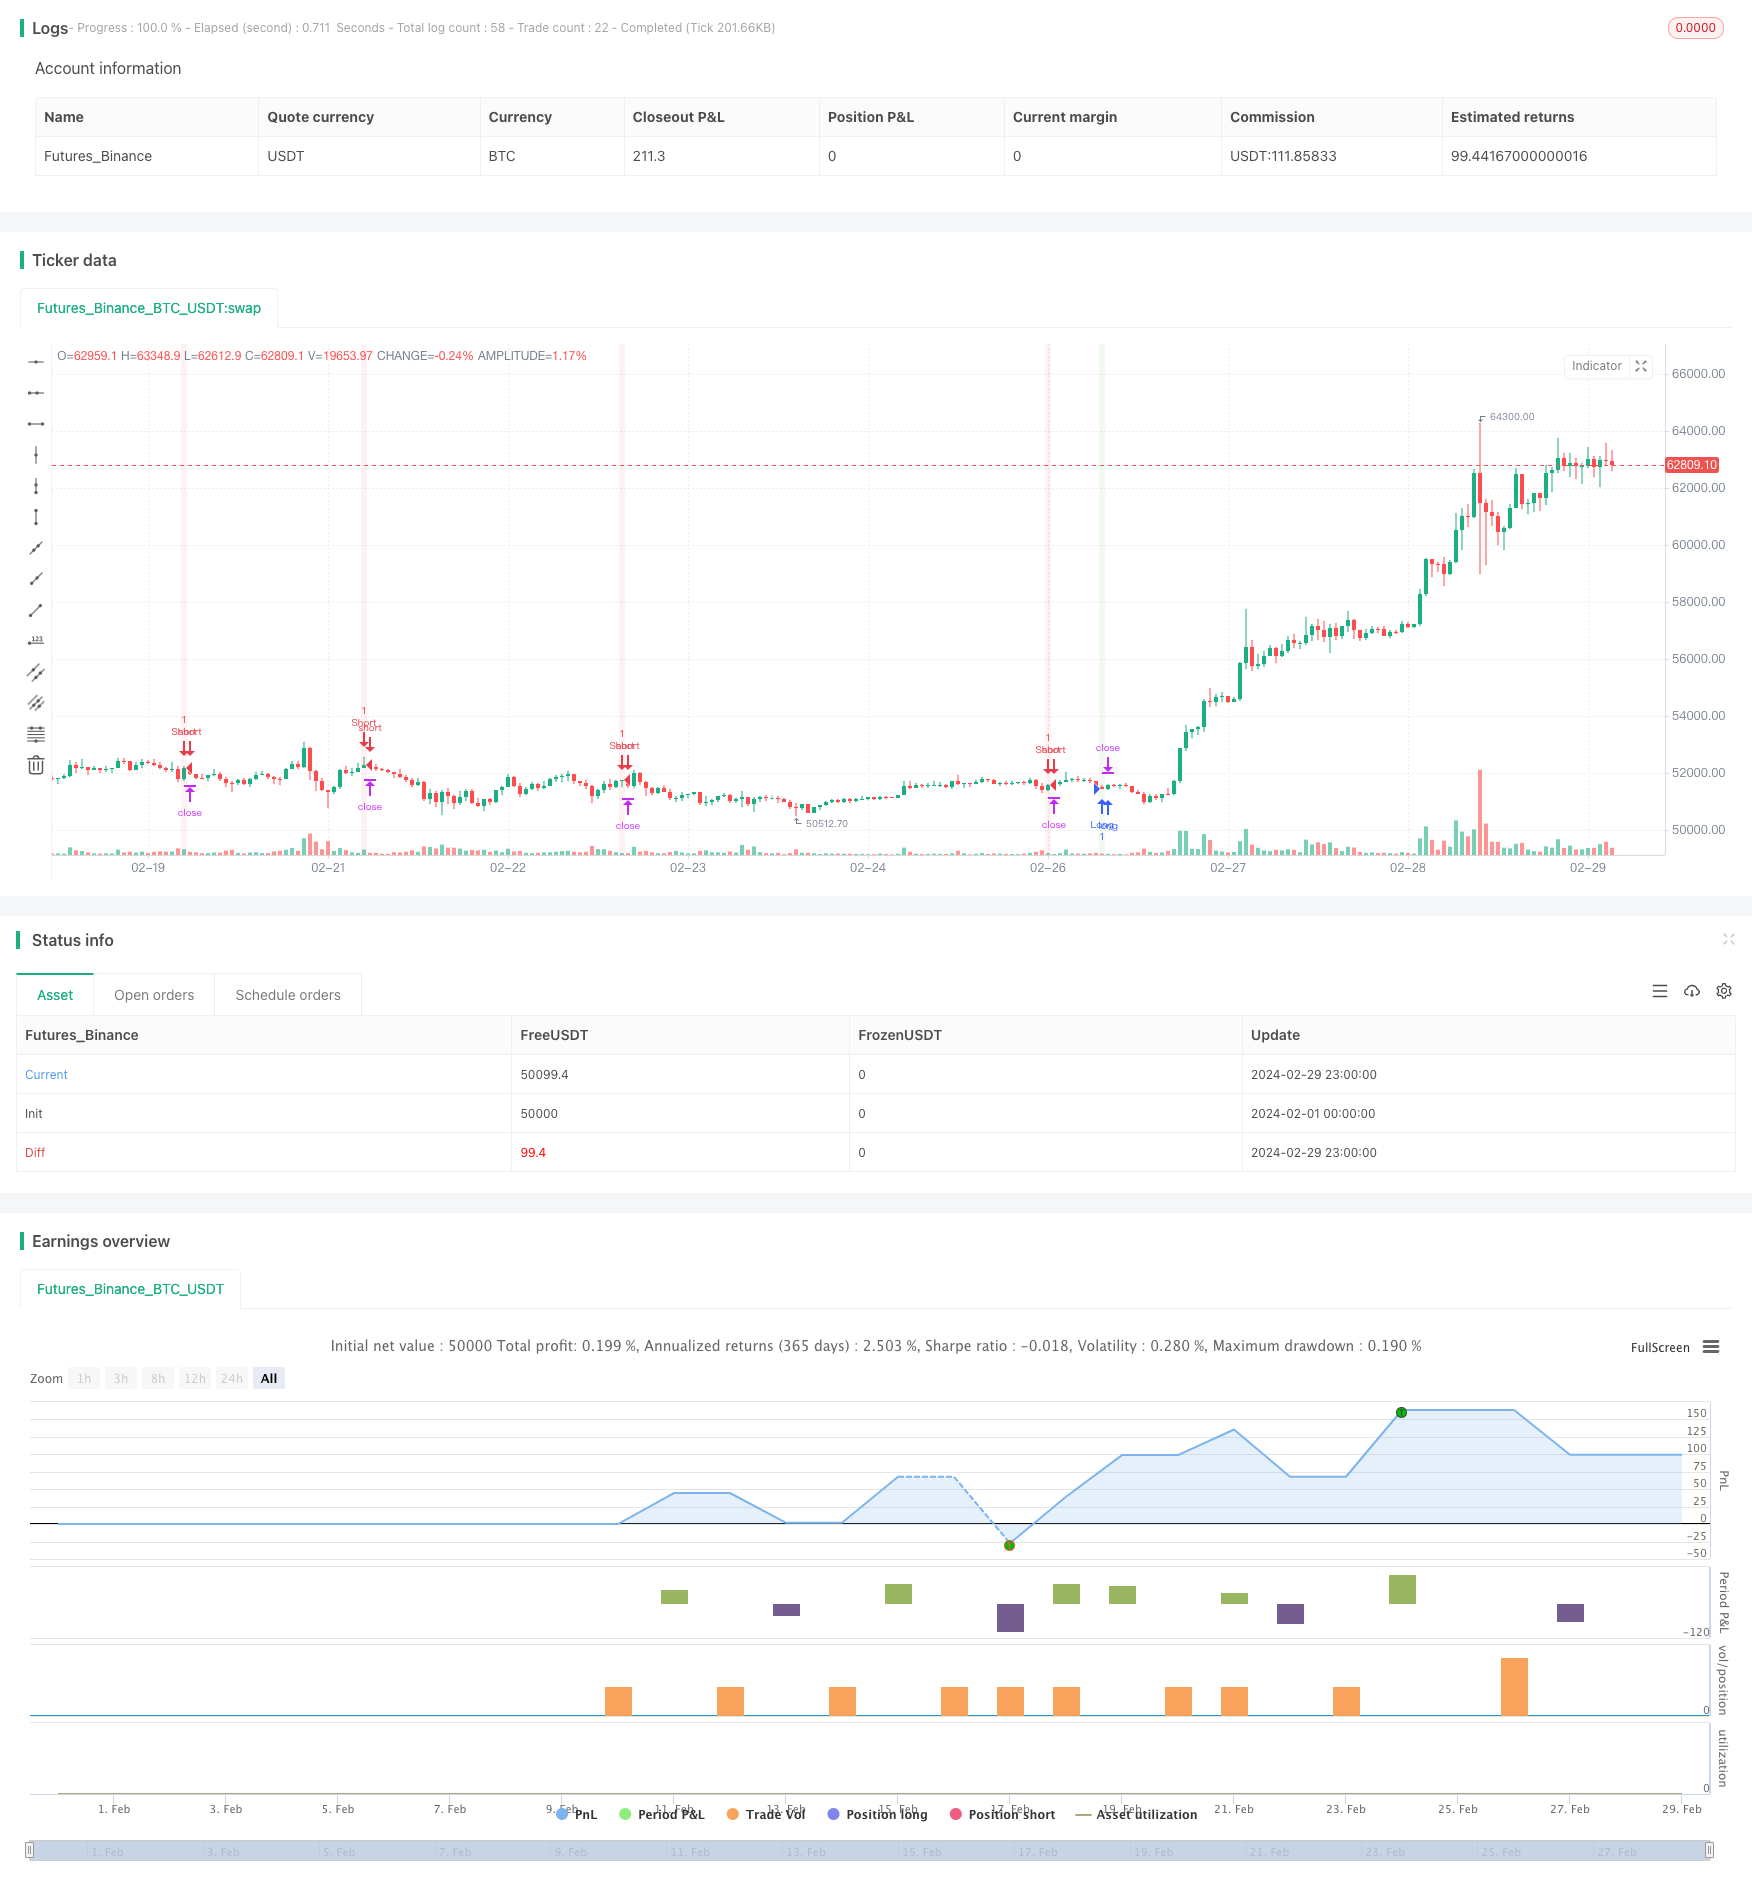
- 通过图表背景色的变化来直观显示策略信号的触发情况,便于调试和理解策略逻辑。
策略原理
- RSI指标:当RSI低于50时,表明市场可能处于超卖状态,价格有上涨的潜力,因此触发做多信号;当RSI高于50时,表明市场可能处于超买状态,价格有下跌的潜力,因此触发做空信号。
- 双均线交叉:当快速SMA上穿慢速SMA时(金叉),表明潜在的上涨趋势,触发做多信号;当快速SMA下穿慢速SMA时(死叉),表明潜在的下跌趋势,触发做空信号。
- 开仓条件:只有当RSI和双均线同时满足做多或做空条件时,才会开仓建立相应方向的头寸,以提高信号的可靠性。
- 风险管理:使用ATR指标计算动态止盈和止损位,止盈位设为开仓价格加/减ATR的1.5倍,止损位设为开仓价格加/减ATR的1倍。这样可以根据市场波动情况动态调整止盈止损,控制每笔交易的风险。
策略优势
- 适应性强:通过放宽RSI和双均线的条件设置,策略可以在1小时时间框架内适应不同的市场状态,捕捉更多的交易机会。
- 风险管理:利用ATR指标动态设置止盈和止损位,可以根据市场波动情况灵活调整,有效控制每笔交易的风险敞口。
- 简单易用:策略逻辑清晰,使用的指标简单易懂,便于理解和实现。
- 视觉辅助:通过图表背景色的变化直观显示策略信号,便于调试和优化。
策略风险
- 频繁交易:由于放宽了RSI和双均线的条件设置,策略可能会产生较为频繁的交易信号,导致交易成本增加,影响整体收益。
- 盘整市场:在波动较小的盘整市场中,RSI和双均线可能会产生频繁的虚假信号,导致策略表现不佳。
- 趋势缺失:策略主要依赖RSI和双均线来判断趋势,但在某些情况下,市场可能没有明显的趋势特征,导致策略信号失效。
- 参数敏感性:策略的表现可能对RSI、SMA和ATR等指标的参数设置较为敏感,不同的参数组合可能导致策略表现差异较大。
策略优化方向
- 参数优化:对RSI、SMA和ATR等指标的参数进行优化,找到在历史数据上表现最佳的参数组合,提高策略的稳定性和可靠性。
- 信号过滤:引入其他技术指标或市场情绪指标,对RSI和双均线产生的信号进行二次确认,减少虚假信号的出现。
- 动态权重调整:根据市场趋势的强度动态调整RSI和双均线信号的权重,在趋势明显时给予更高的权重,在盘整市场中降低权重,提高策略的适应性。
- 止盈止损优化:对ATR倍数进行优化,找到最佳的止盈止损比例,提高策略的风险调整后收益。同时,可以考虑引入其他止盈止损方法,如基于支撑/阻力位的止盈止损,或者基于时间的止盈止损等。
- 多时间框架分析:结合其他时间框架(如4小时、日线等)的信号,对1小时时间框架的信号进行过滤和确认,提高信号的可靠性。
总结
该策略通过结合RSI和双均线两个简单易用的技术指标,在1小时时间框架内产生趋势追踪信号,同时利用ATR指标进行动态风险管理。策略逻辑清晰,易于理解和实现,适合初学者学习和使用。但是,策略也存在一些潜在的风险,如频繁交易、盘整市场表现不佳、趋势缺失等。因此,在实际应用中,需要对策略进行进一步的优化和改进,如参数优化、信号过滤、动态权重调整、止盈止损优化和多时间框架分析等,以提高策略的稳健性和盈利能力。总的来说,该策略可以作为一个基础模板,为traders提供一个可行的思路和方向,但还需要根据自己的经验和市场特点进行个性化的调整和优化。
||
Overview
The strategy uses the Relative Strength Index (RSI) and two Simple Moving Averages (SMAs) as the main indicators to generate long and short signals within a 1-hour timeframe. By liberalizing the conditions for RSI and SMAs, the frequency of signal triggers is increased. Additionally, the strategy employs the Average True Range (ATR) indicator for risk management, dynamically setting take-profit and stop-loss levels.
The main ideas of the strategy are as follows:
- Use the RSI indicator to identify potential overbought and oversold conditions as signals for going long and short, respectively.
- Use the crossover of fast SMA and slow SMA to determine potential uptrends (golden cross) and downtrends (death cross).
- Open positions in the corresponding direction when both RSI and SMA conditions are met for going long or short.
- Utilize the ATR indicator to calculate dynamic take-profit and stop-loss levels, controlling the risk of each trade.
- Visually display the triggering of strategy signals through changes in the chart background color, facilitating debugging and understanding of the strategy logic.
Strategy Principles
- RSI Indicator: When RSI is below 50, it indicates that the market may be oversold, and prices have the potential to rise, thus triggering a long signal. When RSI is above 50, it indicates that the market may be overbought, and prices have the potential to fall, thus triggering a short signal.
- Dual Moving Average Crossover: When the fast SMA crosses above the slow SMA (golden cross), it indicates a potential uptrend and triggers a long signal. When the fast SMA crosses below the slow SMA (death cross), it indicates a potential downtrend and triggers a short signal.
- Entry Conditions: Positions are only opened in the corresponding direction when both RSI and dual moving average conditions are met for going long or short, improving the reliability of signals.
- Risk Management: The ATR indicator is used to calculate dynamic take-profit and stop-loss levels. The take-profit level is set at 1.5 times the ATR above/below the entry price, and the stop-loss level is set at 1 times the ATR above/below the entry price. This allows for adjusting the take-profit and stop-loss levels based on market volatility, controlling the risk of each trade.
Strategy Advantages
- Adaptability: By liberalizing the conditions for RSI and dual moving averages, the strategy can adapt to different market conditions within a 1-hour timeframe and capture more trading opportunities.
- Risk Management: Utilizing the ATR indicator to dynamically set take-profit and stop-loss levels allows for flexible adjustments based on market volatility, effectively controlling the risk exposure of each trade.
- Simplicity and Ease of Use: The strategy logic is clear, and the indicators used are simple and easy to understand, facilitating comprehension and implementation.
- Visual Aid: The triggering of strategy signals is visually displayed through changes in the chart background color, aiding in debugging and optimization.
Strategy Risks
- Frequent Trading: Due to the liberalized conditions for RSI and dual moving averages, the strategy may generate relatively frequent trading signals, leading to increased transaction costs and affecting overall profitability.
- Sideways Market: In low-volatility sideways markets, RSI and dual moving averages may produce frequent false signals, resulting in poor strategy performance.
- Lack of Trends: The strategy primarily relies on RSI and dual moving averages to determine trends, but in some cases, the market may lack clear trend characteristics, causing strategy signals to be ineffective.
- Parameter Sensitivity: The performance of the strategy may be sensitive to the parameter settings of RSI, SMAs, and ATR. Different parameter combinations may lead to significant differences in strategy performance.
Strategy Optimization Directions
- Parameter Optimization: Optimize the parameters of RSI, SMAs, and ATR to find the best-performing parameter combinations on historical data, improving the stability and reliability of the strategy.
- Signal Filtering: Introduce other technical indicators or market sentiment indicators to provide secondary confirmation of signals generated by RSI and dual moving averages, reducing the occurrence of false signals.
- Dynamic Weight Adjustment: Dynamically adjust the weights of RSI and dual moving average signals based on the strength of market trends, assigning higher weights when trends are evident and lower weights in sideways markets, enhancing the adaptability of the strategy.
- Take-Profit and Stop-Loss Optimization: Optimize the ATR multiplier to find the optimal take-profit and stop-loss ratios, improving the risk-adjusted returns of the strategy. Additionally, consider introducing other take-profit and stop-loss methods, such as support/resistance-based or time-based methods.
- Multi-Timeframe Analysis: Combine signals from other timeframes (e.g., 4-hour, daily) to filter and confirm signals in the 1-hour timeframe, improving signal reliability.
Summary
The strategy combines two simple and easy-to-use technical indicators, RSI and dual moving averages, to generate trend-following signals within a 1-hour timeframe while utilizing the ATR indicator for dynamic risk management. The strategy logic is clear and easy to understand and implement, making it suitable for beginners to learn and use. However, the strategy also has some potential risks, such as frequent trading, poor performance in sideways markets, and lack of trends. Therefore, in practical applications, the strategy needs to be further optimized and improved, such as parameter optimization, signal filtering, dynamic weight adjustment, take-profit and stop-loss optimization, and multi-timeframe analysis, to enhance the robustness and profitability of the strategy. Overall, the strategy can serve as a basic template, providing traders with a feasible idea and direction, but it still requires personalized adjustments and optimizations based on individual experience and market characteristics. [/trans]
Strategy Arguments
| Argument | Default | Description |
|---|---|---|
| v_input_int_1 | 14 | RSI Length |
| v_input_int_2 | 50 | RSI Entry Level |
| v_input_int_3 | 10 | Fast MA Length |
| v_input_int_4 | 21 | Slow MA Length |
| v_input_int_5 | 14 | ATR Length |
| v_input_float_1 | 1.5 | ATR Multiplier for SL |
| v_input_float_2 | 2 | Risk/Reward Multiplier |
Source (PineScript)
/*backtest
start: 2024-02-01 00:00:00
end: 2024-02-29 23:59:59
period: 1h
basePeriod: 15m
exchanges: [{"eid":"Futures_Binance","currency":"BTC_USDT"}]
*/

//@version=5
strategy("Debugged 1H Strategy with Liberal Conditions", shorttitle="1H Debug", overlay=true, pyramiding=0)

// Parameters
rsiLength = input.int(14, title="RSI Length")
rsiLevel = input.int(50, title="RSI Entry Level") // More likely to be met than the previous 70
fastLength = input.int(10, title="Fast MA Length")
slowLength = input.int(21, title="Slow MA Length")
atrLength = input.int(14, title="ATR Length")
atrMultiplier = input.float(1.5, title="ATR Multiplier for SL")
riskRewardMultiplier = input.float(2, title="Risk/Reward Multiplier")

// Indicators
rsi = ta.rsi(close, rsiLength)
fastMA = ta.sma(close, fastLength)
slowMA = ta.sma(close, slowLength)
atr = ta.atr(atrLength)

// Trades
longCondition = ta.crossover(fastMA, slowMA) and rsi < rsiLevel
shortCondition = ta.crossunder(fastMA, slowMA) and rsi > rsiLevel

// Entry and Exit Logic
if (longCondition)
    strategy.entry("Long", strategy.long)
    strategy.exit("Exit Long", "Long", profit=atrMultiplier * atr, loss=atr)

if (shortCondition)
    strategy.entry("Short", strategy.short)
    strategy.exit("Exit Short", "Short", profit=atrMultiplier * atr, loss=atr)

// Debugging: Visualize when conditions are met
bgcolor(longCondition ? color.new(color.green, 90) : na)
bgcolor(shortCondition ? color.new(color.red, 90) : na)
Detail
https://www.fmz.com/strategy/446523
Last Modified
2024-03-29 11:05:04