
10 KiB
Name
基于RSI信号线交叉的多周期趋势跟踪交易策略-Multi-Period-RSI-Signal-Line-Crossover-Trend-Following-Strategy
Author
ChaoZhang
Strategy Description
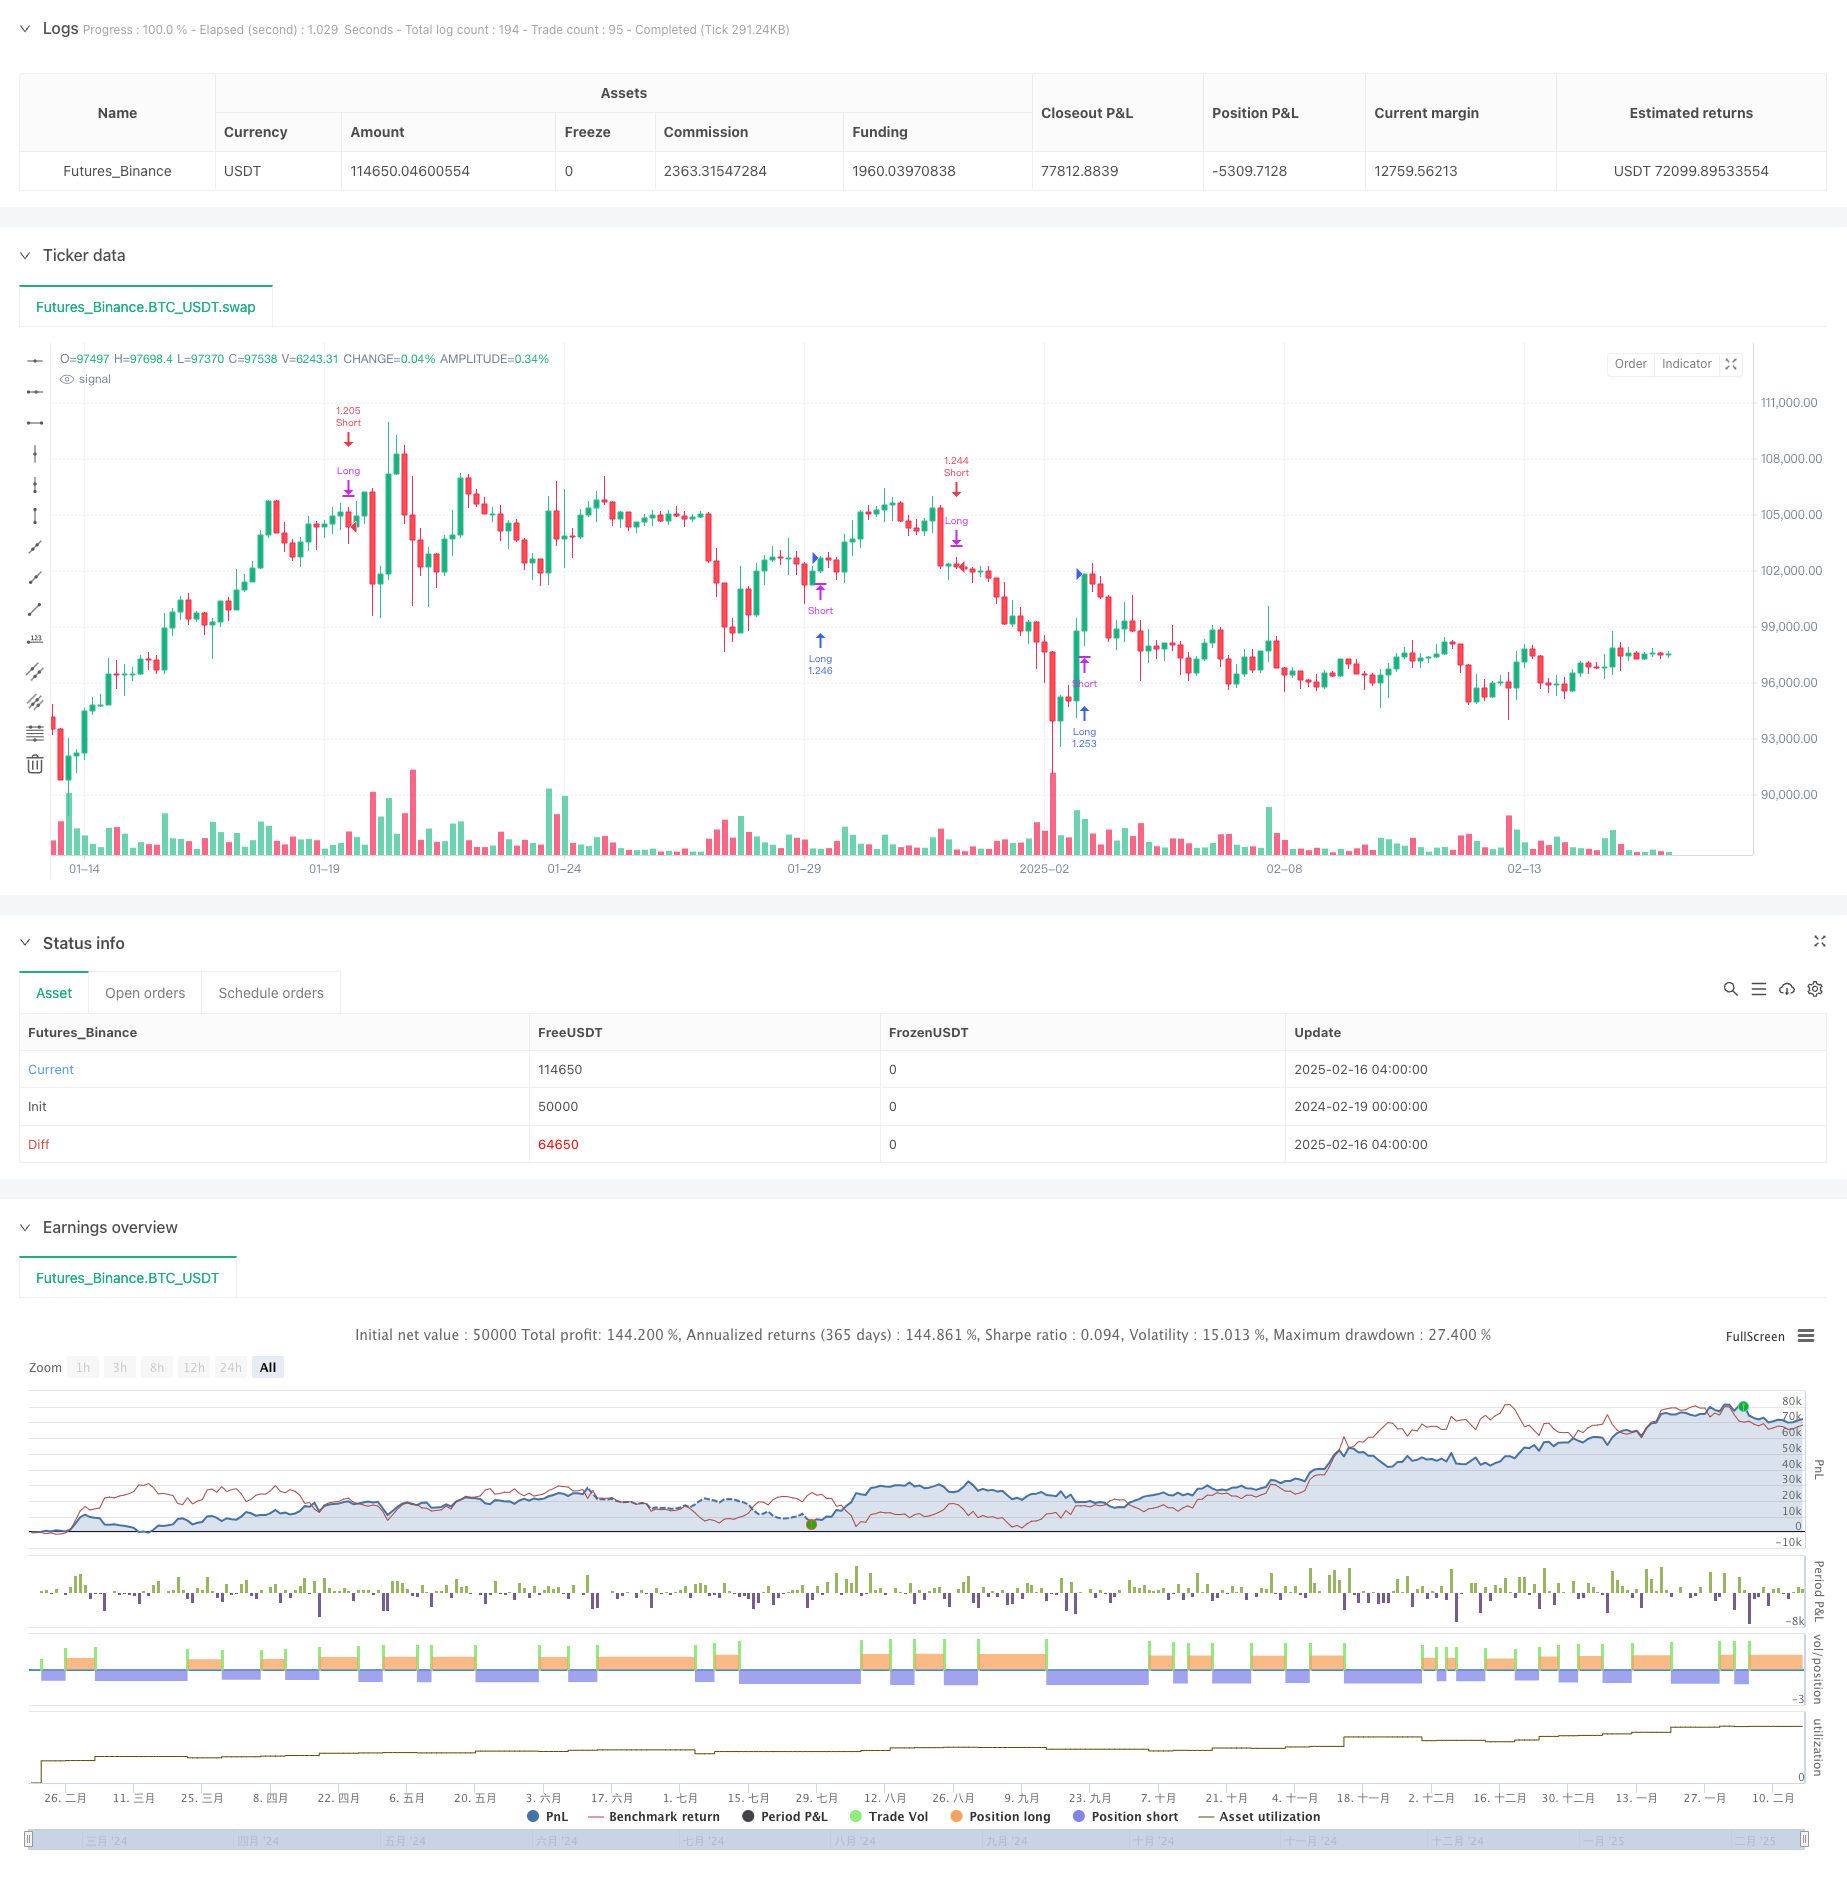
[trans]
概述
该策略是一个基于增强型相对强弱指标(RSI)的趋势跟踪交易系统。它通过计算RSI的改良版本并结合其信号线,在不同市场周期捕捉趋势反转机会。该策略不仅计算指标值,还通过视觉上的超买超卖区域展示,帮助交易者更直观地判断市场状态。
策略原理
策略的核心原理是通过增强型RSI(ARSI)的计算来识别市场趋势。具体包括:
- 计算指定周期内的最高价和最低价,得到价格区间
- 基于价格变化计算差值
- 使用可选的移动平均方法(EMA、SMA、RMA、TMA)对差值进行平滑处理
- 将结果标准化到0-100范围内
- 当ARSI在50以下穿越信号线时产生做多信号
- 当ARSI在50以上跌破信号线时产生做空信号
策略优势
- 信号确认机制完善 - 通过ARSI与信号线的交叉以及中轴线过滤,确保信号的可靠性
- 适应性强 - 支持多种移动平均方法,可根据不同市场特征进行调整
- 风险控制合理 - 采用仓位百分比管理方法,有效控制每笔交易的风险
- 可视化效果突出 - 通过颜色填充清晰展示超买超卖区域,便于快速判断
- 反向持仓管理 - 在出现反向信号时会自动平仓现有仓位,避免双向持仓风险
策略风险
- 震荡市场风险 - 在横盘震荡行情中可能产生频繁的假信号
- 滞后性风险 - 由于使用移动平均计算,信号会有一定滞后性
- 参数敏感性 - 不同的参数设置可能导致策略表现差异较大
- 市场适应性风险 - 策略在不同市场环境下的表现可能存在显著差异
- 资金管理风险 - 固定百分比仓位管理在剧烈波动时可能带来较大风险
策略优化方向
- 引入波动率过滤 - 可添加ATR指标来过滤低波动率环境下的交易信号
- 增加趋势确认指标 - 结合更长周期的趋势指标来提高信号可靠性
- 优化仓位管理 - 根据市场波动性动态调整持仓比例
- 加入止损机制 - 设置基于ATR的动态止损以更好地控制风险
- 开发自适应参数 - 研究参数的动态优化方法,提高策略适应性
总结
这是一个结构完整、逻辑清晰的趋势跟踪策略。通过增强型RSI的创新计算方法,结合多种技术指标的优势,形成了一个可靠的交易系统。虽然存在一些固有风险,但通过合理的优化和风险管理措施,该策略具有良好的实战应用前景。建议交易者在实盘使用时,需要充分测试参数设置,并结合市场环境适时调整策略配置。
||
Overview
This strategy is a trend-following trading system based on an enhanced Relative Strength Index (RSI). It captures trend reversal opportunities across different market cycles by calculating an improved version of RSI and combining it with its signal line. The strategy not only computes indicator values but also provides visual representation of overbought and oversold areas to help traders make more intuitive market judgments.
Strategy Principles
The core principle revolves around identifying market trends through an Augmented RSI (ARSI) calculation, including:
- Calculating highest and lowest prices within a specified period to determine price range
- Computing differences based on price changes
- Smoothing the differences using selectable moving average methods (EMA, SMA, RMA, TMA)
- Normalizing results to a 0-100 range
- Generating long signals when ARSI crosses above its signal line below 50
- Generating short signals when ARSI crosses below its signal line above 50
Strategy Advantages
- Robust Signal Confirmation - Ensures reliability through ARSI crossovers and midline filtering
- High Adaptability - Supports multiple moving average methods for different market characteristics
- Reasonable Risk Control - Employs position percentage management for effective risk control
- Outstanding Visualization - Clearly displays overbought/oversold areas through color filling
- Reverse Position Management - Automatically closes existing positions on contrary signals
Strategy Risks
- Oscillation Market Risk - May generate frequent false signals in sideways markets
- Lag Risk - Signals have inherent lag due to moving average calculations
- Parameter Sensitivity - Different parameter settings may lead to significant performance variations
- Market Adaptability Risk - Strategy performance may vary significantly across different market environments
- Money Management Risk - Fixed percentage position sizing may pose risks during high volatility
Optimization Directions
- Volatility Filtering - Add ATR indicator to filter signals in low volatility environments
- Additional Trend Confirmation - Incorporate longer-period trend indicators to improve signal reliability
- Position Management Optimization - Dynamically adjust position sizes based on market volatility
- Stop Loss Implementation - Develop ATR-based dynamic stop-loss for better risk control
- Adaptive Parameters - Research dynamic parameter optimization methods to improve adaptability
Summary
This is a well-structured trend-following strategy with clear logic. Through innovative ARSI calculation methods and the combination of various technical indicators' advantages, it forms a reliable trading system. While inherent risks exist, the strategy shows good practical application potential through reasonable optimization and risk management measures. Traders are advised to thoroughly test parameter settings and adjust strategy configuration according to market conditions when implementing in live trading.[/trans]
Source (PineScript)
/*backtest
start: 2024-02-19 00:00:00
end: 2025-02-16 08:00:00
period: 4h
basePeriod: 4h
exchanges: [{"eid":"Futures_Binance","currency":"BTC_USDT"}]
*/

//@version=6
strategy("Ultimate RSI [LuxAlgo] Strategy", shorttitle="ULT RSI Strat", overlay=false, initial_capital=10000, currency=currency.USD, default_qty_type=strategy.percent_of_equity, default_qty_value=100)

//------------------------------------------------------------------------------
// Settings
//------------------------------------------------------------------------------
length    = input.int(14, minval=2, title="RSI Length")
smoType1  = input.string("RMA", title="Method", options=["EMA", "SMA", "RMA", "TMA"])
src       = input(close, title="Source")

arsiCss   = input.color(color.silver, "RSI Color", inline="rsicss")
autoCss   = input.bool(true, "Auto", inline="rsicss")

// Signal Line settings
smooth    = input.int(14, minval=1, title="Signal Smooth", group="Signal Line")
smoType2  = input.string("EMA", title="Method", options=["EMA", "SMA", "RMA", "TMA"], group="Signal Line")
signalCss = input.color(color.new(#ff5d00, 0), "Signal Color", group="Signal Line")

// Overbought/Oversold style
obValue     = input.float(80, "Overbought", inline="ob", group="OB/OS Style")
obCss       = input.color(color.new(#089981, 0), "", inline="ob", group="OB/OS Style")
obAreaCss   = input.color(color.new(#089981, 80), "", inline="ob", group="OB/OS Style")

osValue     = input.float(20, "Oversold", inline="os", group="OB/OS Style")
osCss       = input.color(color.new(#f23645, 0), "", inline="os", group="OB/OS Style")
osAreaCss   = input.color(color.new(#f23645, 80), "", inline="os", group="OB/OS Style")

//------------------------------------------------------------------------------
// Function: Moving Average (selectable type)
//------------------------------------------------------------------------------
ma(x, len, maType)=>
    switch maType
        "EMA" => ta.ema(x, len)
        "SMA" => ta.sma(x, len)
        "RMA" => ta.rma(x, len)
        "TMA" => ta.sma(ta.sma(x, len), len)

//------------------------------------------------------------------------------
// Augmented RSI Calculation
//------------------------------------------------------------------------------
upper = ta.highest(src, length)
lower = ta.lowest(src, length)
r     = upper - lower

d     = src - src[1]
diff  = upper > upper[1] ? r : lower < lower[1] ? -r : d

num   = ma(diff, length, smoType1)
den   = ma(math.abs(diff), length, smoType1)
arsi  = den != 0 ? num / den * 50 + 50 : 50  // safeguard against division by zero

signal = ma(arsi, smooth, smoType2)

//------------------------------------------------------------------------------
// Strategy Entry Conditions
//------------------------------------------------------------------------------
// Long entry: Ultimate RSI crosses above its signal when it is below 50 (lower half)
// Short entry: Ultimate RSI crosses below its signal when it is above 50 (upper half)
longCondition  = ta.crossover(arsi, signal) and arsi < 50
shortCondition = ta.crossunder(arsi, signal) and arsi > 50

// Close opposite positions when conditions occur
if shortCondition
    strategy.close("Long")
if longCondition
    strategy.close("Short")

// Place new entries based on the conditions
if longCondition
    strategy.entry("Long", strategy.long)
if shortCondition
    strategy.entry("Short", strategy.short)

// //------------------------------------------------------------------------------
// // Plots and Constant Lines
// //------------------------------------------------------------------------------
// // Plot the Ultimate RSI and its Signal
// plot_rsi = plot(arsi, title="Ultimate RSI",
//      color = arsi > obValue ? obCss : arsi < osValue ? osCss : autoCss ? chart.fg_color : arsiCss,
//      linewidth=2)
// plot(signal, title="Signal Line", color=signalCss, linewidth=2)

// // Instead of using hline, create constant plots for OB, Midline, and OS
// plot_ob  = plot(obValue, title="Overbought", color=obCss, style=plot.style_line, linewidth=1)
// plot_mid = plot(50, title="Midline", color=color.gray, style=plot.style_line, linewidth=1)
// plot_os  = plot(osValue, title="Oversold", color=osCss, style=plot.style_line, linewidth=1)

// //------------------------------------------------------------------------------
// // Fill OB/OS Areas for Visual Clarity
// //------------------------------------------------------------------------------
// fill(plot_rsi, plot_ob, color=arsi > obValue ? obAreaCss : na)
// fill(plot_os, plot_rsi, color=arsi < osValue ? osAreaCss : na)
Detail
https://www.fmz.com/strategy/482453
Last Modified
2025-02-18 15:04:49