
8.2 KiB
Name
基于MACD的复合量化交易策略Compound-Quantitative-Trading-Strategy-Based-on-MACD
Author
ChaoZhang
Strategy Description
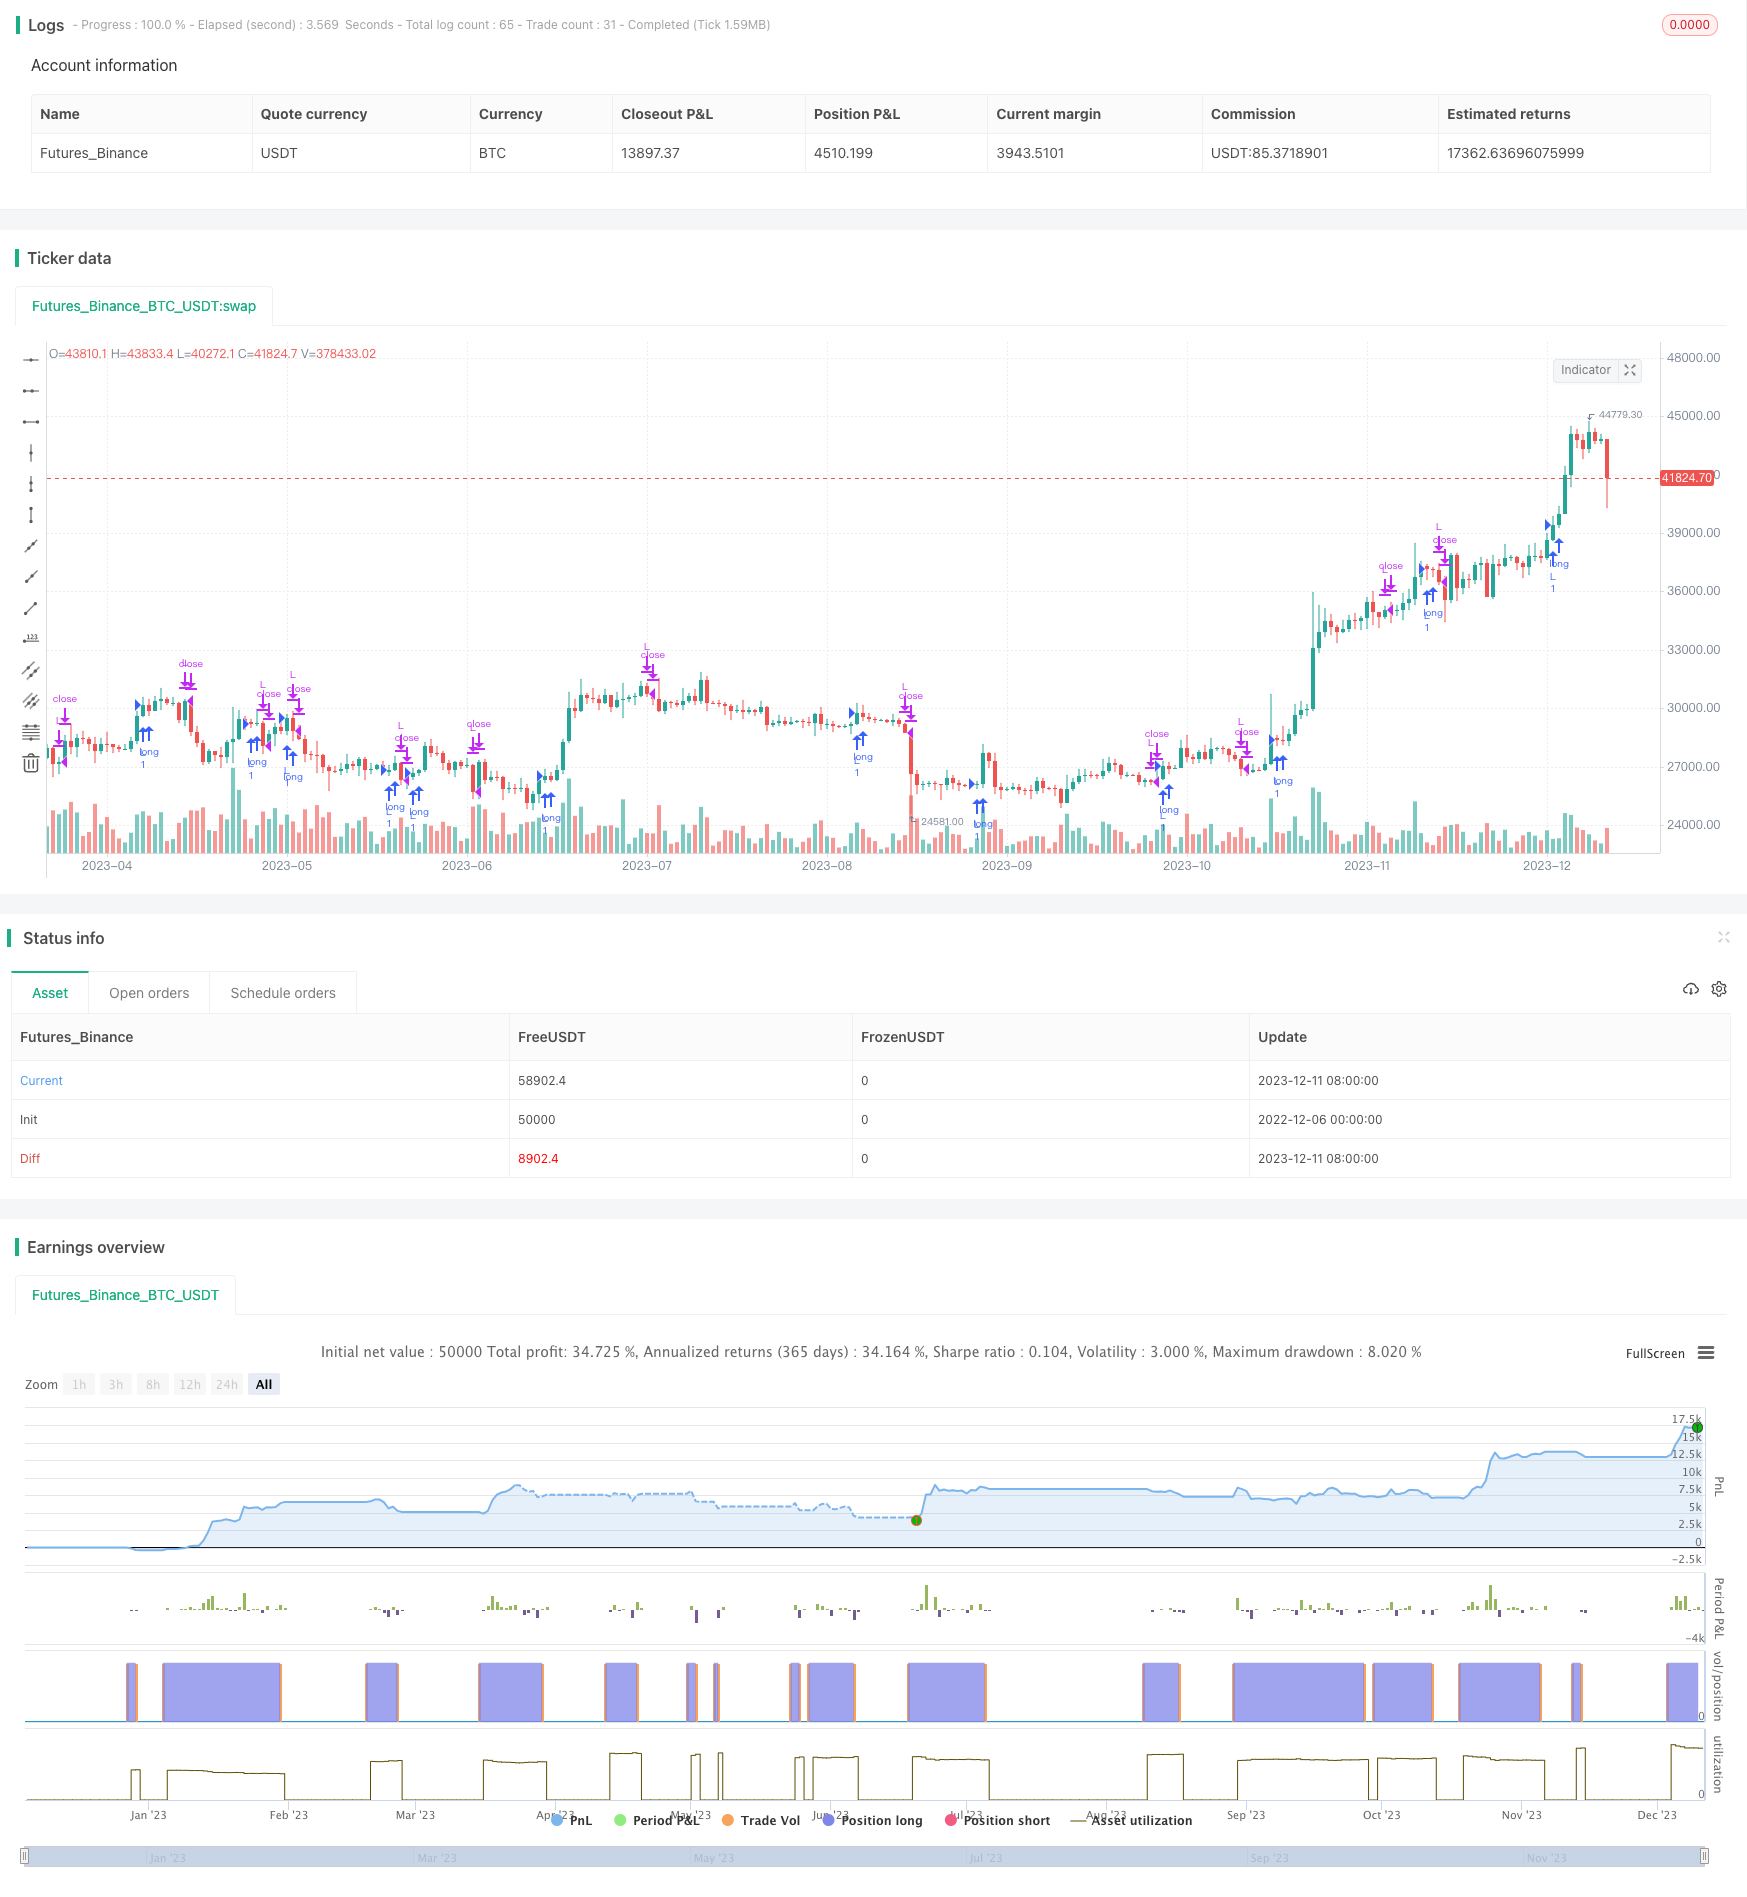 [trans]
概述
该策略是一个基于MACD指标的复合量化交易策略。它综合使用了MACD,KDJ等多个指标,通过指标之间的组合来产生交易信号。
策略原理
该策略的核心指标是MACD。MACD代表指数移动平均线,是一种趋势跟踪指标。它由一个快速移动平均线(EMA)和一个慢速移动平均线(EMA)组成。快线默认参数为12,慢线默认参数为26。策略会计算两条EMA线之间的差值,即DIF。然后再对DIF求一个9日的EMA,得到DEA指标。当DIF上穿DEA时产生买入信号,下穿时产生卖出信号。
该策略还引入了KDJ指标。KDJ指标包括K值、D值和J值。其中,K值指随机值,D值是K值的移动平均线,J值指确定性值。KDJ指标反映市场的超买超卖状态。当J值大于100时代表超买,小于10时代表超卖。策略会结合KDJ指标,避免在市场转折点发出错误信号。
策略优势
该策略综合运用MACD和KDJ等多个指标,可以有效过滤市场噪音,识别趋势方向。MACD指标可以及时捕捉短期价格变动,KDJ指标可以确认中长期趋势。两者的结合可以平衡追求敏捷和稳定之间的关系。
另外,策略加入了时间选择器,可以自行选择回测的时间范围。这为评估策略表现提供了更大的灵活性。
策略风险及解决方法
-
当市场长期震荡时,MACD将出现多次误报。这时可以适当调整EMA线的参数,过滤部分噪音。
-
KDJ指标参数设置不当也会影响结果。可以测试多组参数,选择更稳定的参数组合。
-
回测时间选择不当,会高估或低估策略收益。应选择有代表性的时间范围进行测试。
优化方向
该策略可以从以下方面进行优化:
-
增加止损机制。当价格触发止损线时,强制平仓止损。
-
增加更多指标过滤器。结合RSI、布林带等其他指标,可以提高信号的准确性。
-
优化指标参数。改变EMA和KDJ参数的组合,寻找最优参数。
-
利用机器学习技术自动优化。使用神经网络等进行策略参数训练和优化。
总结
该策略是一个典型的以趋势跟踪为主,辅以超买超卖控制的量化策略。它融合多种指标优势,可以有效平衡稳定性和灵敏度。通过持续优化和调整,进一步扩大策略适用场景,从而获得长期稳定收益。
||
Overview
This is a compound quantitative trading strategy based on the MACD indicator. It combines multiple indicators such as MACD and KDJ to generate trading signals through the combination of indicators.
Strategy Principle
The core indicator of this strategy is MACD. MACD stands for Moving Average Convergence Divergence, which is a trend-following indicator. It consists of a fast moving average (EMA) and a slow moving average (EMA). The default parameters are 12 for the fast line and 26 for the slow line. The strategy calculates the difference between the two EMA lines, called the DIF. Then a 9-day EMA is calculated on the DIF to get the DEA indicator. When the DIF crosses above the DEA, a buy signal is generated. When crossing below, a sell signal is generated.
The strategy also incorporates the KDJ indicator. The KDJ indicator includes the K value, D value, and J value. Among them, the K value refers to the random value, the D value is the moving average of the K value, and the J value refers to the deterministic value. The KDJ indicator reflects the overbought and oversold levels in the market. When the J value is greater than 100, it represents overbought conditions. When less than 10, it represents oversold conditions. The strategy combines the KDJ indicator to avoid generating wrong signals at market turning points.
Advantages of the Strategy
The strategy combines multiple indicators such as MACD and KDJ, which can effectively filter out market noise and identify trend directions. The MACD indicator can capture short-term price changes in a timely manner, while the KDJ indicator can confirm medium and long term trends. The combination of the two can balance the pursuit of agility and stability.
In addition, the strategy incorporates a time range selector, which provides greater flexibility in evaluating strategy performance.
Risks and Solutions
-
When the market fluctuates for an extended period, MACD will have multiple false signals. At this point, we can properly adjust the parameters of the EMA lines to filter out some noise.
-
Improper KDJ parameter settings will also affect results. We can test multiple parameter groups and select a more stable parameter combination.
-
Inappropriate selection of backtest timeframe will overestimate or underestimate the profitability of the strategy. Representative timeframes should be chosen for testing.
Optimization Directions
The strategy can be optimized in the following aspects:
-
Add a stop loss mechanism. When the price triggers the stop loss line, it will force a position exit for stop loss purposes.
-
Incorporate more indicator filters, combining indicators such as RSI and Bollinger Bands to improve signal accuracy.
-
Optimize indicator parameters. Change the combination of EMA and KDJ parameters to find the optimal settings.
-
Use machine learning techniques to automatically optimize. Use neural networks for parameter training and optimization.
Conclusion
This is a typical quantitative strategy that mainly follows the trend, supplemented by overbought and oversold control. It combines the advantages of multiple indicators and effectively balances stability and sensitivity. Through continuous optimization and adjustment, the applicability of the strategy can be further expanded to obtain long-term steady profits.
[/trans]
Strategy Arguments
| Argument | Default | Description |
|---|---|---|
| v_input_1 | 12 | fastlength |
| v_input_2 | 26 | slowlength |
| v_input_3 | 9 | signallength |
| v_input_4 | true | From Month |
| v_input_5 | true | From Day |
| v_input_6 | 2018 | From Year |
| v_input_7 | 12 | Thru Month |
| v_input_8 | 31 | Thru Day |
| v_input_9 | 2020 | Thru Year |
| v_input_10 | true | Show Date Range |
Source (PineScript)
/*backtest
start: 2022-12-06 00:00:00
end: 2023-12-12 00:00:00
period: 1d
basePeriod: 1h
exchanges: [{"eid":"Futures_Binance","currency":"BTC_USDT"}]
*/

//@version=4
strategy(title="New Renaissance", shorttitle="New Renaissance", overlay=true,initial_capital=10000)

source = close

fastlength=input(12, minval=1)
slowlength=input(26,minval=1)
signallength=input(9,minval=1)

// === Defining the MACD oscillator
fastMA=ema(source,fastlength)
slowMA=ema(source,slowlength)
MACD=fastMA-slowMA
signal=sma(MACD,signallength)
delta=MACD-signal

// === Buy and Sell Signals ===
buy=crossover(MACD, signal)
sell=crossunder(MACD, signal)

// === INPUT BACKTEST RANGE ===
fromMonth = input(defval = 1,    title = "From Month",      type = input.integer, minval = 1, maxval = 12)
fromDay   = input(defval = 1,    title = "From Day",        type = input.integer, minval = 1, maxval = 31)
fromYear  = input(defval = 2018, title = "From Year",       type = input.integer, minval = 1970)
thruMonth = input(defval = 12,    title = "Thru Month",      type = input.integer, minval = 1, maxval = 12)
thruDay   = input(defval = 31,    title = "Thru Day",        type = input.integer, minval = 1, maxval = 31)
thruYear  = input(defval = 2020, title = "Thru Year",       type = input.integer, minval = 1970)

// === INPUT SHOW PLOT ===
showDate  = input(defval = true, title = "Show Date Range", type = input.bool)

// === FUNCTION EXAMPLE ===
start     = timestamp(fromYear, fromMonth, fromDay, 00, 00)        // backtest start window
finish    = timestamp(thruYear, thruMonth, thruDay, 23, 59)        // backtest finish window
window()  => true       // create function "within window of time"

// === EXECUTION ===
strategy.entry("L", strategy.long, when = window() and buy)    // enter long when "within window of time" AND crossover
strategy.close("L", when = window() and sell)                   // exit long when "within window of time" AND crossunder
Detail
https://www.fmz.com/strategy/435268
Last Modified
2023-12-13 16:44:46