
5.8 KiB
Name
基于EMA指标的趋势跟踪交易策略EMA-Crossover-Trend-Following-Trading-Strategy
Author
ChaoZhang
Strategy Description
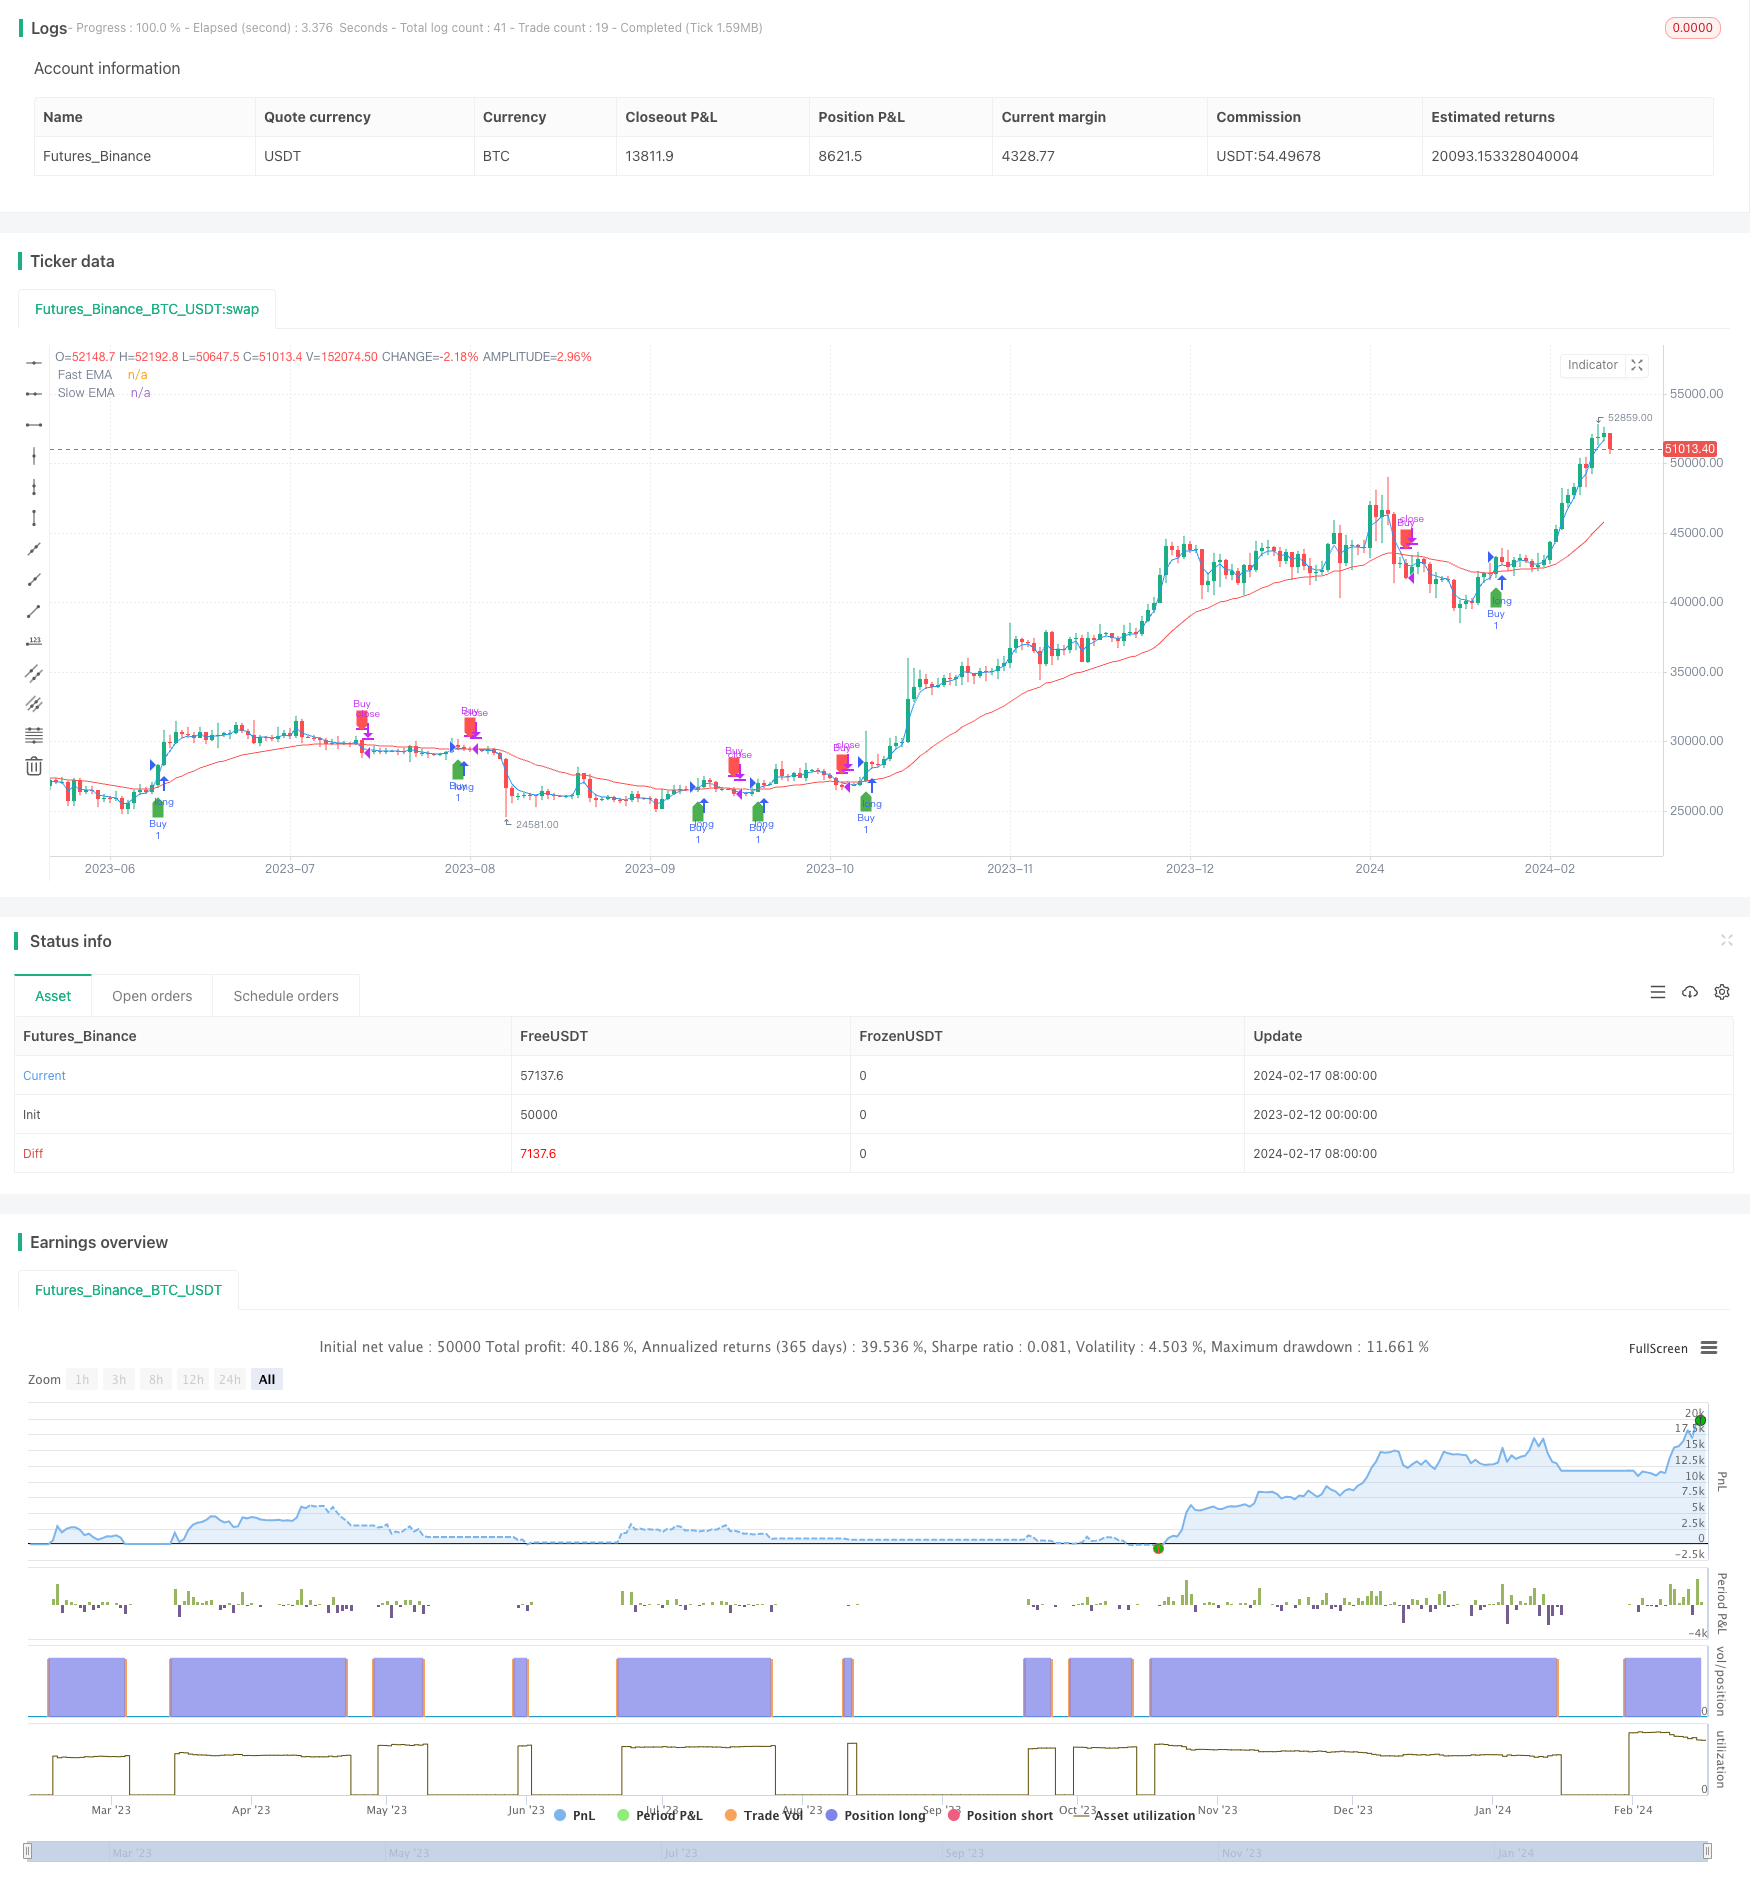 [trans]
概述
该策略利用EMA快线和慢线的金叉和死叉来判断趋势,并结合预设的止盈比例来实现趋势跟踪交易。该策略适用于任意时间周期,可以实现指数和个股的趋势捕捉。
策略原理
该策略使用长度为3和30的EMA线作为交易信号。当3EMA上穿30EMA时,表明价格开始上涨,符合买入条件;当3EMA下穿30EMA时,表明价格开始下跌,符合卖出条件。
同时,策略还设置了止盈条件。当价格上涨达到策略进入价按照设置的止盈比例后,就会 EXIT。这样可以锁定更多利润,实现趋势跟踪交易。
优势分析
- 使用EMA指标判断趋势方向简单易行,容易掌握;
- 结合趋势指标和止盈方式,可以有效控制风险,锁定利润;
- 可适用于任意周期和任意品种,灵活性强。
风险分析
- EMA线本身对价格变化有滞后性,可能出现误判;
- 止盈比例设置过大,可能导致无法及时止盈,错过反转机会;
- 停止追踪过早,可能无法捕捉到趋势的全部行情。
优化方向
- 可以测试不同参数组合的EMA,寻找最佳参数;
- 可以结合其他指标验证EMA信号,提高准确率;
- 动态调整止盈比例,在牛市中适当放宽,在熊市中适当收紧。
总结
该策略总体来说是一个非常实用的趋势跟踪策略。它利用简单的EMA指标判断趋势方向,设置合理的止盈规则,可以有效控制风险,适合长线追踪股票和指数的中长线走势。通过参数优化和配套指标验证,可以进一步提升策略的稳定性和Profit Factor。
||
Overview
This strategy uses the golden cross and death cross of fast and slow EMA lines to determine the trend and sets a profit percentage as the take profit rule to implement trend following trading. It is applicable to any timeframe and can capture trends in both indexes and stocks.
Strategy Logic
The strategy employs 3 and 30 period EMAs as trading signals. When the 3EMA crosses above the 30EMA, it signals that price starts to rise which conforms to the buy condition. When the 3EMA crosses below the 30EMA, it signals that price starts to fall which conforms to the sell condition.
In addition, a profit target is configured in the strategy. When price rises to the entry price multiplied by the profit percentage, the position will be closed to lock in more profits and achieve trend following trading.
Advantage Analysis
- Using EMAs to determine trends is simple and easy to grasp.
- Combining trend indicators and take profit rules can effectively control risks and lock in profits.
- Applicable to any timeframe and tradable, great flexibility.
Risk Analysis
- EMA itself has lagging effect on price changes, may cause misjudgments.
- Overly large profit target may lead to failure in timely profit-taking, missing reversal opportunities.
- Stopping tracking too early may result in missing part of the trending move.
Optimization Directions
- Different EMA combinations can be tested to find the optimal parameters.
- Other indicators can be combined to verify the EMA signals and improve accuracy.
- The profit percentage can be dynamically tuned, relaxed during bull market and tightened during bear market.
Conclusion
In conclusion, this is a very practical trend following strategy. It adopts simple EMA indicators to determine the trend direction and sets reasonable profit taking rules to effectively control risks, suitable for long term tracking of stock and index mid-to-long term trends. Further improvements on stability and profit factor can be achieved through parameter optimization and supplementary signal verification indicators.
[/trans]
Strategy Arguments
| Argument | Default | Description |
|---|---|---|
| v_input_1 | 3 | Fast EMA Length |
| v_input_2 | 30 | Slow EMA Length |
| v_input_3 | 100 | Profit Percentage |
Source (PineScript)
/*backtest
start: 2023-02-12 00:00:00
end: 2024-02-18 00:00:00
period: 1d
basePeriod: 1h
exchanges: [{"eid":"Futures_Binance","currency":"BTC_USDT"}]
*/

//@version=5
strategy("EMA Crossover Strategy with Target", shorttitle="EMACross", overlay=true)

// Define input parameters
fastLength = input(3, title="Fast EMA Length")
slowLength = input(30, title="Slow EMA Length")
profitPercentage = input(100.0, title="Profit Percentage")

// Calculate EMAs
fastEMA = ta.ema(close, fastLength)
slowEMA = ta.ema(close, slowLength)

// Plot EMAs on the chart
plot(fastEMA, color=color.blue, title="Fast EMA")
plot(slowEMA, color=color.red, title="Slow EMA")

// Buy condition: 3EMA crosses above 30EMA
buyCondition = ta.crossover(fastEMA, slowEMA)

// Sell condition: 3EMA crosses below 30EMA or profit target is reached
sellCondition = ta.crossunder(fastEMA, slowEMA) or close >= (strategy.position_avg_price * (1 + profitPercentage / 100))

// Target condition: 50 points profit
//targetCondition = close >= (strategy.position_avg_price + 50)

// Execute orders
// strategy.entry("Buy", strategy.long, when=buyCondition)
// strategy.close("Buy", when=sellCondition )
if (buyCondition)
    strategy.entry("Buy", strategy.long)

if (sellCondition)
    strategy.close("Buy")

// // Execute sell orders
// strategy.entry("Sell", strategy.short, when=sellCondition)
// strategy.close("Sell", when=buyCondition)

// Plot buy and sell signals on the chart
plotshape(series=buyCondition, title="Buy Signal", color=color.green, style=shape.labelup, location=location.belowbar)
plotshape(series=sellCondition, title="Sell Signal", color=color.red, style=shape.labeldown, location=location.abovebar)
Detail
https://www.fmz.com/strategy/442077
Last Modified
2024-02-19 10:39:22