
7.8 KiB
Name
基于EMA指标的旗形趋势追踪策略Trend-Tracking-Flag-Pattern-Strategy-Based-on-EMA-Indicators
Author
ChaoZhang
Strategy Description
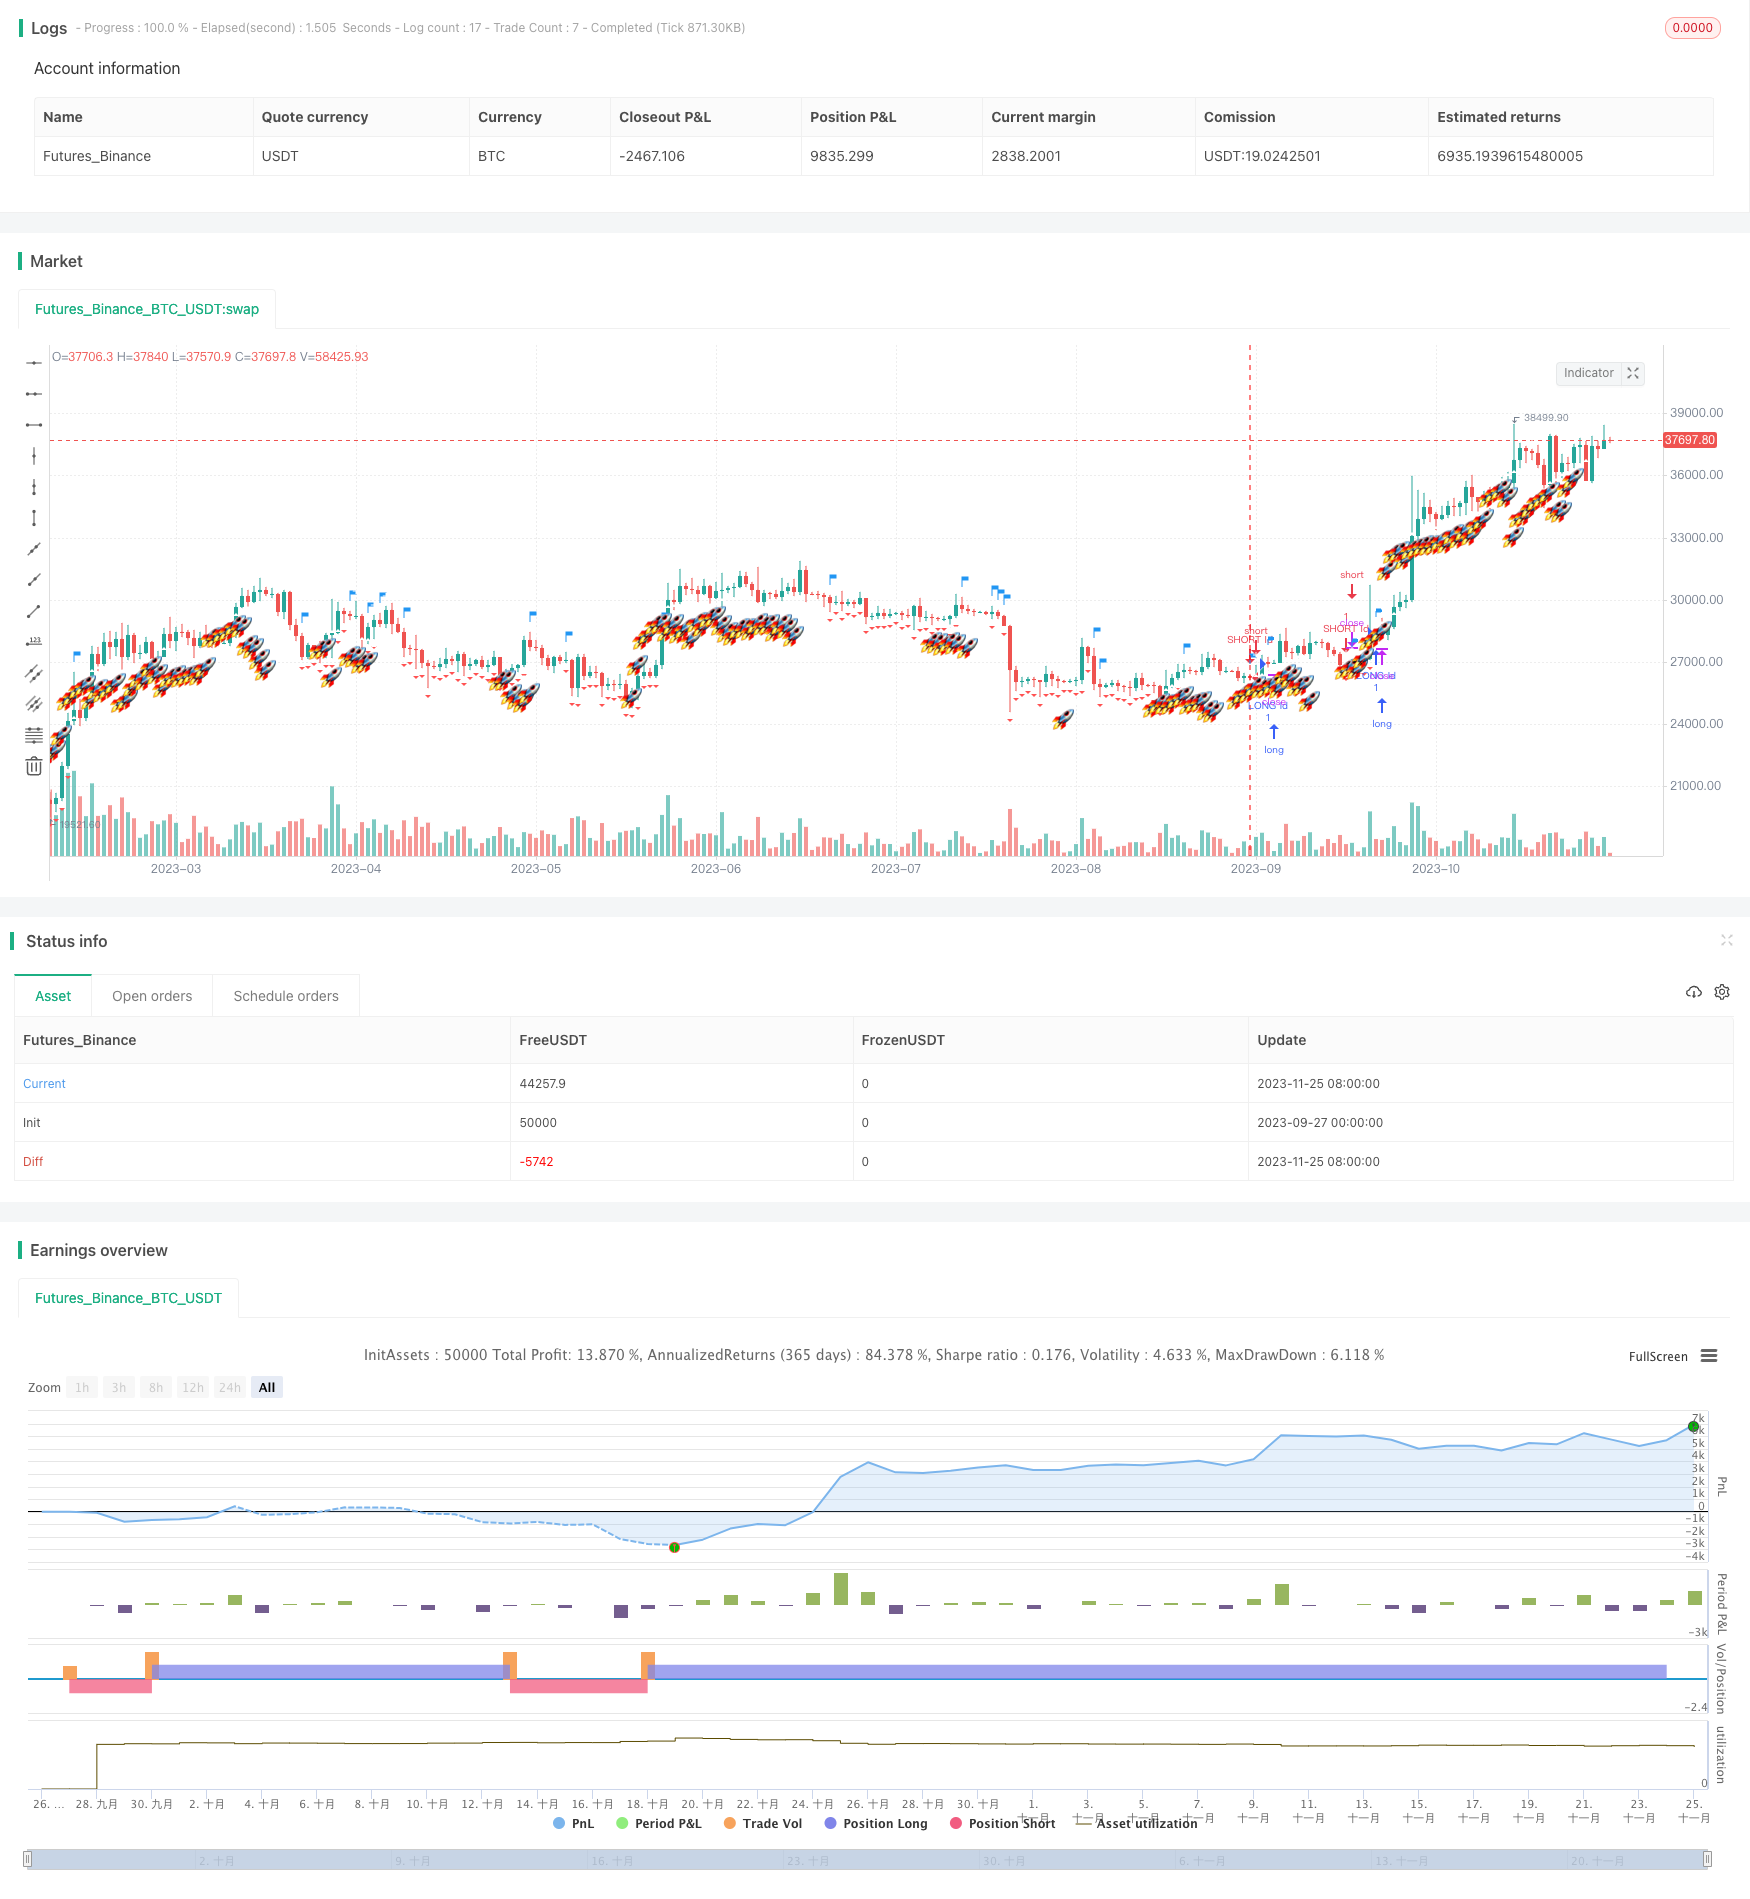
[trans]
概述
该策略主要使用EMA均线指标以及标准差指标,通过EMA均线的交叉信号判断趋势方向,并利用标准差指标寻找突破信号,进而产生买入和卖出信号。当价格突破上轨时产生买入信号,突破下轨时产生卖出信号,属于趋势跟踪类型的策略。
策略原理
该策略主要由三个部分组成:
-
EMA均线差值(s2):计算快速EMA均线(ema_range)减去慢速EMA均线(ema_watch)的差值,该差值用于判断价格趋势方向。
-
标准差上下轨(s3):在EMA均线差值的基础上,加入标准差的倍数,构建上下轨道带。其中标准差倍数采用黄金分割数5.618。
-
旗形和信号:当价格从下向上突破上轨时,产生买入信号;当价格从上向下突破下轨时,产生卖出信号。同时在产生信号时,用旗形标记。
通过该组合指标,可以捕捉价格的趋势方向,在关键点位产生买入和卖出信号,属于典型的趋势跟踪策略。
优势分析
该策略具有以下几个优势:
- 使用EMA均线判断价格趋势方向,可以有效跟踪趋势。
- 借助标准差指标构建上下轨,避免在非关键点产生误信号。
- 旗形信号直观明了,清晰判断买入卖出点位。
- 参数设置灵活,可调整均线周期和标准差倍数。
- 最大回撤控制有助于降低风险。
风险分析
该策略也存在一些风险:
- 在趋势市场效果较好,但在震荡市场中可能产生较多错误信号。
- 标准差倍数设置过大会错过买入卖出机会。
- 没有止损策略,在突破后如果出现回调可能带来较大损失。
针对以上风险,可以通过以下方法加以优化:
- 增加震荡市判断,在震荡市使用其他策略替代。
- 优化标准差参数,寻找最佳参数组合。
- 增加移动止损来控制个别单子的损失。
优化方向
该策略可以从以下几个方向进行优化:
- 增加更多指标判断,例如加上布林带,提高信号质量。
- 优化均线和标准差参数,寻找最佳参数组合。
- 增加止损策略,降低回撤风险。
- 根据不同市场设定最佳买卖信号参数。
- 增加机器学习算法判定overall market regime。
总结
该策略整体属于较为典型的趋势跟踪策略,使用EMA和标准差构建指标系统,并在关键点位产生旗形信号。策略优势在于捕捉趋势,使用标准差指标避免误信号。风险主要在于震荡市的错误信号和无止损导致的回撤风险。通过增加判断指标,优化参数以及加入止损可以进一步增强策略的稳定性和盈利能力。总体来说,该策略框架合理,有很大的优化空间。
||
Overview
This strategy mainly uses EMA and standard deviation indicators to determine the trend direction through EMA cross signals and look for breakout signals with standard deviation to generate buy and sell signals. It belongs to the trend tracking type of strategy that generates buy signals when prices break through the upper rail and sell signals when prices break through the lower rail.
Strategy Logic
The strategy consists of three main parts:
-
EMA Difference (s2): Calculate the difference between fast EMA (ema_range) and slow EMA (ema_watch) to determine the price trend direction.
-
Standard Deviation Channel (s3): Build upper and lower channel based on EMA difference with multiples of standard deviation. The standard deviation multiplier uses the golden ratio 5.618.
-
Flags and Signals: Generate buy signals when prices break through the upper rail from bottom up, and sell signals when prices break through the lower rail from top down. Flag shapes are used to mark the signals.
Through this combination of indicators, it can capture the trend direction of prices and generate buy and sell signals at key points, which belongs to a typical trend tracking strategy.
Advantage Analysis
The strategy has the following advantages:
- EMA can effectively track trends.
- Standard deviation builds channels to avoid false signals.
- Flag shapes make signals clear.
- Flexible parameter settings of moving averages and standard deviation multiples.
- Maximum drawdown control helps reduce risks.
Risk Analysis
There are also some risks:
- More false signals may occur in range-bound markets.
- Too large standard deviation multiples may miss opportunities.
- No stop loss may lead to larger losses during retracements.
The solutions:
- Add range-bound market judgment and use other strategies instead.
- Optimize standard deviation parameters.
- Add moving stop loss to control loss of individual trades.
Optimization
The strategy can be optimized in the following directions:
- Add more indicators like Bollinger Bands to improve signal quality.
- Optimize moving average and standard deviation parameters.
- Add stop loss strategies to reduce drawdowns.
- Set optimal buy/sell signal parameters according to different markets.
- Add machine learning algorithms to determine overall market regime.
Conclusion
In summary, this is a typical trend tracking strategy using EMA and standard deviation to build an indicator system and generate flag signals at key points. The advantages lie in catching trends and avoiding false signals with standard deviation. The main risks come from wrong signals in range-bound markets and drawdown risks due to no stop loss. By adding judgment indicators, optimizing parameters and adding stop loss, the strategy can be further enhanced in terms of stability and profitability. Overall, the strategy framework is reasonable and has great potential for optimization.
[/trans]
Strategy Arguments
| Argument | Default | Description |
|---|---|---|
| v_input_1 | 5 | ema_range |
| v_input_2 | 13 | ema_watch |
| v_input_3_open | 0 | inval_a: open |
| v_input_4_open | 0 | inval_b: open |
| v_input_5 | false | ratio |
Source (PineScript)
/*backtest
start: 2023-09-27 00:00:00
end: 2023-11-26 00:00:00
period: 1d
basePeriod: 1h
exchanges: [{"eid":"Futures_Binance","currency":"BTC_USDT"}]
*/

//@version=5
strategy("ROCKET_EWO", overlay=true)
ema_range = input(5)
ema_watch = input(13)
inval_a = input(open)
inval_b = input(open)
ratio = input(0)
max = 5000
s2=ta.ema(inval_a, ema_range) - ta.ema(inval_b, ema_watch)
c_color=s2 <= ratio ? 'red' : 'lime'
s3 = s2 + (ta.stdev(open, 1)) * 5.618
plotshape(s3, color=color.white, style=shape.cross, location=location.abovebar, size=size.auto, show_last=max, transp=30, offset= 0)
cr = s2 > 0
alertcondition(cr, title='[Rocket_EWO]', message='[Rocket_EWO]')
buy = s2 > 1
sell = s2 < -1
txt  = "?" + "\n"+ "\n"+ "\n"+ "\n"
plotshape(buy, color=color.lime, style=shape.triangleup, location=location.belowbar ,color=color.white, text=txt, size=size.normal, show_last=max, transp=1, offset= -3)
plotshape(not buy, color=color.red, style=shape.triangledown, location=location.belowbar, size=size.normal, show_last=max, transp=1, offset= 0)
signalperiod = time
s4 = ta.cross(s2, 0) ? time : na
colsig= s2 <= ratio ? color.red : color.lime
plotshape((time==s4)?7000:na,color=color.blue, style=shape.flag, location=location.abovebar, size=size.large, transp=1)

longCondition =  ta.crossover(s2, 1.618)
if (longCondition)
    strategy.entry("LONG Id", strategy.long)

shortCondition = ta.crossunder(s2, 1.618)
if (shortCondition)
    strategy.entry("SHORT Id", strategy.short)

strategy.close("LONG Id", when = s2 < 0.218)
// strategy.risk.max_drawdown(75, strategy.percent_of_equity)
Detail
https://www.fmz.com/strategy/433424
Last Modified
2023-11-27 15:30:29