
14 KiB
Name
基于EMA和随机RSI的多周期趋势跟踪交易策略EMA-and-Stochastic-RSI-based-Multi-timeframe-Trend-Following-Trading-Strategy
Author
ChaoZhang
Strategy Description
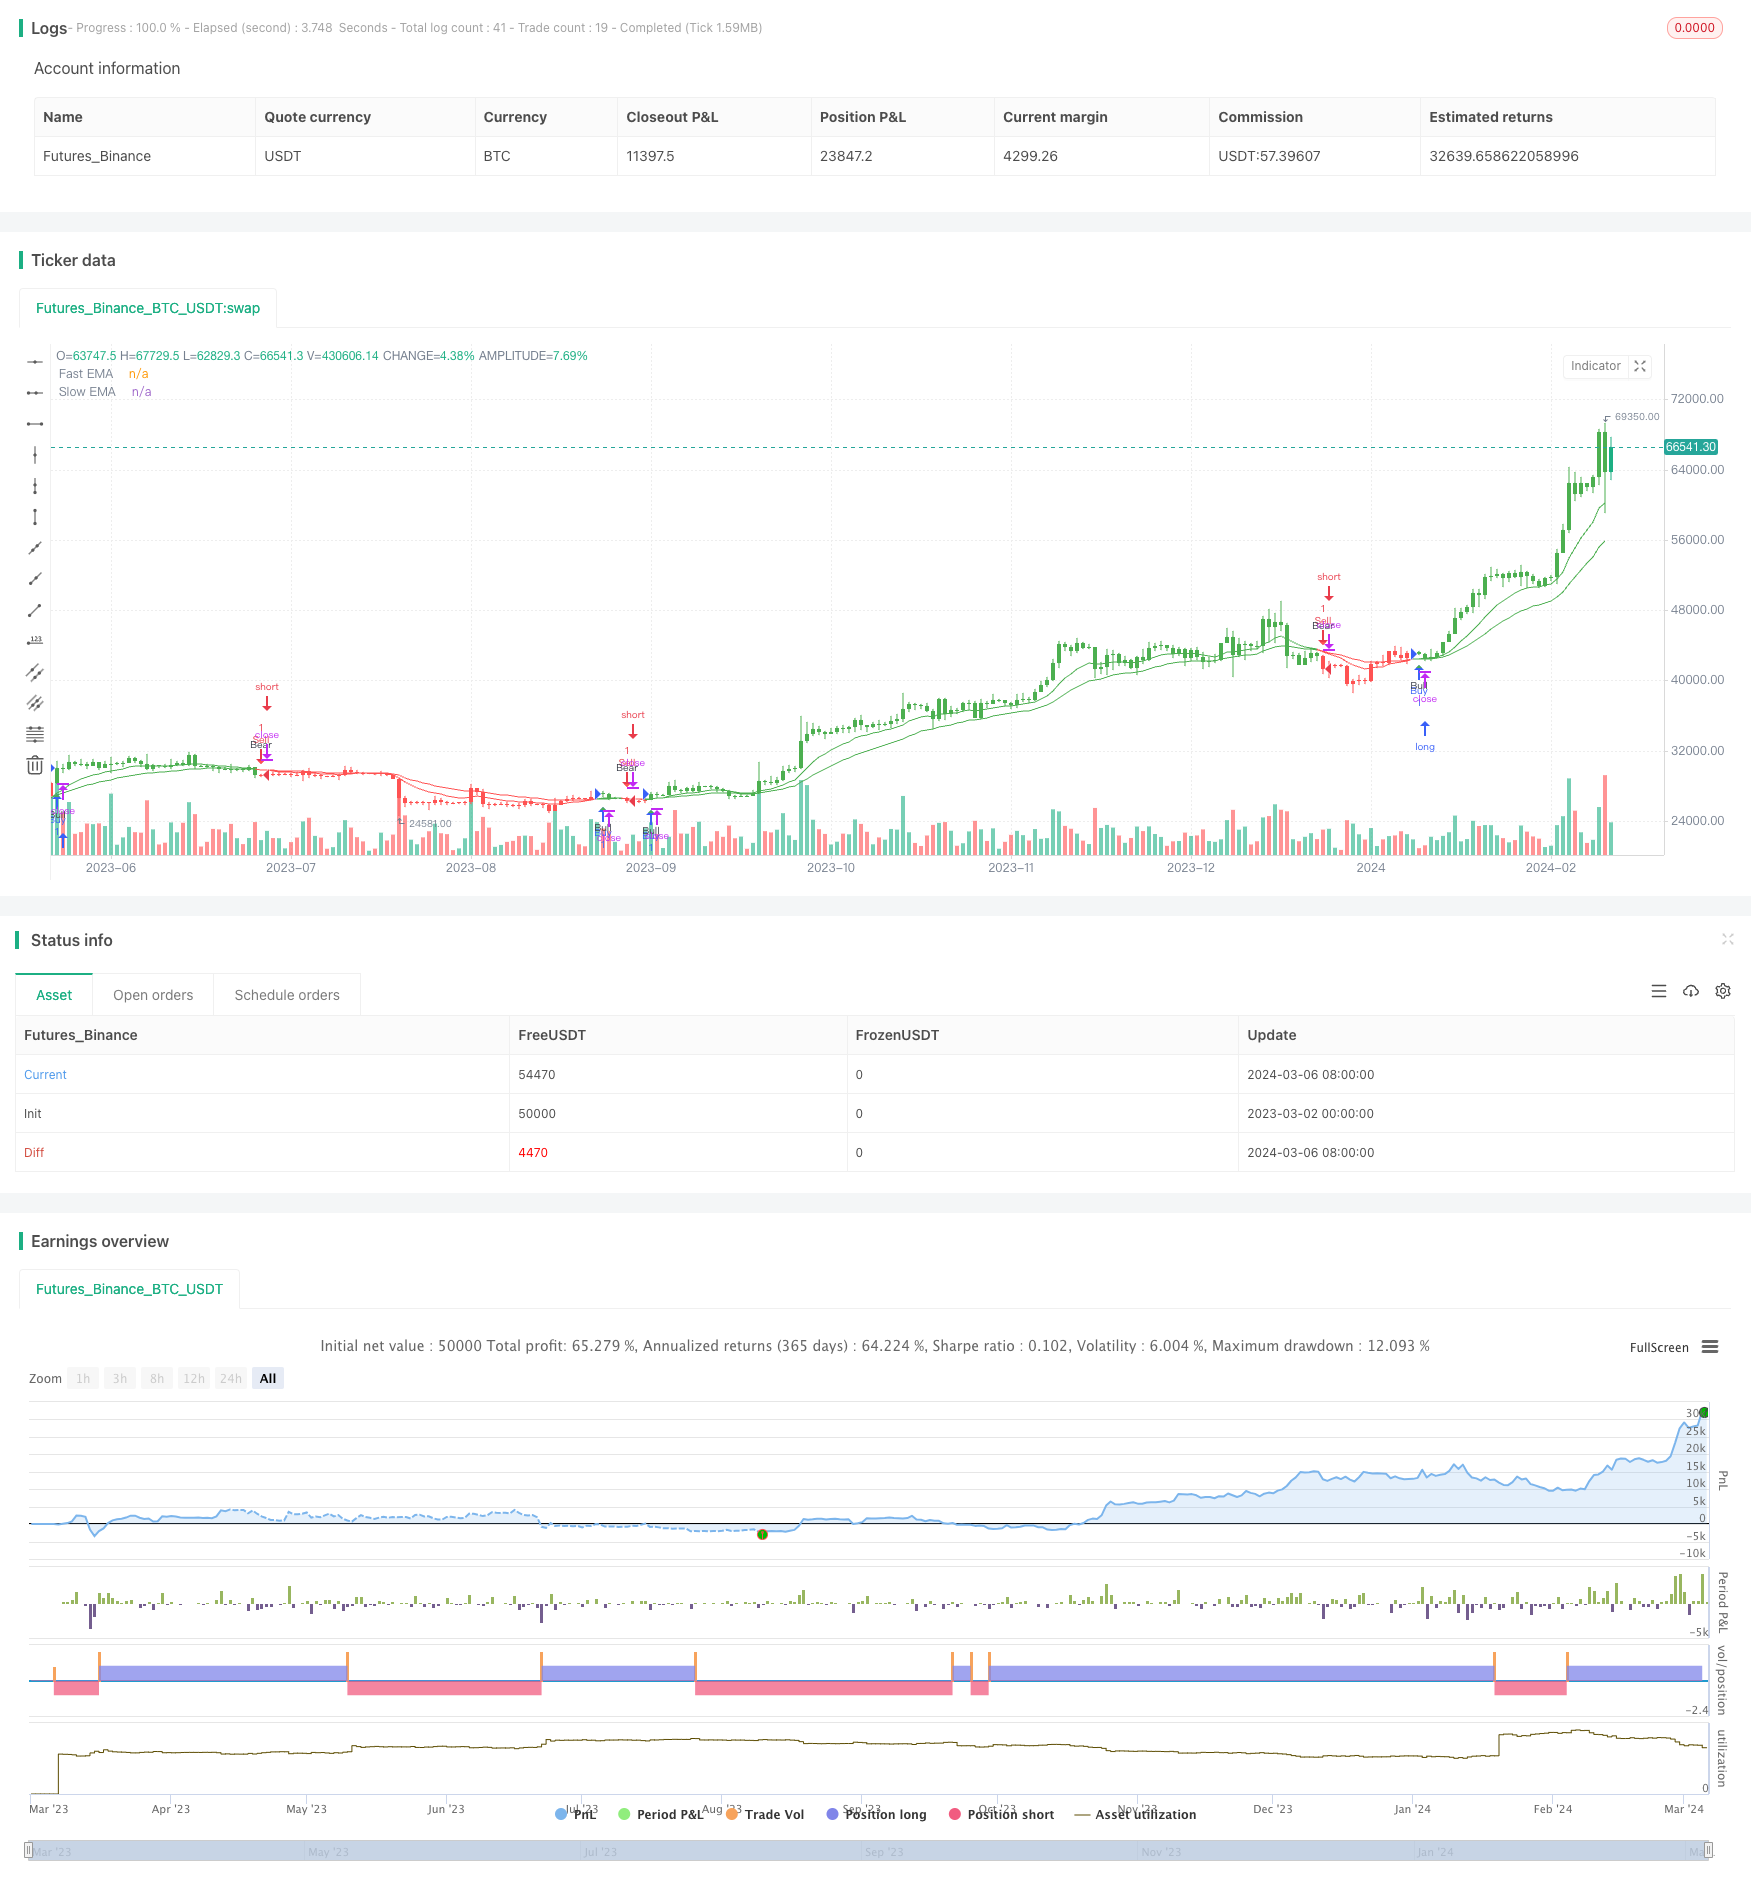 [trans]
策略概述
该策略名为"基于EMA和随机RSI的多周期趋势跟踪交易策略",利用两条不同周期的指数移动平均线(EMA)及随机RSI指标来捕捉市场的中长期趋势。策略的核心思想是通过EMA的交叉来判断趋势方向,同时结合随机RSI作为趋势确认和反转预警信号,以在趋势形成初期建仓,趋势末期平仓。
策略原理
-
计算快速EMA和慢速EMA。快速EMA默认参数为12,慢速EMA默认参数为25,实际应用中可以根据市场特性和交易频率进行调整。
-
判断多空趋势:
- 当快速EMA上穿慢速EMA时,产生看多信号
- 当快速EMA下穿慢速EMA时,产生看空信号
-
趋势确认:看多/看空信号出现后,需连续出现2根看多/看空K线才确认趋势形成。这有助于过滤掉假信号。
-
使用随机RSI作为辅助判断:
- 当随机RSI %K值上穿%D值,且%K值在20以下时,产生超卖信号,提示可能的上涨反转
- 当随机RSI %K值下穿%D值,且%K值在80以上时,产生超买信号,提示可能的下跌反转
- 交易策略:
- 当EMA产生看多信号,且随机RSI不处于超买区时,开多仓
- 当EMA产生看空信号,且随机RSI不处于超卖区时,开空仓
策略优势
-
同时使用两个不同周期的EMA,可以更好地平衡趋势捕捉的灵敏度和可靠性。分析表明12/25周期的EMA组合对中长期趋势把握较好。
-
趋势确认机制可以有效过滤掉大部分假信号,提高策略的胜率。
-
随机RSI作为辅助判断,在趋势初期帮助判断趋势强度,在趋势后期提前预警可能的趋势反转。
-
策略逻辑简单,参数较少,容易理解和实施,且适用于多种市场和品种。
风险分析
-
EMA为滞后指标,在趋势反转初期可能出现较大滑点。
-
趋势型策略在震荡市中表现一般。此策略缺乏对震荡市的专门判断。
-
随机RSI在市场剧烈波动时可能失真,影响判断质量。
-
固定参数可能无法适应所有市场状况,需要根据市场特点动态调整。
优化方向
-
引入ATR等波动率指标,根据波动率动态调整EMA参数,以适应不同的市场节奏。
-
增加对震荡市的判断,比如结合布林带开口方向等,避免在震荡市频繁交易。
-
在随机RSI基础上融入更多辅助判据,如成交量变化等,提高信号可靠度。
-
考虑市场关联性,引入多品种联动信号,增强系统抗风险能力。
总结
该策略充分利用了EMA和随机RSI的优势,形成了一套基于趋势跟踪和动量反转的中长期交易策略。通过均线交叉捕捉趋势,随机RSI确认趋势强度和预警反转,趋势确认机制提高信号质量,三者有机结合,形成了一个简单有效的量化交易策略框架。主要优势在于逻辑简洁,参数较少,实现难度低,适用范围广。同时策略也存在滑点较大,无法适应震荡市等固有局限性。未来可从动态参数优化,引入更多辅助判据,构建品种联动机制等方面深化和完善。总的来说,这是一个具有广阔优化空间和应用前景的量化交易策略。
||
Strategy Overview
The strategy, named "EMA and Stochastic RSI based Multi-timeframe Trend Following Trading Strategy", utilizes two exponential moving averages (EMAs) with different periods and the Stochastic RSI indicator to capture medium to long-term market trends. The core idea is to determine trend direction based on EMA crossovers, while using Stochastic RSI as a confirmatory signal for trend strength and potential reversals. Positions are opened at the beginning of a trend and closed towards the end.
Strategy Principles
-
Calculate a fast EMA and a slow EMA. The default parameter for the fast EMA is 12, and 25 for the slow EMA. These can be adjusted based on market characteristics and trading frequency.
-
Determine bullish/bearish trend:
- When the fast EMA crosses above the slow EMA, it generates a bullish signal
- When the fast EMA crosses below the slow EMA, it generates a bearish signal
-
Trend confirmation: After a bullish/bearish signal appears, it requires 2 consecutive bullish/bearish candles to confirm the trend. This helps filter out false signals.
-
Use Stochastic RSI as an auxiliary judgment:
- When the Stochastic RSI %K line crosses above the %D line, and %K is below 20, it generates an oversold signal, indicating a potential bullish reversal
- When the Stochastic RSI %K line crosses below the %D line, and %K is above 80, it generates an overbought signal, indicating a potential bearish reversal
- Trading rules:
- Open a long position when the EMAs generate a bullish signal, and the Stochastic RSI is not in overbought territory
- Open a short position when the EMAs generate a bearish signal, and the Stochastic RSI is not in oversold territory
Strategy Advantages
-
By using two EMAs with different periods, the strategy can better balance the sensitivity and reliability of trend capturing. Analysis shows that the 12/25 period EMA combination performs well for medium to long-term trends.
-
The trend confirmation mechanism can effectively filter out most false signals and improve the win rate.
-
Stochastic RSI serves as an auxiliary judgment, helping assess trend strength in the early stage and pre-warning potential reversals in the late stage.
-
The strategy logic is simple with few parameters, making it easy to understand and implement. It's also applicable to various markets and instruments.
Risk Analysis
-
EMAs are lagging indicators and may result in significant slippage at the beginning of trend reversals.
-
Trend-following strategies typically underperform in choppy markets. This strategy lacks specific judgment for range-bound conditions.
-
Stochastic RSI may produce misleading signals during extreme market volatility, affecting judgment quality.
-
Fixed parameters may not adapt to all market conditions, requiring dynamic adjustments based on market characteristics.
Optimization Directions
-
Introduce volatility indicators like ATR to dynamically adjust EMA parameters and adapt to different market rhythms.
-
Add judgment for range-bound markets, such as combining Bollinger Bands width, to avoid frequent trades in choppy conditions.
-
Incorporate more auxiliary criteria on top of Stochastic RSI, such as changes in volume, to improve signal reliability.
-
Consider market correlations and introduce multi-asset intermarket signals to enhance the system's risk resilience.
Summary
This strategy effectively leverages the strengths of EMAs and Stochastic RSI to form a medium to long-term trading approach based on trend following and momentum reversal. It captures trends through EMA crossovers, confirms trend strength and warns of reversals with Stochastic RSI, and improves signal quality with trend confirmation mechanisms. The three components organically combine to create a simple and effective quantitative trading strategy framework. Its main advantages lie in its concise logic, few parameters, low implementation difficulty, and wide applicability. However, the strategy also has inherent limitations such as large slippage and inability to adapt to choppy markets. Future enhancements can focus on dynamic parameter optimization, introducing more auxiliary criteria, and constructing inter-market linkage mechanisms. Overall, this is a quantitative trading strategy with ample room for optimization and promising application prospects.
[/trans]
Strategy Arguments
| Argument | Default | Description |
|---|---|---|
| v_input_1_close | 0 | OHLC Type: close |
| v_input_2 | 12 | Fast EMA |
| v_input_3 | 25 | Slow EMA |
| v_input_4 | 25 | Consolidated EMA |
| v_input_5 | true | Show Both EMAs |
| v_input_int_1 | 3 | K |
| v_input_int_2 | 3 | D |
| v_input_int_3 | 14 | RSI Length |
| v_input_int_4 | 14 | Stochastic Length |
| v_input_int_5 | 80 | (?Bands change this instead of length in Style for Stoch RSI colour to work properly)Upper Band |
| v_input_int_6 | 50 | Middle Band |
| v_input_int_7 | 20 | Lower Band |
| v_input_bool_1 | false | (?Crossover Alerts)Crossover Alert Background Colour (Middle Level) [ON/OFF] |
| v_input_bool_2 | false | Crossover Alert Background Colour (OB/OS Level) [ON/OFF] |
| v_input_bool_3 | false | Crossover Alert >input [ON/OFF] |
| v_input_bool_4 | false | Crossover Alert <input [ON/OFF] |
| v_input_string_1 | 0 | (?Moving Average)MA Type: EMA |
| v_input_source_1_close | 0 | MA Source: close |
| v_input_int_8 | 200 | MA Length |
Source (PineScript)
/*backtest
start: 2023-03-02 00:00:00
end: 2024-03-07 00:00:00
period: 1d
basePeriod: 1h
exchanges: [{"eid":"Futures_Binance","currency":"BTC_USDT"}]
*/

//@version=5
strategy('[Jacky] Trader XO Macro Trend Scanner', overlay=true)

// Variables
var ok = 0
var countBuy = 0
var countSell = 0
src = input(close, title='OHLC Type')
i_fastEMA = input(12, title='Fast EMA')
i_slowEMA = input(25, title='Slow EMA')
i_defEMA = input(25, title='Consolidated EMA')

// Allow the option to show single or double EMA
i_bothEMAs = input(title='Show Both EMAs', defval=true)

// Define EMAs
v_fastEMA = ta.ema(src, i_fastEMA)
v_slowEMA = ta.ema(src, i_slowEMA)
v_biasEMA = ta.ema(src, i_defEMA)

// Color the EMAs
emaColor = v_fastEMA > v_slowEMA ? color.green : v_fastEMA < v_slowEMA ? color.red : #FF530D

// Plot EMAs
plot(i_bothEMAs ? na : v_biasEMA, color=emaColor, linewidth=3, title='Consolidated EMA')
plot(i_bothEMAs ? v_fastEMA : na, title='Fast EMA', color=emaColor)
plot(i_bothEMAs ? v_slowEMA : na, title='Slow EMA', color=emaColor)

// Colour the bars
buy = v_fastEMA > v_slowEMA
sell = v_fastEMA < v_slowEMA

if buy
    countBuy += 1
    countBuy

if buy
    countSell := 0
    countSell

if sell
    countSell += 1
    countSell

if sell
    countBuy := 0
    countBuy

buysignal = countBuy < 2 and countBuy > 0 and countSell < 1 and buy and not buy[1]
sellsignal = countSell > 0 and countSell < 2 and countBuy < 1 and sell and not sell[1]

barcolor(buysignal ? color.green : na)
barcolor(sellsignal ? color.red : na)

// Strategy backtest
if (buysignal)
    strategy.entry("Buy", strategy.long)

if (sellsignal)
    strategy.entry("Sell", strategy.short)

// Plot Bull/Bear

plotshape(buysignal, title='Bull', text='Bull', style=shape.triangleup, location=location.belowbar, color=color.new(color.green, 0), textcolor=color.new(color.black, 0), size=size.tiny)
plotshape(sellsignal, title='Bear', text='Bear', style=shape.triangledown, location=location.abovebar, color=color.new(color.red, 0), textcolor=color.new(color.black, 0), size=size.tiny)

bull = countBuy > 1
bear = countSell > 1

barcolor(bull ? color.green : na)
barcolor(bear ? color.red : na)

// Set Alerts

alertcondition(ta.crossover(v_fastEMA, v_slowEMA), title='Bullish EMA Cross', message='Bullish EMA crossover')
alertcondition(ta.crossunder(v_fastEMA, v_slowEMA), title='Bearish EMA Cross', message='Bearish EMA Crossover')

// Stoch RSI code

smoothK = input.int(3, 'K', minval=1)
smoothD = input.int(3, 'D', minval=1)
lengthRSI = input.int(14, 'RSI Length', minval=1)
lengthStoch = input.int(14, 'Stochastic Length', minval=1)

rsi1 = ta.rsi(src, lengthRSI)
k = ta.sma(ta.stoch(rsi1, rsi1, rsi1, lengthStoch), smoothK)
d = ta.sma(k, smoothD)

bandno0 = input.int(80, minval=1, title='Upper Band', group='Bands (change this instead of length in Style for Stoch RSI colour to work properly)')
bandno2 = input.int(50, minval=1, title='Middle Band', group='Bands (change this instead of length in Style for Stoch RSI colour to work properly)')
bandno1 = input.int(20, minval=1, title='Lower Band', group='Bands (change this instead of length in Style for Stoch RSI colour to work properly)')

// Alerts

crossoverAlertBgColourMidOnOff = input.bool(title='Crossover Alert Background Colour (Middle Level) [ON/OFF]', group='Crossover Alerts', defval=false)
crossoverAlertBgColourOBOSOnOff = input.bool(title='Crossover Alert Background Colour (OB/OS Level) [ON/OFF]', group='Crossover Alerts', defval=false)

crossoverAlertBgColourGreaterThanOnOff = input.bool(title='Crossover Alert >input [ON/OFF]', group='Crossover Alerts', defval=false)
crossoverAlertBgColourLessThanOnOff = input.bool(title='Crossover Alert <input [ON/OFF]', group='Crossover Alerts', defval=false)

maTypeChoice = input.string('EMA', title='MA Type', group='Moving Average', options=['EMA', 'WMA', 'SMA', 'None'])
maSrc = input.source(close, title='MA Source', group='Moving Average')
maLen = input.int(200, minval=1, title='MA Length', group='Moving Average')

maValue = if maTypeChoice == 'EMA'
    ta.ema(maSrc, maLen)
else if maTypeChoice == 'WMA'
    ta.wma(maSrc, maLen)
else if maTypeChoice == 'SMA'
    ta.sma(maSrc, maLen)
else
    0

crossupCHECK = maTypeChoice == 'None' or open > maValue and maTypeChoice != 'None'
crossdownCHECK = maTypeChoice == 'None' or open < maValue and maTypeChoice != 'None'

crossupalert = crossupCHECK and ta.crossover(k, d) and (k < bandno2 or d < bandno2)
crossdownalert = crossdownCHECK and ta.crossunder(k, d) and (k > bandno2 or d > bandno2)
crossupOSalert = crossupCHECK and ta.crossover(k, d) and (k < bandno1 or d < bandno1)
crossdownOBalert = crossdownCHECK and ta.crossunder(k, d) and (k > bandno0 or d > bandno0)

aboveBandalert = ta.crossunder(k, bandno0)
belowBandalert = ta.crossover(k, bandno1)

bgcolor(color=crossupalert and crossoverAlertBgColourMidOnOff ? #4CAF50 : crossdownalert and crossoverAlertBgColourMidOnOff ? #FF0000 : na, title='Crossover Alert Background Colour (Middle Level)', transp=70)
bgcolor(color=crossupOSalert and crossoverAlertBgColourOBOSOnOff ? #fbc02d : crossdownOBalert and crossoverAlertBgColourOBOSOnOff ? #000000 : na, title='Crossover Alert Background Colour (OB/OS Level)', transp=70)

bgcolor(color=aboveBandalert and crossoverAlertBgColourGreaterThanOnOff ? #ff0014 : crossdownalert and crossoverAlertBgColourMidOnOff ? #FF0000 : na, title='Crossover Alert - K > Upper level', transp=70)
bgcolor(color=belowBandalert and crossoverAlertBgColourLessThanOnOff ? #4CAF50 : crossdownalert and crossoverAlertBgColourMidOnOff ? #FF0000 : na, title='Crossover Alert - K < Lower level', transp=70)

alertcondition(crossupalert or crossdownalert, title='Stoch RSI Crossover', message='STOCH RSI CROSSOVER')
Detail
https://www.fmz.com/strategy/444040
Last Modified
2024-03-08 17:32:38