
9.3 KiB
Name
基于DI指标的动态波动率趋势跟踪策略结合ATR止盈止损体系-Dynamic-Volatility-Adjusted-Trend-Following-Strategy-Based-on-DI-Indicators-with-ATR-Stop-Management
Author
ChaoZhang
Strategy Description
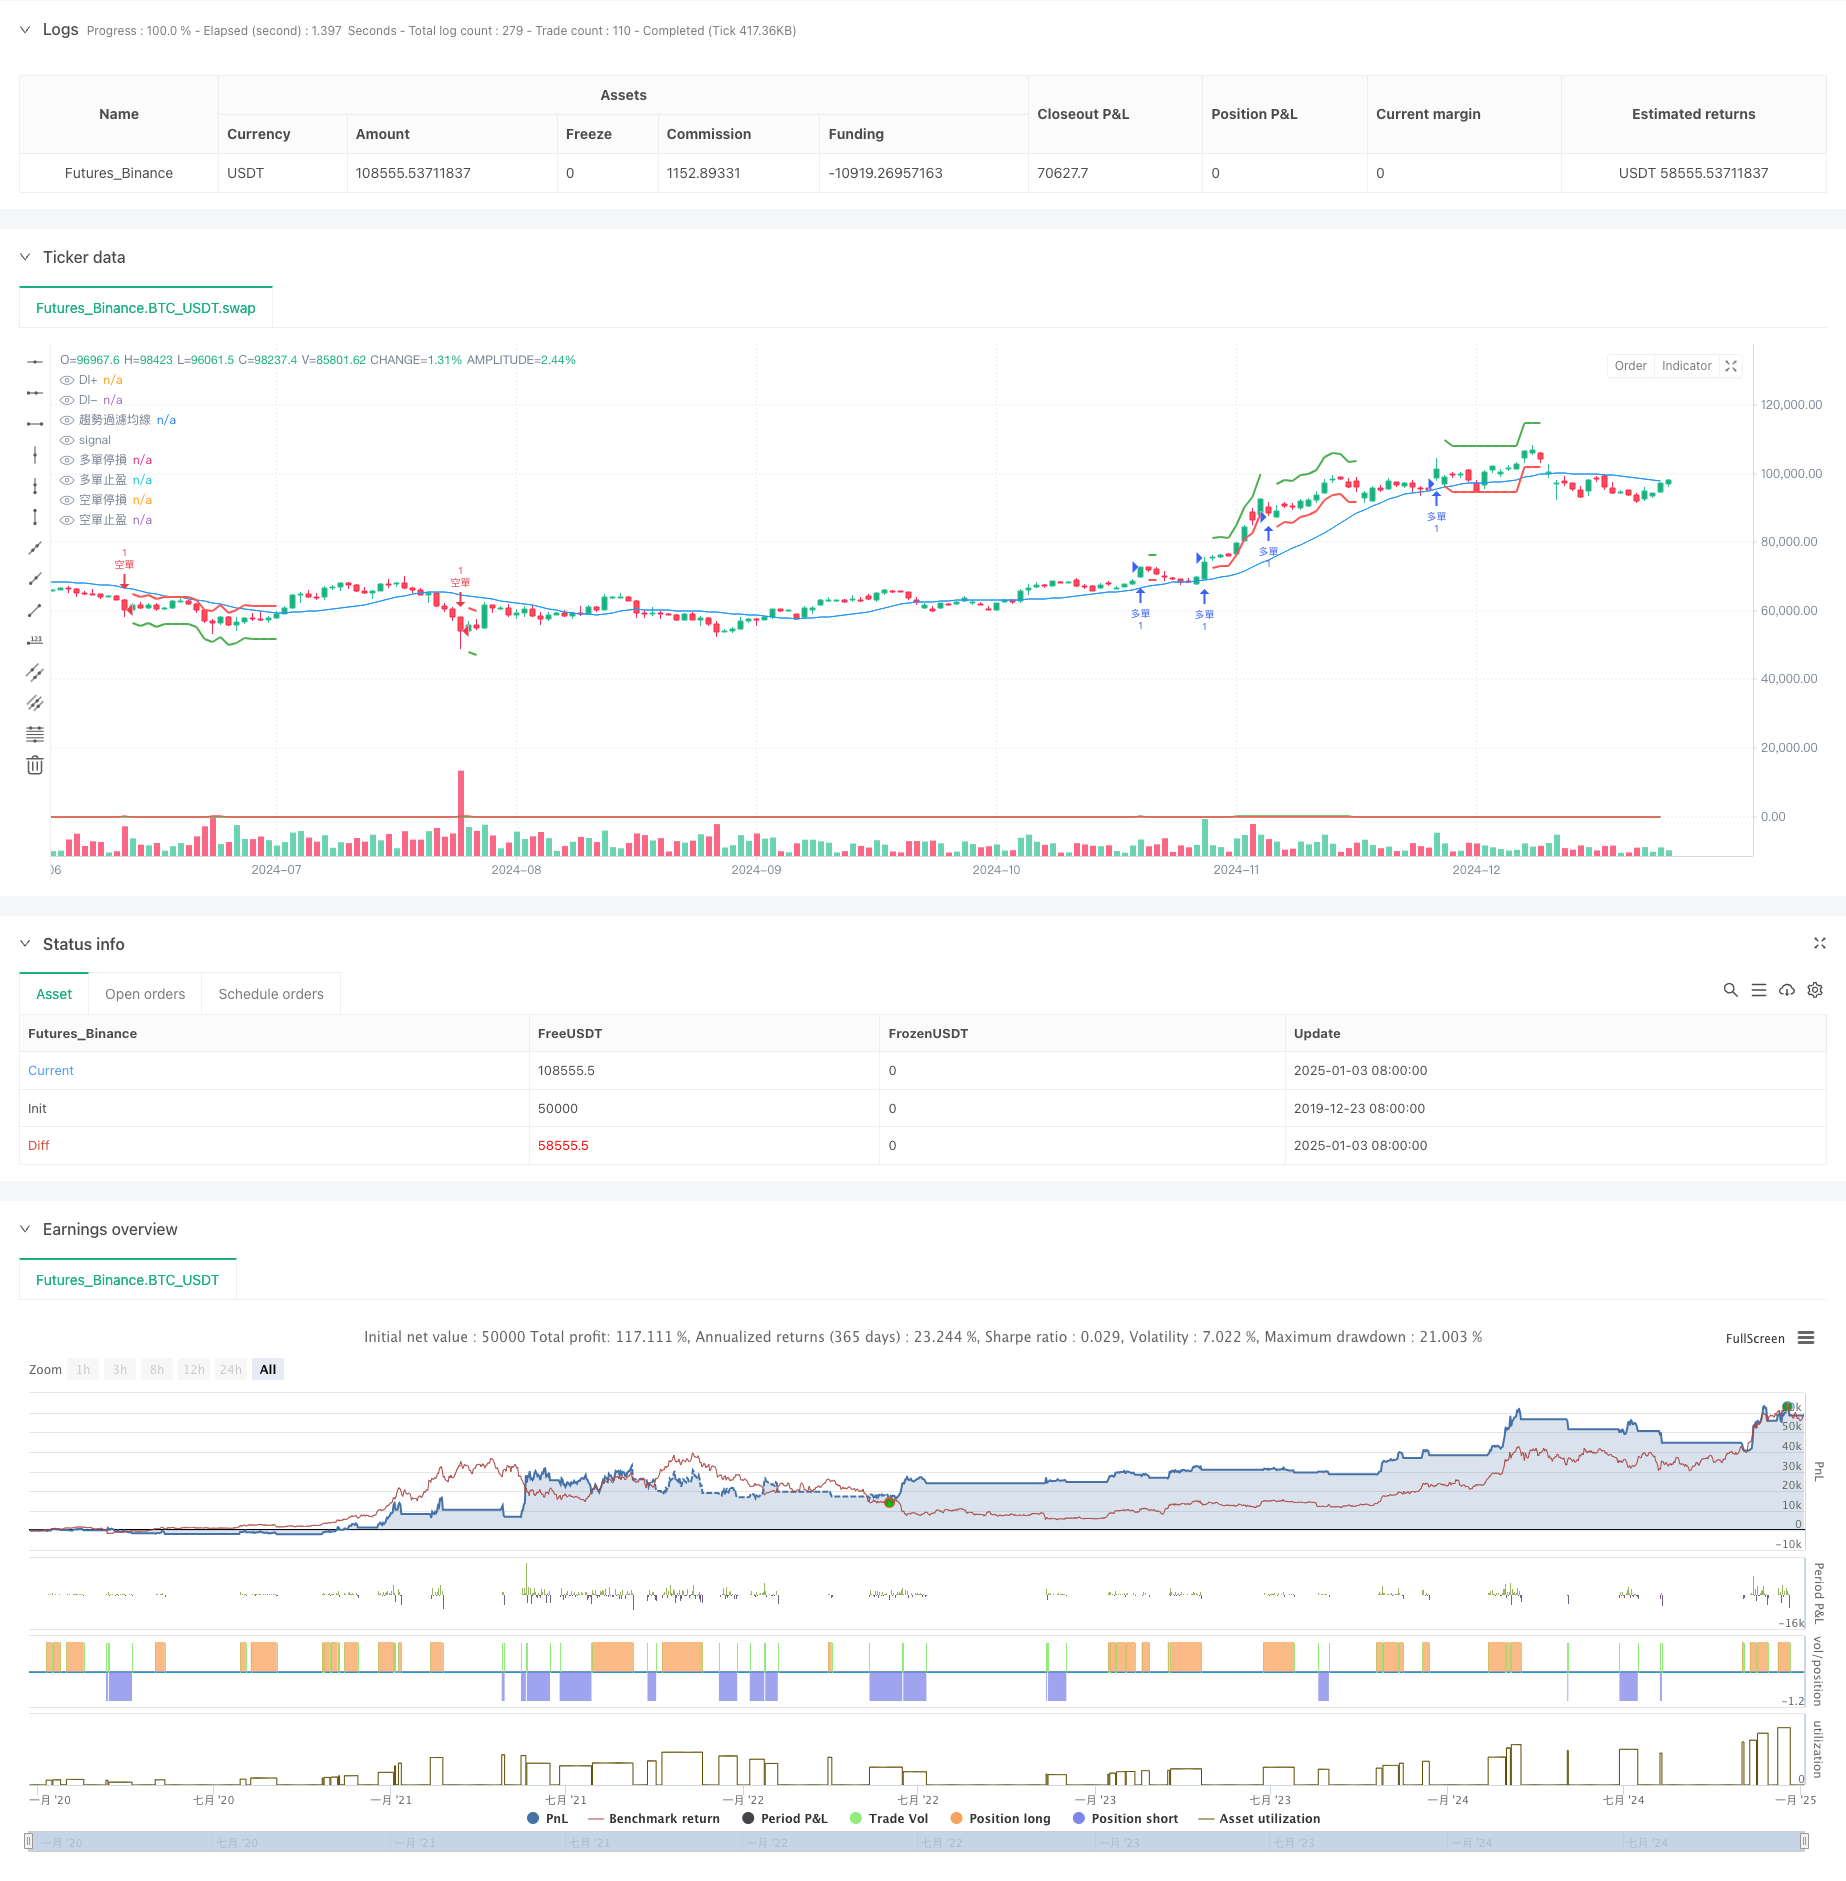
[trans]
概述
本策略是一个结合了趋向指标(DMI)和平均真实波幅(ATR)的趋势跟踪系统。策略核心是通过DI+和DI-指标来识别市场趨势方向和强度,并利用ATR动态调整止盈止损位置。通过引入趋势过滤均线作为辅助确认,进一步提高了交易信号的可靠性。策略设计充分考虑了市场波动性,具有良好的适应性。
策略原理
策略运作基于以下核心机制:
- 使用DI+和DI-指标衡量趋势方向和强度。当DI+高于DI-且差值超过阈值时,表明上升趋势成立;反之则确认下降趋势。
- 引入趋势过滤均线(SMA)作为趋势确认工具。只有当价格与均线位置相互印证时才会触发信号。
- 利用ATR指标动态计算止损和止盈位置,确保风险管理能够适应不同的市场环境。
- 在交易执行时严格遵循时间限制,避免过于频繁的交易。
策略优势
- 动态调整能力强 - 通过ATR实现对市场波动的自适应。
- 风险控制完善 - 设置了基于波动率的动态止损止盈机制。
- 信号可靠性高 - 通过多重指标交叉验证,降低虚假信号。
- 参数灵活可调 - 策略参数可根据不同市场特征进行优化。
- 执行逻辑清晰 - 入场出场条件明确,便于实盘操作。
策略风险
-
震荡市场风险 - 在区间震荡行情中可能产生连续止损。 建议:增加震荡指标过滤或调整参数门槛。
-
滑点风险 - 在波动剧烈时可能面临较大滑点。 建议:适当放宽止损位置,预留滑点空间。
-
假突破风险 - 可能在趋势转折点出现误判。 建议:结合成交量等指标进行信号确认。
-
参数敏感性 - 不同参数组合的表现差异较大。 建议:通过回测寻找稳定性强的参数区间。
策略优化方向
-
信号优化 - 可引入ADX指标评估趋势强度,或增加成交量确认机制。
-
仓位管理 - 可基于趋势强度动态调整持仓规模,实现更精细的风险控制。
-
时间架构 - 可考虑多时间周期分析,增强信号可靠性。
-
市场适应性 - 可根据不同品种特征,开发自适应参数调整机制。
总结
该策略通过结合趋向指标和波动率指标,实现了对趋势的动态跟踪和风险控制。策略设计注重实用性和可操作性,具有较强的市场适应能力。通过参数优化和信号改进,策略还有进一步提升的空间。建议投资者在实际应用时需要充分测试,并根据具体市场特征进行针对性调整。
||
Overview
This strategy is a trend following system that combines the Directional Movement Index (DMI) with Average True Range (ATR). The core mechanism uses DI+ and DI- indicators to identify market trend direction and strength, while utilizing ATR for dynamic stop-loss and take-profit adjustments. The introduction of a trend filtering moving average further enhances signal reliability. The strategy design considers market volatility and demonstrates good adaptability.
Strategy Principle
The strategy operates based on the following core mechanisms:
- Uses DI+ and DI- indicators to measure trend direction and strength. When DI+ exceeds DI- by the threshold value, an uptrend is confirmed; vice versa for downtrends.
- Incorporates a trend filtering moving average (SMA) as a trend confirmation tool. Signals are only triggered when price and moving average positions mutually confirm.
- Utilizes ATR indicator to dynamically calculate stop-loss and take-profit levels, ensuring risk management adapts to different market conditions.
- Strictly follows time restrictions in trade execution to avoid excessive trading frequency.
Strategy Advantages
- Strong Dynamic Adjustment - Achieves market volatility adaptation through ATR.
- Comprehensive Risk Control - Implements volatility-based dynamic stop-loss and take-profit mechanisms.
- High Signal Reliability - Reduces false signals through multiple indicator cross-validation.
- Flexible Parameters - Strategy parameters can be optimized for different market characteristics.
- Clear Execution Logic - Precise entry and exit conditions facilitate real-world implementation.
Strategy Risks
-
Oscillation Market Risk - May result in consecutive stops in range-bound markets. Suggestion: Add oscillation indicators for filtering or adjust parameter thresholds.
-
Slippage Risk - May face significant slippage during high volatility periods. Suggestion: Appropriately widen stop-loss positions to accommodate slippage.
-
False Breakout Risk - Potential misjudgments at trend turning points. Suggestion: Incorporate volume indicators for signal confirmation.
-
Parameter Sensitivity - Performance varies significantly with different parameter combinations. Suggestion: Find stable parameter ranges through backtesting.
Strategy Optimization Directions
-
Signal Optimization - Consider introducing ADX indicator for trend strength evaluation or adding volume confirmation mechanisms.
-
Position Management - Implement dynamic position sizing based on trend strength for more refined risk control.
-
Time Structure - Consider multi-timeframe analysis to enhance signal reliability.
-
Market Adaptability - Develop adaptive parameter adjustment mechanisms based on different instrument characteristics.
Summary
This strategy achieves dynamic trend following and risk control by combining directional and volatility indicators. The strategy design emphasizes practicality and operability, demonstrating strong market adaptability. Through parameter optimization and signal improvements, there is room for further enhancement. Investors are advised to thoroughly test and make specific adjustments based on market characteristics before implementation.[/trans]
Source (PineScript)
/*backtest
start: 2019-12-23 08:00:00
end: 2025-01-04 08:00:00
period: 1d
basePeriod: 1d
exchanges: [{"eid":"Futures_Binance","currency":"BTC_USDT"}]
*/

//@version=5
strategy("使用 DI+ 和 DI- 的策略 (最終完整修正且含圖表止損止盈線)", overlay=true)

// 輸入參數
diLength = input.int(title="DI 長度", defval=14)
adxSmoothing = input.int(title="ADX Smoothing", defval=14)
trendFilterLength = input.int(title="趨勢過濾均線長度", defval=20)
strengthThreshold = input.int(title="趨勢強度門檻值", defval=20)
atrLength = input.int(title="ATR 長度", defval=14)
atrMultiplierStop = input.float(title="ATR 停損倍數", defval=1.5)
atrMultiplierTakeProfit = input.float(title="ATR 止盈倍數", defval=2.5)

// 計算 DI+ 和 DI-
[diPlus, diMinus, _] = ta.dmi(diLength, adxSmoothing)

// 計算趨勢過濾均線
trendFilterMA = ta.sma(close, trendFilterLength)

// 判斷趨勢方向和強度
strongUpTrend = diPlus > diMinus + strengthThreshold and close > trendFilterMA
strongDownTrend = diMinus > diPlus + strengthThreshold and close < trendFilterMA

// 計算 ATR
atr = ta.atr(atrLength)

// 追蹤止損止盈價格 (使用 var 宣告,只在進場時更新)
var float longStopPrice = na
var float longTakeProfitPrice = na
var float shortStopPrice = na
var float shortTakeProfitPrice = na

// 進場邏輯
longCondition = strongUpTrend
shortCondition = strongDownTrend

if (longCondition)
    strategy.entry("多單", strategy.long)
    longStopPrice := close - atr * atrMultiplierStop // 進場時計算並更新止損價
    longTakeProfitPrice := close + atr * atrMultiplierTakeProfit // 進場時計算並更新止盈價

if (shortCondition)
    strategy.entry("空單", strategy.short)
    shortStopPrice := close + atr * atrMultiplierStop // 進場時計算並更新止損價
    shortTakeProfitPrice := close - atr * atrMultiplierTakeProfit // 進場時計算並更新止盈價


// 出場邏輯 (使用 time 限制和 ATR)
inLongPosition = strategy.position_size > 0
inShortPosition = strategy.position_size < 0

lastEntryTime = strategy.opentrades.entry_bar_index(strategy.opentrades - 1)

if (inLongPosition and time > lastEntryTime)
    strategy.exit("多單出場", "多單", stop=longStopPrice, limit=longTakeProfitPrice)

if (inShortPosition and time > lastEntryTime)
    strategy.exit("空單出場", "空單", stop=shortStopPrice, limit=shortTakeProfitPrice)

// 繪製 DI+、DI- 和趨勢過濾均線
plot(diPlus, color=color.green, title="DI+")
plot(diMinus, color=color.red, title="DI-")
plot(trendFilterMA, color=color.blue, title="趨勢過濾均線")

// 繪製止損止盈線 (使用 plot 函數繪製)
plot(strategy.position_size > 0 ? longStopPrice : na, color=color.red, style=plot.style_linebr, linewidth=2, title="多單停損")
plot(strategy.position_size > 0 ? longTakeProfitPrice : na, color=color.green, style=plot.style_linebr, linewidth=2, title="多單止盈")
plot(strategy.position_size < 0 ? shortStopPrice : na, color=color.red, style=plot.style_linebr, linewidth=2, title="空單停損")
plot(strategy.position_size < 0 ? shortTakeProfitPrice : na, color=color.green, style=plot.style_linebr, linewidth=2, title="空單止盈")
Detail
https://www.fmz.com/strategy/477595
Last Modified
2025-01-06 16:18:01