
7.1 KiB
Name
基于Chande动量振荡器的自适应均值回归交易策略-Adaptive-Mean-Reversion-Trading-Strategy-Based-on-Chande-Momentum-Oscillator
Author
ChaoZhang
Strategy Description
[trans]
概述
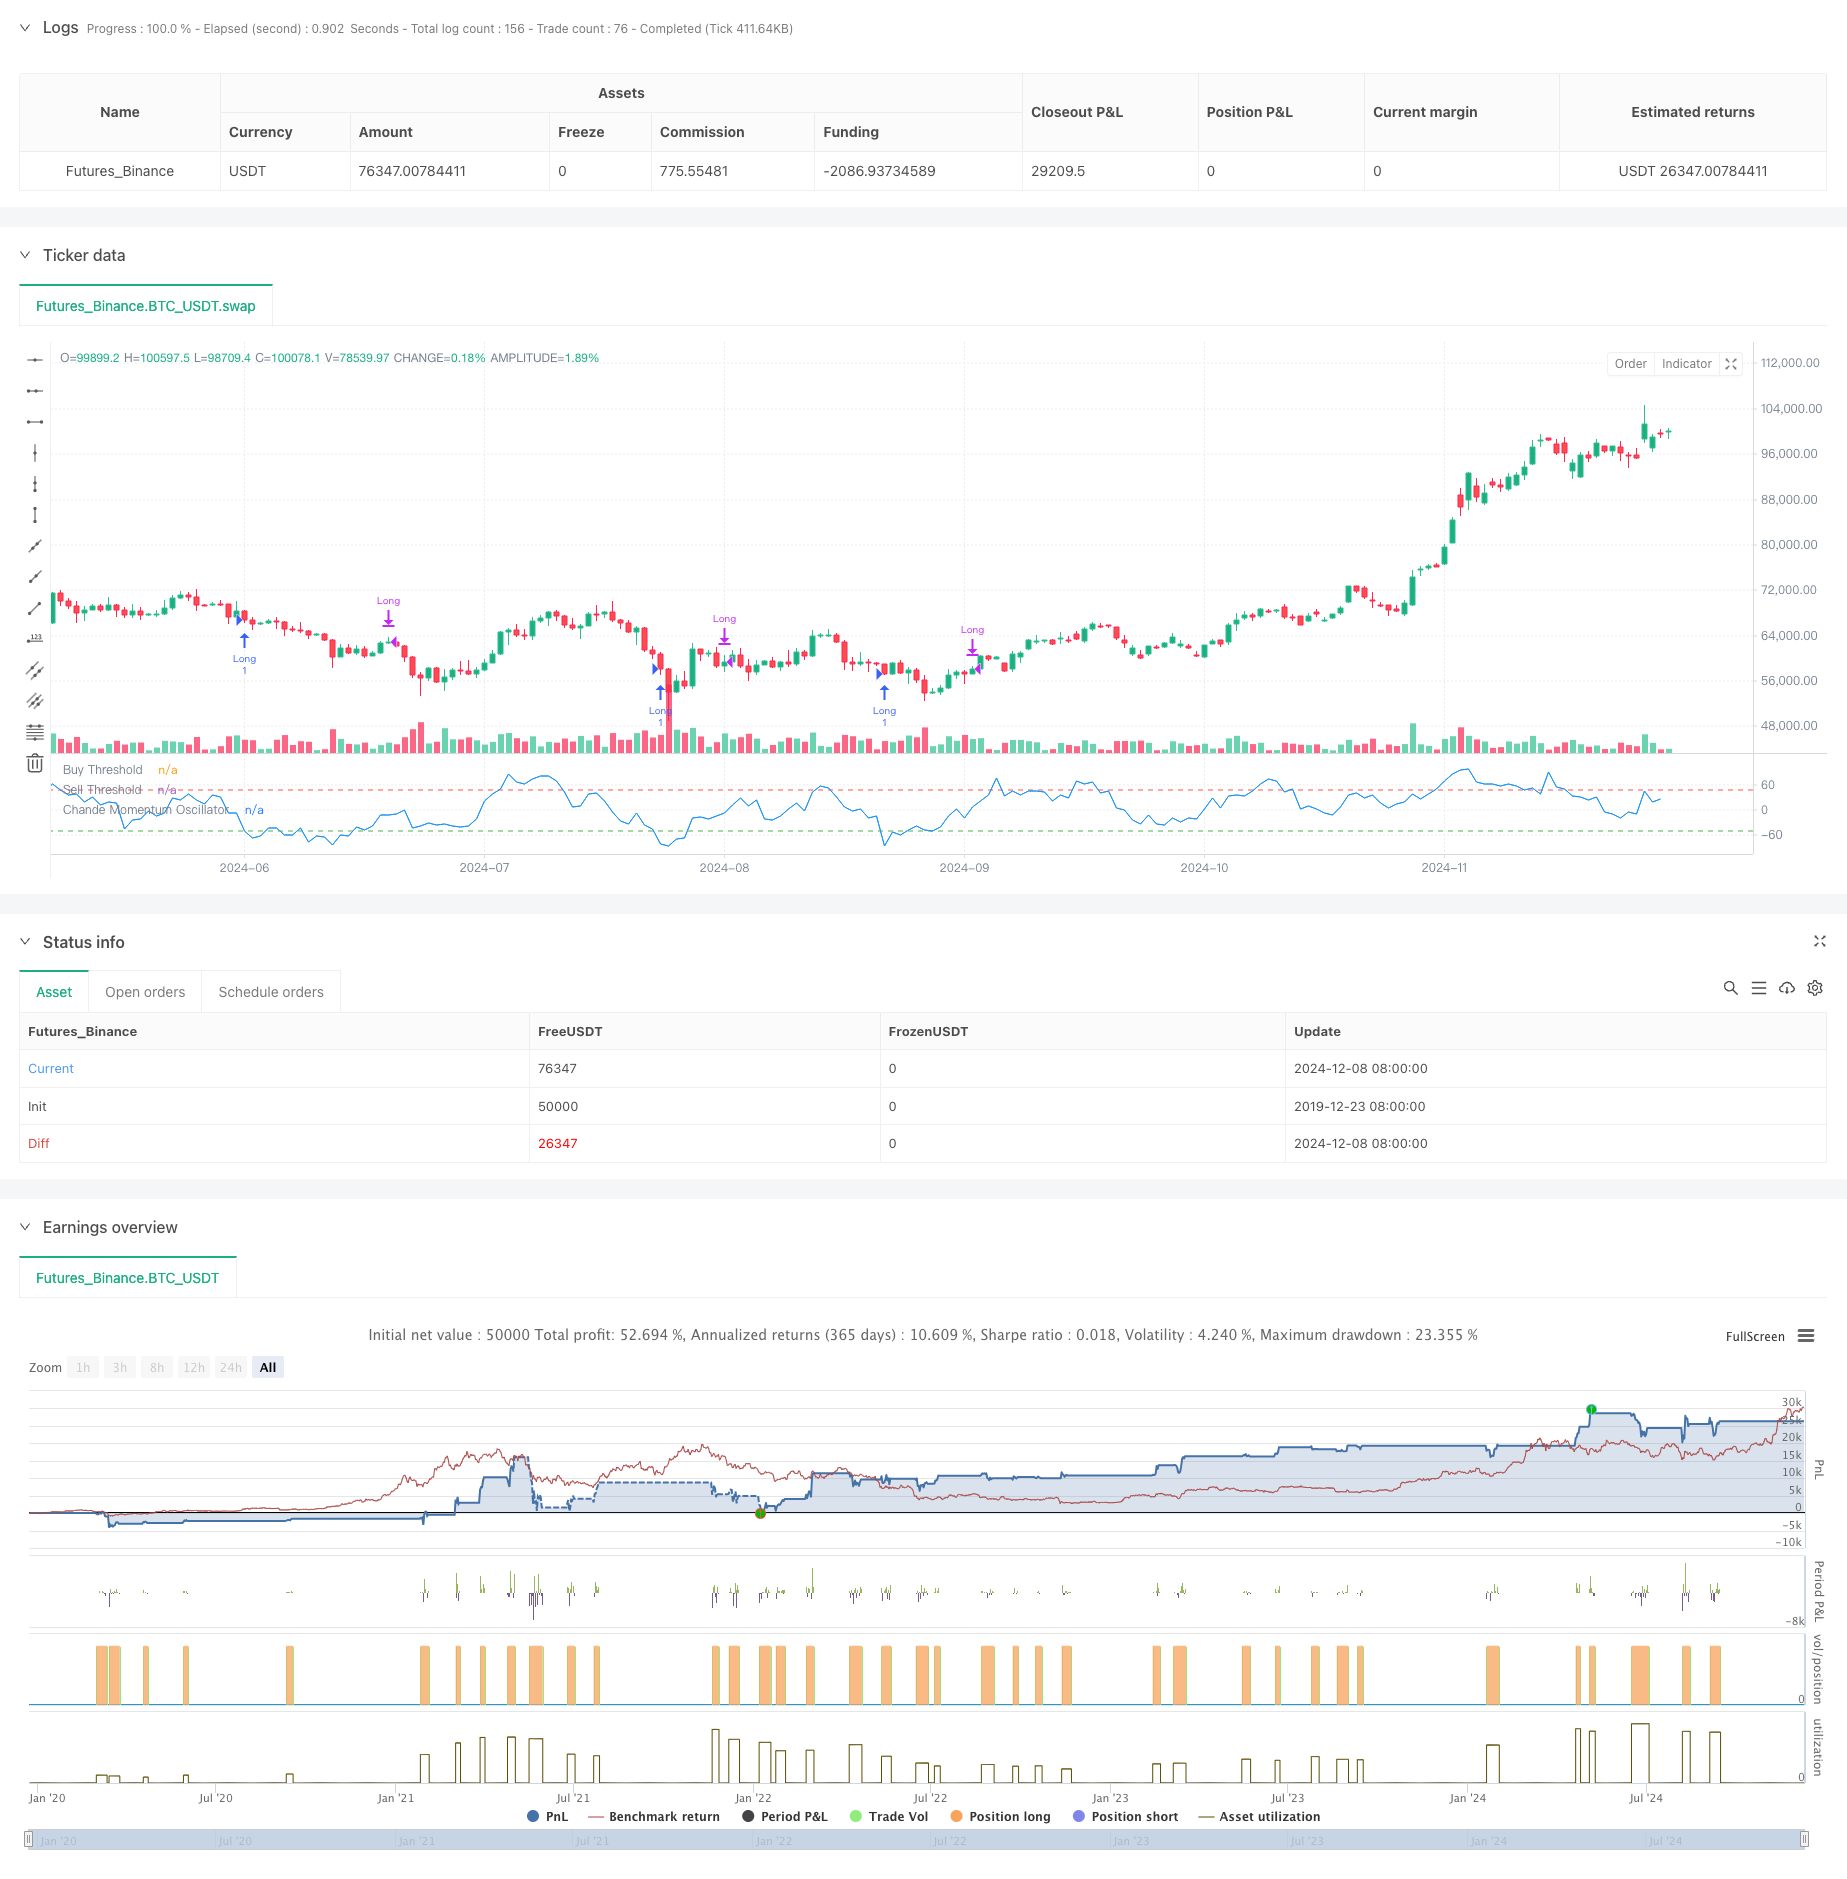
基于Chande动量振荡器(CMO)的均值回归交易策略是一种技术分析策略,通过计算一定时期内价格变动的动量来识别超买超卖区域。该策略主要通过监测资产价格的动量变化,在价格出现极端偏离时进行交易,以捕捉价格回归均值的机会。策略采用9天周期的CMO指标作为核心信号,在CMO低于-50时开仓做多,在CMO高于50或持仓时间超过5天时平仓。
策略原理
策略的核心是CMO指标的计算和应用。CMO通过计算一定周期内上涨和下跌的差值与总和的比值来衡量动量。具体计算公式为: CMO = 100 × (上涨和 - 下跌和)/(上涨和 + 下跌和)
与传统RSI不同,CMO在分子中同时使用了涨跌数据,提供了更对称的动量测量。策略在CMO低于-50时认为市场超卖,预期价格会回升,因此开仓做多。当CMO升至50以上或开仓超过5天时,策略平仓止盈或止损。
策略优势
- 信号明确 - CMO提供了清晰的超买超卖判断标准,交易信号明确,不会产生模棱两可的情况
- 风险控制完善 - 通过设置最大持仓时间,避免了长期套牢的风险
- 适应性强 - 策略可以根据不同市场情况调整参数,具有良好的适应性
- 理论基础扎实 - 基于成熟的均值回归理论,具有可靠的学术支持
- 计算简单 - 指标计算方法简单直观,易于理解和实现
策略风险
- 趋势市场风险 - 在强趋势市场中,均值回归策略可能频繁亏损
- 参数敏感性 - CMO周期和阈值的选择对策略表现影响较大
- 假信号风险 - 在市场波动剧烈时可能产生虚假信号
- 时间风险 - 固定的平仓时间可能错过更好的获利机会
- 滑点风险 - 在流动性较差的市场中可能面临较大滑点
策略优化方向
- 引入趋势过滤 - 可以添加长期趋势指标,在顺势时才开仓
- 动态参数优化 - 根据市场波动率动态调整CMO周期和阈值
- 完善止损机制 - 增加动态止损,保护已有利润
- 优化持仓时间 - 可以根据波动率动态调整最大持仓时间
- 增加成交量确认 - 结合成交量指标提高信号可靠性
总结
该策略通过CMO指标捕捉市场超买超卖机会,结合固定时间止损,构建了一个稳健的均值回归交易系统。策略逻辑清晰,风险控制合理,具有良好的实用价值。通过进一步优化参数和增加辅助指标,策略的稳定性和盈利能力还可以进一步提升。 ||
Overview
The Mean-Reversion Trading Strategy based on the Chande Momentum Oscillator (CMO) is a technical analysis strategy that identifies overbought and oversold zones by calculating price momentum over a specific period. The strategy monitors momentum changes in asset prices and trades when prices show extreme deviations, aiming to capture mean-reversion opportunities. It uses a 9-day CMO indicator as the core signal, entering long positions when CMO falls below -50 and exiting when CMO rises above 50 or the holding period exceeds 5 days.
Strategy Principle
The core of the strategy lies in the calculation and application of the CMO indicator. CMO measures momentum by computing the ratio of the difference between gains and losses to their sum over a specified period. The formula is: CMO = 100 × (Sum of Gains - Sum of Losses)/(Sum of Gains + Sum of Losses)
Unlike traditional RSI, CMO uses both up and down movements in the numerator, providing a more symmetrical momentum measurement. The strategy enters long positions when CMO falls below -50, indicating oversold conditions and expecting price recovery. Positions are closed when CMO rises above 50 or after holding for 5 days.
Strategy Advantages
- Clear Signals - CMO provides definitive overbought and oversold criteria, generating unambiguous trading signals
- Robust Risk Control - Maximum holding period prevents long-term position trapping
- High Adaptability - Parameters can be adjusted for different market conditions
- Solid Theoretical Foundation - Based on well-established mean-reversion theory with academic support
- Simple Calculation - Indicator methodology is straightforward and easy to understand
Strategy Risks
- Trend Market Risk - Mean-reversion strategies may suffer frequent losses in strong trending markets
- Parameter Sensitivity - Strategy performance heavily depends on CMO period and threshold selection
- False Signal Risk - Volatile markets may generate false signals
- Time Risk - Fixed exit timing might miss better profit opportunities
- Slippage Risk - May face significant slippage in low liquidity markets
Optimization Directions
- Trend Filtering - Add long-term trend indicators to trade only with the trend
- Dynamic Parameter Optimization - Adjust CMO period and thresholds based on market volatility
- Enhanced Stop-Loss - Implement dynamic stop-loss to protect profits
- Holding Period Optimization - Dynamically adjust maximum holding time based on volatility
- Volume Confirmation - Incorporate volume indicators to improve signal reliability
Summary
The strategy captures market overbought and oversold opportunities through the CMO indicator, combining fixed-time stop-loss to build a robust mean-reversion trading system. It features clear logic and reasonable risk control with practical value. The strategy's stability and profitability can be further enhanced through parameter optimization and additional auxiliary indicators.[/trans]
Source (PineScript)
/*backtest
start: 2019-12-23 08:00:00
end: 2024-12-09 08:00:00
period: 1d
basePeriod: 1d
exchanges: [{"eid":"Futures_Binance","currency":"BTC_USDT"}]
*/

//@version=5
strategy("Chande Momentum Oscillator Strategy", overlay=false)

// Input for the CMO period
cmoPeriod = input.int(9, minval=1, title="CMO Period")

// Calculate price changes
priceChange = ta.change(close)

// Separate positive and negative changes
up = priceChange > 0 ? priceChange : 0
down = priceChange < 0 ? -priceChange : 0

// Calculate the sum of ups and downs using a rolling window
sumUp = ta.sma(up, cmoPeriod) * cmoPeriod
sumDown = ta.sma(down, cmoPeriod) * cmoPeriod

// Calculate the Chande Momentum Oscillator (CMO)
cmo = 100 * (sumUp - sumDown) / (sumUp + sumDown)

// Define the entry and exit conditions
buyCondition = cmo < -50
sellCondition1 = cmo > 50
sellCondition2 = ta.barssince(buyCondition) >= 5

// Track if we are in a long position
var bool inTrade = false

if (buyCondition and not inTrade)
    strategy.entry("Long", strategy.long)
    inTrade := true

if (sellCondition1 or sellCondition2)
    strategy.close("Long")
    inTrade := false

// Plot the Chande Momentum Oscillator
plot(cmo, title="Chande Momentum Oscillator", color=color.blue)
hline(-50, "Buy Threshold", color=color.green)
hline(50, "Sell Threshold", color=color.red)
Detail
https://www.fmz.com/strategy/474705
Last Modified
2024-12-11 17:17:50