
9.5 KiB
Name
基于ATR的动态跟踪止损交易策略-Dynamic-ATR-based-Trailing-Stop-Trading-Strategy
Author
ChaoZhang
Strategy Description
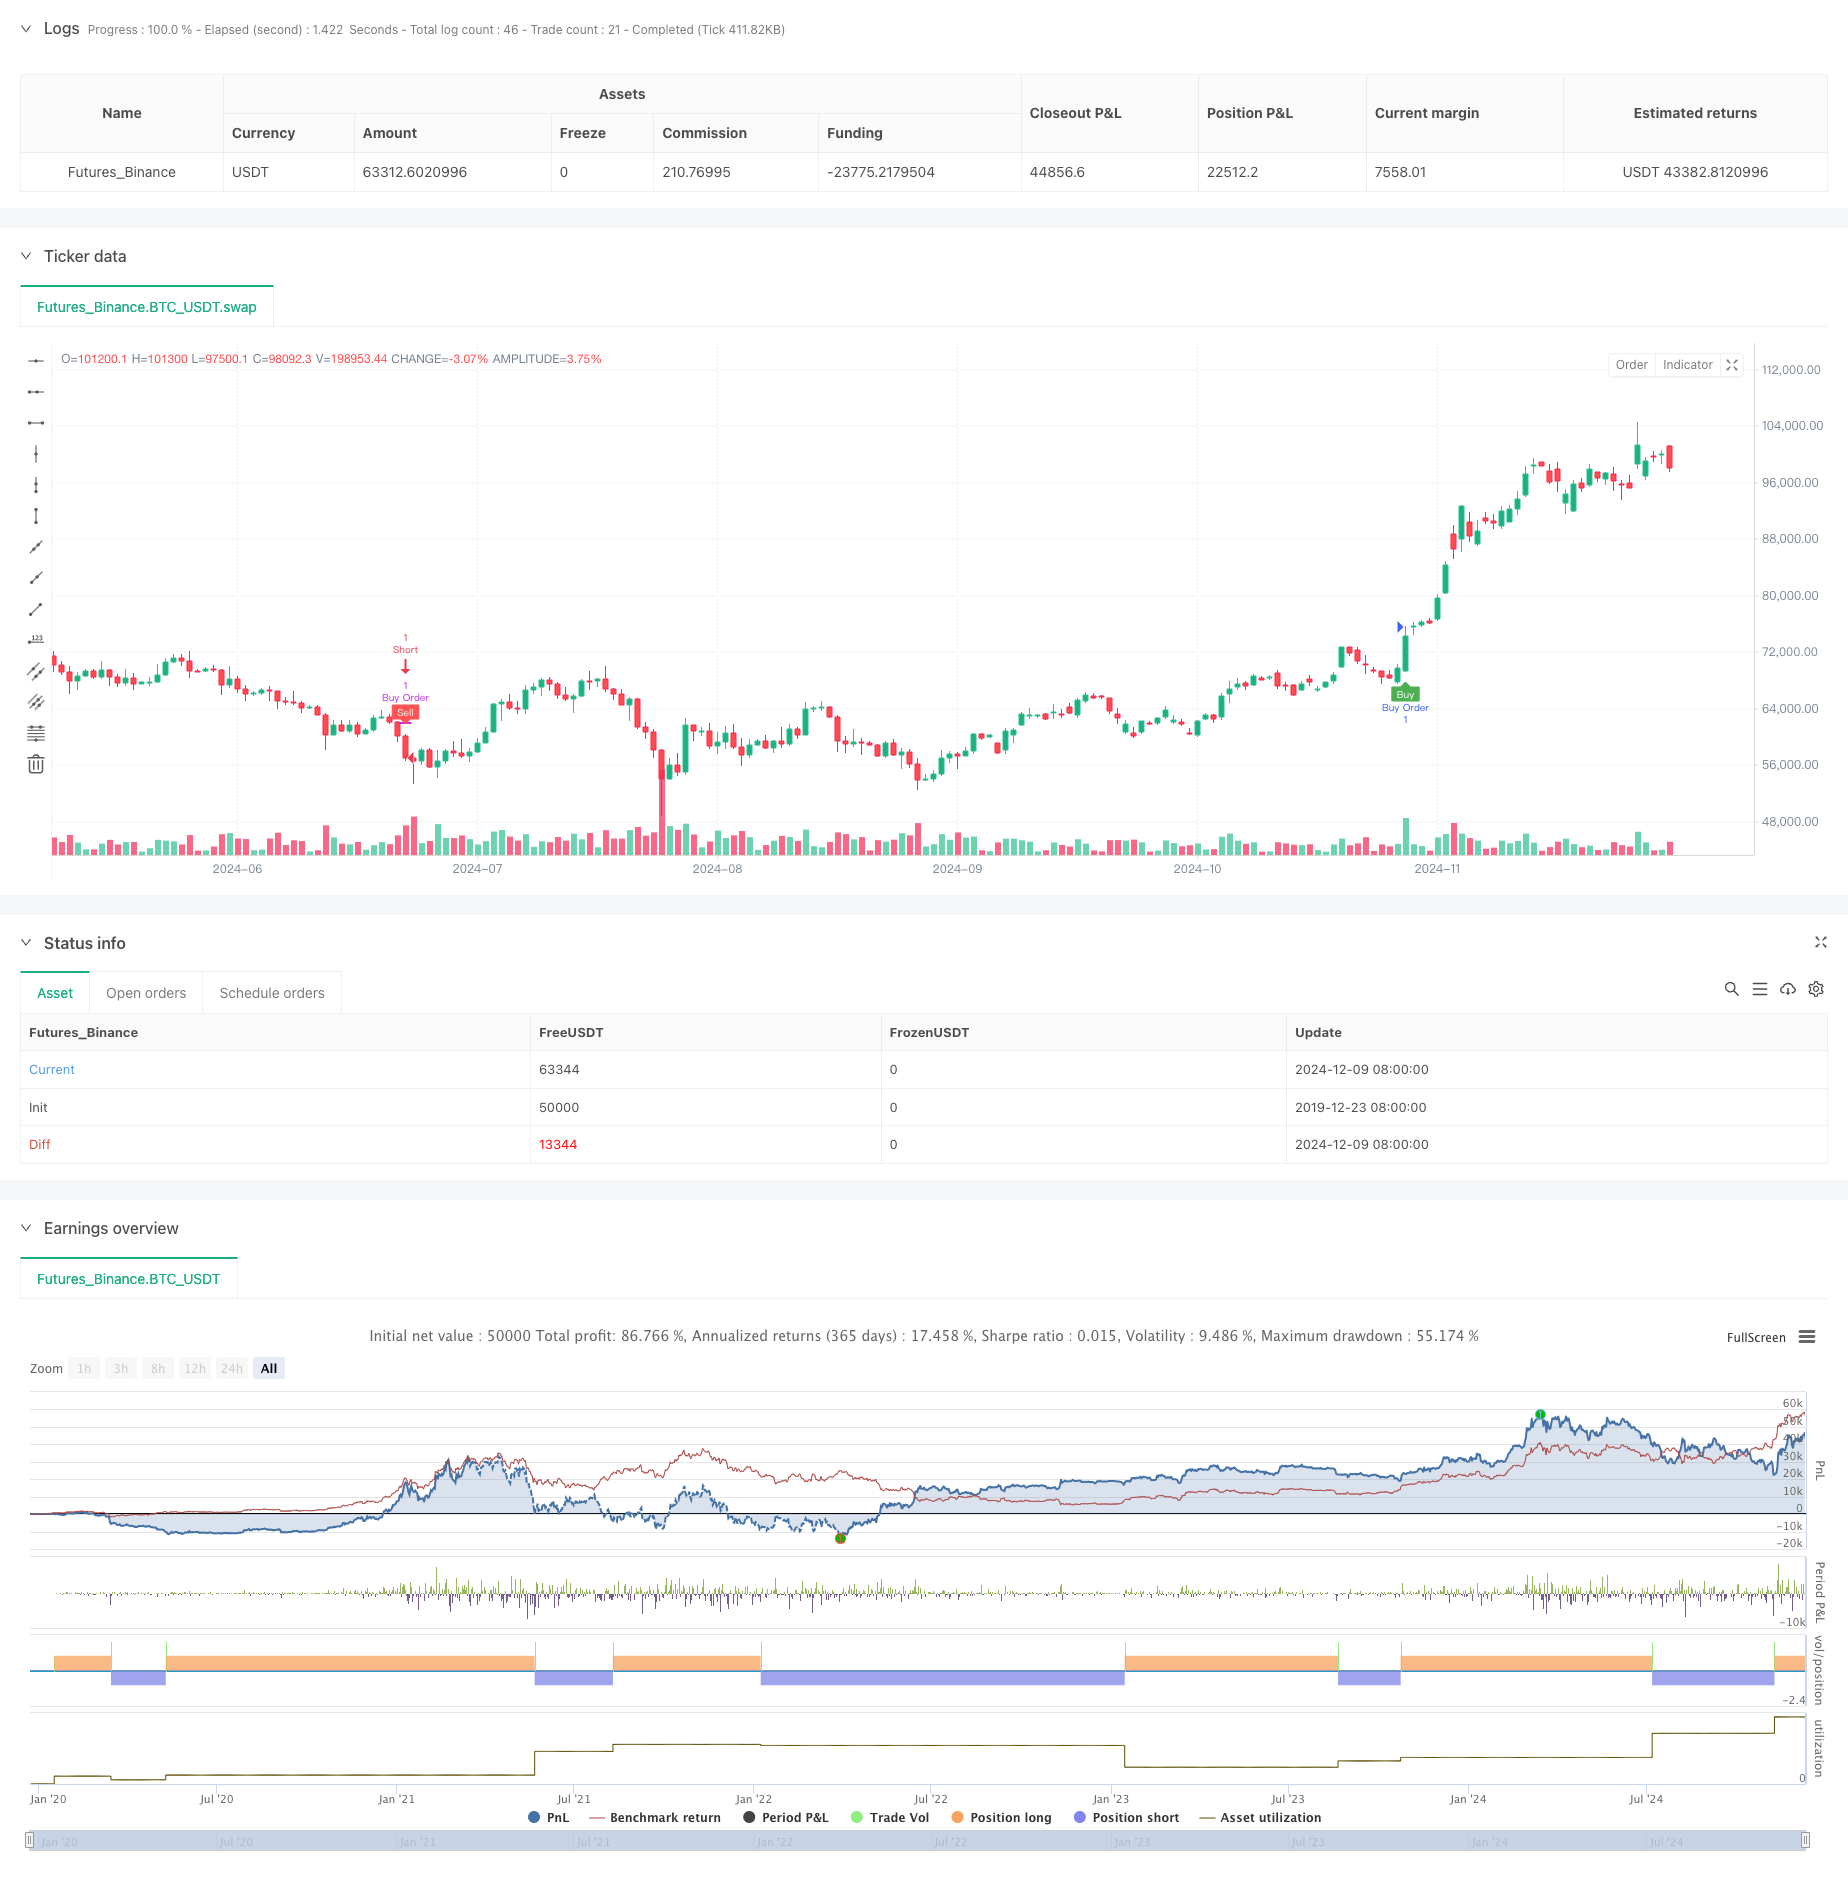
[trans]
概述
该策略是一个基于ATR(平均真实波幅)指标的动态跟踪止损策略。它通过ATR值动态调整止损位置,并结合EMA均线进行交易信号的确认。策略支持灵活的仓位管理,可以根据不同的市场环境和交易品种自定义买卖数量。它特别适合在5分钟到2小时等中等时间周期上运行,能够有效捕捉市场趋势。
策略原理
策略的核心逻辑基于以下几个关键要素:
- 使用ATR指标计算市场波动率,并通过用户自定义的系数来调整止损距离
- 建立动态跟踪止损线,该止损线会随着价格的变动而自动调整
- 使用EMA均线与跟踪止损线的交叉来确认交易信号
- 在价格突破跟踪止损线且EMA确认时产生交易信号
- 通过仓位管理系统控制每次交易的数量,并实时跟踪投资组合状态
策略优势
- 自适应性强 - ATR指标能够根据市场波动自动调整止损距离,使策略在不同市场环境下都能保持良好表现
- 风险管理完善 - 动态跟踪止损机制能够有效保护已获利润,同时限制潜在损失
- 操作灵活 - 支持自定义交易数量和ATR参数,可以根据不同交易品种特点进行优化
- 信号可靠 - 通过EMA均线确认,降低虚假信号的影响
- 全自动化 - 策略可以完全自动化运行,减少人为情绪干扰
策略风险
- 震荡市场风险 - 在横盘震荡市场可能产生频繁的假突破信号,导致过多交易
- 滑点风险 - 在快速行情中可能面临较大滑点,影响策略表现
- 参数敏感性 - ATR周期和系数的选择对策略表现影响较大
- 资金管理风险 - 如果交易数量设置不当,可能带来过度杠杆风险
- 市场波动风险 - 在剧烈波动时期,止损位可能被瞬间击穿
策略优化方向
- 引入市场环境识别机制,在不同市场状态下使用不同的参数组合
- 添加成交量因素作为信号过滤条件,提高交易信号的可靠性
- 优化资金管理算法,根据波动率动态调整持仓规模
- 增加时间过滤机制,避免在不适合交易的时段进行操作
- 开发自适应参数优化系统,实现参数的动态调整
总结
该策略通过结合ATR指标和EMA均线,构建了一个可靠的动态跟踪止损系统。它的优势在于能够自适应市场波动,具有完善的风险管理机制,同时保持操作的灵活性。虽然存在一些固有风险,但通过持续优化和完善,策略有望在不同市场环境下都能保持稳定的表现。建议交易者在实盘使用前,充分测试参数组合,并根据具体交易品种的特点进行针对性优化。 ||
Overview
This strategy is a dynamic trailing stop strategy based on the Average True Range (ATR) indicator. It adjusts stop-loss positions dynamically through ATR values and confirms trading signals using EMA crossovers. The strategy supports flexible position management and allows customization of buy/sell quantities based on different market environments and trading instruments. It performs particularly well in medium timeframes ranging from 5 minutes to 2 hours, effectively capturing market trends.
Strategy Principles
The core logic of the strategy is based on several key elements:
- Uses ATR indicator to calculate market volatility and adjusts stop-loss distance through user-defined coefficients
- Establishes a dynamic trailing stop line that automatically adjusts with price movements
- Uses EMA crossovers with the trailing stop line to confirm trading signals
- Generates trading signals when price breaks through the trailing stop line with EMA confirmation
- Controls trading quantity through a position management system and tracks portfolio status in real-time
Strategy Advantages
- Strong Adaptability - ATR indicator automatically adjusts stop-loss distance based on market volatility, ensuring good performance in different market environments
- Comprehensive Risk Management - Dynamic trailing stop mechanism effectively protects profits while limiting potential losses
- Operational Flexibility - Supports customizable trading quantities and ATR parameters for optimization across different instruments
- Reliable Signals - EMA confirmation reduces the impact of false signals
- Full Automation - Strategy can run completely automatically, reducing emotional interference
Strategy Risks
- Choppy Market Risk - May generate frequent false breakout signals in sideways markets, leading to excessive trading
- Slippage Risk - May face significant slippage in fast-moving markets, affecting strategy performance
- Parameter Sensitivity - Choice of ATR period and coefficients significantly impacts strategy performance
- Money Management Risk - Improper trading quantity settings may lead to excessive leverage risk
- Market Volatility Risk - Stop-loss levels may be breached instantly during periods of extreme volatility
Strategy Optimization Directions
- Introduce market environment recognition mechanism to use different parameter combinations in different market states
- Add volume factors as signal filters to improve trading signal reliability
- Optimize money management algorithm to dynamically adjust position size based on volatility
- Add time filtering mechanism to avoid trading during unsuitable periods
- Develop adaptive parameter optimization system for dynamic parameter adjustment
Summary
This strategy builds a reliable dynamic trailing stop system by combining ATR indicator and EMA moving average. Its strengths lie in market volatility adaptation, comprehensive risk management, and operational flexibility. While inherent risks exist, the strategy shows promise for stable performance across different market environments through continuous optimization and improvement. Traders are advised to thoroughly test parameter combinations and optimize based on specific instrument characteristics before live trading.[/trans]
Source (PineScript)
/*backtest
start: 2019-12-23 08:00:00
end: 2024-12-10 08:00:00
period: 1d
basePeriod: 1d
exchanges: [{"eid":"Futures_Binance","currency":"BTC_USDT"}]
*/

//@version=5
strategy(title='ADET GİRMELİ Trend İz Süren Stop Strategy', overlay=true, overlay=true,default_qty_type = strategy.fixed, default_qty_value = 1)

// Inputs
a = input(9, title='Key Value. "This changes the sensitivity"')
c = input(3, title='ATR Period')
h = input(false, title='Signals from Heikin Ashi Candles')

xATR = ta.atr(c)
nLoss = a * xATR

src = h ? request.security(ticker.heikinashi(syminfo.tickerid), timeframe.period, close, lookahead=barmerge.lookahead_off) : close

xATRTrailingStop = 0.0
iff_1 = src > nz(xATRTrailingStop[1], 0) ? src - nLoss : src + nLoss
iff_2 = src < nz(xATRTrailingStop[1], 0) and src[1] < nz(xATRTrailingStop[1], 0) ? math.min(nz(xATRTrailingStop[1]), src + nLoss) : iff_1
xATRTrailingStop := src > nz(xATRTrailingStop[1], 0) and src[1] > nz(xATRTrailingStop[1], 0) ? math.max(nz(xATRTrailingStop[1]), src - nLoss) : iff_2

pos = 0
iff_3 = src[1] > nz(xATRTrailingStop[1], 0) and src < nz(xATRTrailingStop[1], 0) ? -1 : nz(pos[1], 0)
pos := src[1] < nz(xATRTrailingStop[1], 0) and src > nz(xATRTrailingStop[1], 0) ? 1 : iff_3

xcolor = pos == -1 ? color.red : pos == 1 ? color.green : color.blue

ema = ta.ema(src, 1)
above = ta.crossover(ema, xATRTrailingStop)
below = ta.crossover(xATRTrailingStop, ema)

buy = src > xATRTrailingStop and above
sell = src < xATRTrailingStop and below

barbuy = src > xATRTrailingStop
barsell = src < xATRTrailingStop
// Alım ve Satım Sinyalleri
buySignal = src > xATRTrailingStop and above
sellSignal = src < xATRTrailingStop and below

// Kullanıcı girişi
sell_quantity = input.int(1, title="Sell Quantity", minval=1)
buy_quantity = input.int(1, title="Buy Quantity", minval=1)

// Portföy miktarı (örnek simülasyon verisi)
var portfolio_quantity = 0

// Sinyal üretimi (örnek sinyal, gerçek stratejinizle değiştirin)
indicator_signal = (src > xATRTrailingStop and above) ? "buy" :
                   (src < xATRTrailingStop and below) ? "sell" : "hold"

// Şartlara göre al/sat
if indicator_signal == "buy" and portfolio_quantity < buy_quantity
    strategy.entry("Buy Order", strategy.long, qty=buy_quantity)
    portfolio_quantity := portfolio_quantity + buy_quantity

if indicator_signal == "sell" and portfolio_quantity >= sell_quantity
    strategy.close("Buy Order", qty=sell_quantity)
    portfolio_quantity := portfolio_quantity - sell_quantity
// Plot buy and sell signals
plotshape(buy, title='Buy', text='Buy', style=shape.labelup, location=location.belowbar, color=color.new(color.green, 0), textcolor=color.new(color.white, 0), size=size.tiny)
plotshape(sell, title='Sell', text='Sell', style=shape.labeldown, location=location.abovebar, color=color.new(color.red, 0), textcolor=color.new(color.white, 0), size=size.tiny)

// Bar coloring
barcolor(barbuy ? color.rgb(6, 250, 14) : na)
barcolor(barsell ? color.red : na)

// Alerts
alertcondition(buy, 'UT Long', 'UT Long')
alertcondition(sell, 'UT Short', 'UT Short')

// Strategy Entry and Exit
if buy
    strategy.entry('Long', strategy.long)
if sell
    strategy.entry('Short', strategy.short)

// Optional Exit Conditions
if sell
    strategy.close('Long')
if buy
    strategy.close('Short')
Detail
https://www.fmz.com/strategy/474872
Last Modified
2024-12-12 16:18:19