
25 KiB
Name
基于ATR和追踪止损的超级趋势策略SuperTrend-Strategy-with-Trailing-Stop-Loss
Author
ChaoZhang
Strategy Description
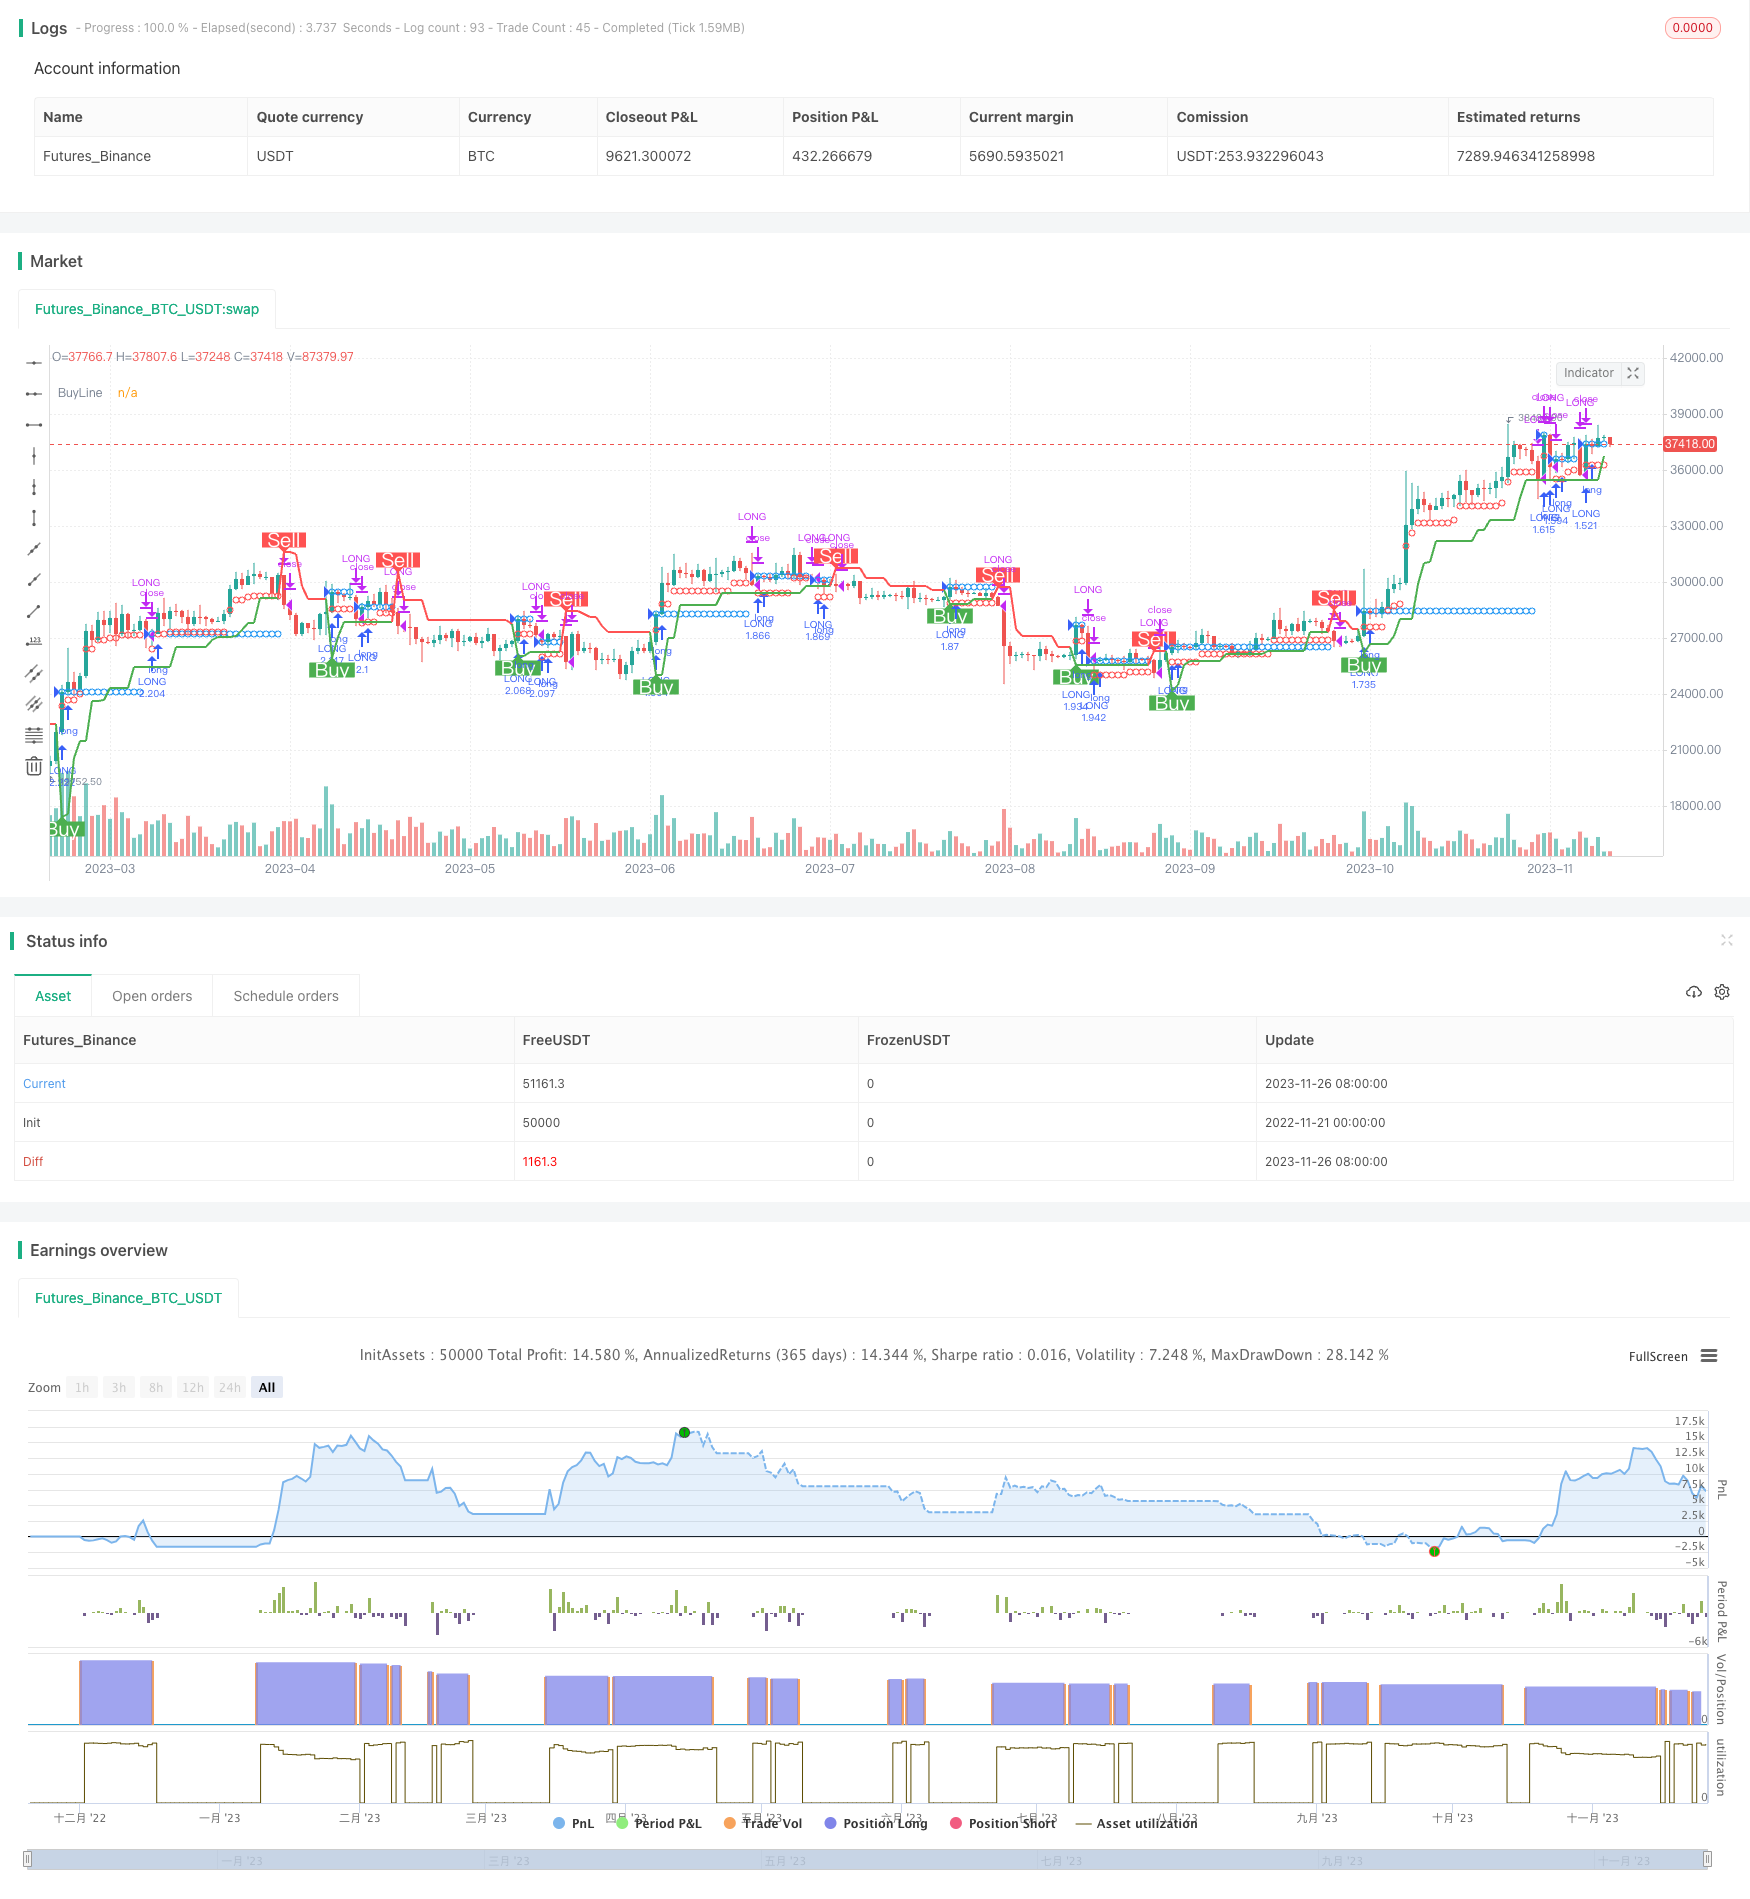
[trans]
概述
本策略基于平均真实波动幅度(ATR)指标设计了一个移动止损线和反转线。它会根据价格变动来 trailing stop loss,即追踪调整止损线。具体来说,如果价格变动超过1%,止损线就会向利润方向移动固定比例。当价格突破止损线时,头寸会被自动平仓。这可以锁定利润,也可以减少损失。
策略原理
该策略使用ATR指标计算止损线。具体公式如下:
atr = multplierFactor * atr(barsBack)

longStop = hl2 - atr
shortStop = hl2 + atr
其中multplierFactor是ATR放大系数,barsBack是ATR周期数。ATR值越大,表示市场波动越大。
根据ATR值计算出长仓止损线longStop和短仓止损线shortStop。当价格超过这两条线时就发出交易信号。
此外,该策略还引入一个direction变量判断趋势方向:
direction = 1
direction := nz(direction[1], direction)
direction := direction == -1 and close > shortStopPrev ? 1 : direction == 1 and close < longStopPrev ? -1 : direction
如果方向为1表示处于多头趋势,如果方向为-1表示处于空头趋势。
根据方向变量值,会绘制不同颜色的止损线:
if (direction == 1)
    valueToPlot := longStop
    colorToPlot := color.green
else
    valueToPlot := shortStop
    colorToPlot := color.red
这样就可以清楚看到目前的趋势方向和止损线位置。
追踪止损机制
该策略的关键点在于引入了追踪止损机制,可以根据价格运行情况实时调整止损线。
具体逻辑如下:
strategyPercentege = (close - updatedEntryPrice) / updatedEntryPrice * 100.00
rideUpStopLoss = hasOpenTrade() and strategyPercentege > 1

if (rideUpStopLoss)
    stopLossPercent := stopLossPercent + strategyPercentege - 1.0
    newStopLossPrice = updatedEntryPrice + (updatedEntryPrice * stopLossPercent) / 100
    stopLossPrice := max(stopLossPrice, newStopLossPrice)
    updatedEntryPrice := stopLossPrice
如果价格相对于入场价上涨超过1%,则向上追踪调整止损线。调整幅度为超过1%的部分。
这样可以锁定更多利润,同时也减少了损失。
优势分析
相比传统的移动止损策略,该策略最大的优势在于可以根据市场情况动态调整止损线。具体优势如下:
-
可以在趋势行情中实现更高的利润锁定
追踪止损机制让止损线可以不断向利润方向移动,这样就可以在行情持续走强时锁定更高的利润。
-
可以减少盘整行情的止损跳空
市场趋势变化时,固定的移动止损线很容易被跳过。而该策略的止损线是基于市场波动性计算的,可以合理跟踪价格变化,避免在盘整时被跳过止损。
-
操作简单,容易实现自动化
该策略完全基于指标运算,没有复杂的趋势判断逻辑。可以非常简单地实现自动化交易。
-
可自定义参数,适用于不同品种
ATR周期、放大系数、止损幅度等参数都可以自定义,可以针对不同品种参数优化,使策略更具备普适性。
风险分析
尽管该策略有许多优点,但仍需注意以下风险:
-
无法判断趋势转折点,存在追高杀跌风险
该策略并没有判断趋势是否结束的逻辑。在牛市末期很容易出现追高杀跌的情况。
-
参数设置不当可能扩大损失
如果ATR周期参数设置得太短,止损线就会过于灵敏,可能会被震荡行情频繁触发。
-
存在抄底反弹被止损的风险
该策略并没有考虑分型点作为止损支持位点。因此短线反弹时也可能会被抛出市场。
针对上述风险,可以从以下几个方面进行优化:
-
结合趋势滤波指标,提前判断趋势反转
-
参数优化测试,选择最优参数组合
-
在特定支持位附近加宽止损范围
优化方向
该策略还有进一步优化的空间:
-
结合K线形态判断
可以通过识别一些典型K线形态,如背驰、射击星等来判断趋势反转的可能。这可以避免追高杀跌的风险。
-
动态追踪参数优化
可以让ATR周期、放大系数等参数也动态变化,在大幅波动市场中使用更长ATR周期和更宽止损范围。
-
结合机器学习模型
通过lstm、rnn等深度学习模型预测后市可能的价格区间,动态调整止损距离。
总结
本策略overall利用ATR指标设计了移动止损线,并引入追踪止损机制,可以根据行情变化实时调整止损位移置。这实现了更高的利润锁定,同时也降低了风险。通过进一步的优化,可以使该策略更具备对市场各种情况的适应性,成为一个普适性较强的交易策略。
||
Overview
This strategy designs a moving stop loss line and reversal line based on the Average True Range (ATR) indicator. It will trail the stop loss based on price movement. Specifically, if the price movement exceeds 1%, the stop loss will move towards the profit direction at a fixed proportion. When the price breaks through the stop loss line, the position will be closed automatically. This can lock in profits and reduce losses.
Strategy Logic
The strategy uses the ATR indicator to calculate the stop loss line. The specific formulas are:
atr = multplierFactor * atr(barsBack)

longStop = hl2 - atr
shortStop = hl2 + atr
Where multplierFactor is the ATR multiplier, and barsBack is the ATR period. The larger the ATR value, the larger the market fluctuation.
The longStop and shortStop stop loss lines are calculated based on the ATR value. Trading signals are triggered when the price exceeds these two lines.
In addition, a direction variable is introduced to determine the trend direction:
direction = 1
direction := nz(direction[1], direction)
direction := direction == -1 and close > shortStopPrev ? 1 : direction == 1 and close < longStopPrev ? -1 : direction
If direction is 1, it indicates a bullish trend. If direction is -1, it indicates a bearish trend.
Based on the direction variable value, stop loss lines with different colors will be drawn:
if (direction == 1)
    valueToPlot := longStop
    colorToPlot := color.green
else
    valueToPlot := shortStop
    colorToPlot := color.red
This clearly shows the current trend direction and stop loss line position.
Trailing Stop Loss
The key point of this strategy is the introduction of a trailing stop loss mechanism that can adjust the stop loss line in real time based on price movement.
The specific logic is:
strategyPercentege = (close - updatedEntryPrice) / updatedEntryPrice * 100.00
rideUpStopLoss = hasOpenTrade() and strategyPercentege > 1

if (rideUpStopLoss)
    stopLossPercent := stopLossPercent + strategyPercentege - 1.0
    newStopLossPrice = updatedEntryPrice + (updatedEntryPrice * stopLossPercent) / 100
    stopLossPrice := max(stopLossPrice, newStopLossPrice)
    updatedEntryPrice := stopLossPrice
If the price rises more than 1% relative to the entry price, the stop loss will be trailed upwards. The adjustment range is the part exceeded 1%.
This can lock in more profits while reducing losses.
Advantage Analysis
Compared with traditional moving stop loss strategies, the biggest advantage of this strategy is that it can dynamically adjust the stop loss line according to market conditions. The specific advantages are:
-
Achieve higher profit locking in trending markets
The trailing stop loss mechanism allows the stop loss line to keep moving towards the profit direction. This locks in higher profits when the market continues to strengthen.
-
Reduce the risk of stop loss gapping in range-bound markets
When market trends change, fixed moving stop losses are prone to being skipped. While the stop loss line of this strategy is calculated based on market volatility, which can reasonably track price changes and avoid being skipped in consolidation.
-
Simple operation, easy to automate
This strategy is entirely based on indicator calculation without complex trend judgment logic. It can be easily automated.
-
Customizable parameters suitable for different products
Parameters like ATR period, multiplier factor, stop loss percentage can be customized. The strategy can be optimized for different products to make it more versatile.
Risk Analysis
Although the strategy has many advantages, the following risks should be noted:
-
Unable to determine trend reversal points, there is risk of buying high and selling low
There is no logic in this strategy to determine if the trend has ended. It is prone to buying high and selling low at the end of a bull market.
-
Improper parameter settings may amplify losses
If the ATR period parameter is set too short, the stop loss line will be too sensitive and may be frequently triggered by oscillating markets.
-
Risk of being stopped out from bottom-fishing rebounds
This strategy does not consider significant points as stop loss support. So it may also be thrown out of the market during short-term pullbacks.
To address the above risks, optimization can be done in the following aspects:
-
Incorporate trend filtering indicators to predict trend reversal in advance
-
Parameter optimization testing to select the optimal parameter combination
-
Widen the stop loss range near certain support levels
Optimization Directions
There is room for further optimization of this strategy:
-
Incorporate candlestick pattern recognition
Identify some typical candlestick patterns like divergence and shooting star to judge the possibility of trend reversal. This can avoid the risk of buying high and selling low.
-
Dynamic optimization of trailing parameters
Allow parameters like ATR period and multiplier factor to change dynamically. Use longer ATR periods and wider stop loss ranges in largely fluctuating markets.
-
Incorporate machine learning models
Use LSTM, RNN and other deep learning models to predict possible future price ranges and dynamically adjust stop loss distances.
Summary
In summary, this strategy utilizes the ATR indicator to design a moving stop loss line, and introduces a trailing stop loss mechanism that can adjust the stop loss position in real time based on market changes. This achieves higher profit locking while also reducing risks. With further optimizations, this strategy can become more adaptive to various market situations and serve as a robust trading strategy.
[/trans]
Strategy Arguments
| Argument | Default | Description |
|---|---|---|
| v_input_1 | true | ═══════════════ FROM ═══════════════ |
| v_input_2 | true | Month |
| v_input_3 | true | Day |
| v_input_4 | 2019 | Year |
| v_input_5 | true | ════════════════ TO ════════════════ |
| v_input_6 | 31 | Month |
| v_input_7 | 12 | Day |
| v_input_8 | 9999 | Year |
| v_input_9 | true | ═════════════ STRATEGY ═════════════ |
| v_input_10 | 0 | Position Type: LONG |
| v_input_11 | 3 | Initial Stop Loss |
| v_input_12 | true | ATR Period |
| v_input_13 | 3 | ATR multplierFactoriplier |
Source (PineScript)
/*backtest
start: 2022-11-21 00:00:00
end: 2023-11-27 00:00:00
period: 1d
basePeriod: 1h
exchanges: [{"eid":"Futures_Binance","currency":"BTC_USDT"}]
*/

//@version=4
//
// ▒▒▒▒▒▒▒▒▒▒▒▒▒▒▒▒▒▒▒▒▒▒▒▒▒▒▒▒▒▒▒▒▒▒▒▒▒▒▒▒▒▒▒▒▒▒▒▒▒▒▒▒▒▒▒▒▒▒▒▒▒▒▒▒▒▒▒▒▒▒▒▒▒▒▒▒▒▒▒▒▒▒▒▒▒▒▒▒▒▒▒▒▒▒▒▒▒▒▒▒▒▒▒▒▒▒▒▒▒▒▒▒▒▒
//  -----------------------------------------------------------------------------
//  Copyright 2019 Mauricio Pimenta | exit490
//  SuperTrend with Trailing Stop Loss script may be freely distributed under the MIT license.
//
//  Permission is hereby granted, free of charge,
//  to any person obtaining a copy of this software and associated documentation files (the "Software"),
//  to deal in the Software without restriction, including without limitation the rights to use, copy, modify, merge,
//  publish, distribute, sublicense, and/or sell copies of the Software, and to permit persons to whom the Software is furnished to do so,
//  subject to the following conditions:
//
//  The above copyright notice and this permission notice shall be included in all copies or substantial portions of the Software.
//
//  THE SOFTWARE IS PROVIDED "AS IS", WITHOUT WARRANTY OF ANY KIND,
//  EXPRESS OR IMPLIED, INCLUDING BUT NOT LIMITED TO THE WARRANTIES OF MERCHANTABILITY,
//  FITNESS FOR A PARTICULAR PURPOSE AND NONINFRINGEMENT. IN NO EVENT SHALL THE AUTHORS OR COPYRIGHT HOLDERS BE LIABLE FOR ANY CLAIM,
//  DAMAGES OR OTHER LIABILITY, WHETHER IN AN ACTION OF CONTRACT, TORT OR OTHERWISE, ARISING FROM,
//  OUT OF OR IN CONNECTION WITH THE SOFTWARE OR THE USE OR OTHER DEALINGS IN THE SOFTWARE.
//
//  -----------------------------------------------------------------------------
//
//  Authors:  @exit490
//  Revision: v1.0.0
//  Date:     5-Aug-2019
//
//  Description
//  ===========
//  SuperTrend is a moving stop and reversal line based on the volatility (ATR).
//  The strategy will ride up your stop loss when price moviment 1%.
//  The strategy will close your operation when the market price crossed the stop loss.
//  The strategy will close operation when the line based on the volatility will crossed
//
//  The strategy has the following parameters:
//
//  INITIAL STOP LOSS - Where can isert the value to first stop.
//  POSITION TYPE - Where can to select trade position.
//  ATR PERIOD - To select number of bars back to execute calculation
//  ATR MULTPLIER - To add a multplier factor on volatility
//  BACKTEST PERIOD - To select range.
//
//  -----------------------------------------------------------------------------
//  Disclaimer:
//    1. I am not licensed financial advisors or broker dealers. I do not tell you
//       when or what to buy or sell. I developed this software which enables you
//       execute manual or automated trades multplierFactoriplierFactoriple trades using TradingView. The
//       software allows you to set the criteria you want for entering and exiting
//       trades.
//    2. Do not trade with money you cannot afford to lose.
//    3. I do not guarantee consistent profits or that anyone can make money with no
//       effort. And I am not selling the holy grail.
//    4. Every system can have winning and losing streaks.
//    5. Money management plays a large role in the results of your trading. For
//       example: lot size, account size, broker leverage, and broker margin call
//       rules all have an effect on results. Also, your Take Profit and Stop Loss
//       settings for individual pair trades and for overall account equity have a
//       major impact on results. If you are new to trading and do not understand
//       these items, then I recommend you seek education materials to further your
//       knowledge.
//
//    YOU NEED TO FIND AND USE THE TRADING SYSTEM THAT WORKS BEST FOR YOU AND YOUR
//    TRADING TOLERANCE.
//
//    I HAVE PROVIDED NOTHING MORE THAN A TOOL WITH OPTIONS FOR YOU TO TRADE WITH THIS PROGRAM ON TRADINGVIEW.
//
//    I accept suggestions to improve the script.
//    If you encounter any problems I will be happy to share with me.
//  -----------------------------------------------------------------------------
//
// ▒▒▒▒▒▒▒▒▒▒▒▒▒▒▒▒▒▒▒▒▒▒▒▒▒▒▒▒▒▒▒▒▒▒▒▒▒▒▒▒▒▒▒▒▒▒▒▒▒▒▒▒▒▒▒▒▒▒▒▒▒▒▒▒▒▒▒▒▒▒▒▒▒▒▒▒▒▒▒▒▒▒▒▒▒▒▒▒▒▒▒▒▒▒▒▒▒▒▒▒▒▒▒▒▒▒▒▒▒▒▒▒▒▒ //

strategy(title = "SUPERTREND ATR WITH TRAILING STOP LOSS",
         shorttitle = "SUPERTREND ATR WITH TSL",
         overlay = true,
         precision = 8,
         calc_on_order_fills = true,
         calc_on_every_tick = true,
         backtest_fill_limits_assumption = 0,
         default_qty_type = strategy.percent_of_equity,
         default_qty_value = 100,
         initial_capital = 1000,
         currency = currency.USD,
         linktoseries = true)

//
// ▒▒▒▒▒▒▒▒▒▒▒▒▒▒▒▒▒▒▒▒▒▒▒▒▒▒▒▒▒▒▒▒▒▒▒▒▒▒▒▒▒▒▒▒▒▒▒▒▒▒▒▒▒▒▒▒▒▒▒▒▒▒▒▒▒▒▒▒▒▒▒▒▒▒▒▒▒▒▒▒▒▒▒▒▒▒▒▒▒▒▒▒▒▒▒▒▒▒▒▒▒▒▒▒▒▒▒▒▒▒▒▒▒▒ //

// === BACKTEST RANGE ===
backTestSectionFrom = input(title = "═══════════════ FROM ═══════════════", defval = true, type = input.bool)

FromMonth       = input(defval = 1, title = "Month", minval = 1)
FromDay         = input(defval = 1, title = "Day", minval = 1)
FromYear        = input(defval = 2019, title = "Year", minval = 2014)

backTestSectionTo = input(title = "════════════════ TO ════════════════", defval = true, type = input.bool)
ToMonth         = input(defval = 31, title = "Month", minval = 1)
ToDay           = input(defval = 12, title = "Day", minval = 1)
ToYear          = input(defval = 9999, title = "Year", minval = 2014)

backTestPeriod() => (time > timestamp(FromYear, FromMonth, FromDay, 00, 00)) and (time < timestamp(ToYear, ToMonth, ToDay, 23, 59))

//
// ▒▒▒▒▒▒▒▒▒▒▒▒▒▒▒▒▒▒▒▒▒▒▒▒▒▒▒▒▒▒▒▒▒▒▒▒▒▒▒▒▒▒▒▒▒▒▒▒▒▒▒▒▒▒▒▒▒▒▒▒▒▒▒▒▒▒▒▒▒▒▒▒▒▒▒▒▒▒▒▒▒▒▒▒▒▒▒▒▒▒▒▒▒▒▒▒▒▒▒▒▒▒▒▒▒▒▒▒▒▒▒▒▒▒ //

parameterSection = input(title = "═════════════ STRATEGY ═════════════", defval = true, type = input.bool)
// === INPUT TO SELECT POSITION ===
positionType = input(defval="LONG", title="Position Type", options=["LONG", "SHORT"])

// === INPUT TO SELECT INITIAL STOP LOSS
initialStopLossPercent = input(defval = 3.0, minval = 0.0, title="Initial Stop Loss")

// === INPUT TO SELECT BARS BACK
barsBack = input(title="ATR Period", defval=1)

// === INPUT TO SELECT MULTPLIER FACTOR
multplierFactor = input(title="ATR multplierFactoriplier", step=0.1, defval=3.0)

//
// ▒▒▒▒▒▒▒▒▒▒▒▒▒▒▒▒▒▒▒▒▒▒▒▒▒▒▒▒▒▒▒▒▒▒▒▒▒▒▒▒▒▒▒▒▒▒▒▒▒▒▒▒▒▒▒▒▒▒▒▒▒▒▒▒▒▒▒▒▒▒▒▒▒▒▒▒▒▒▒▒▒▒▒▒▒▒▒▒▒▒▒▒▒▒▒▒▒▒▒▒▒▒▒▒▒▒▒▒▒▒▒▒▒▒ //

// LOGIC TO FIND DIRECTION WHEN THERE IS TREND CHANGE ACCORDING VOLATILITY
atr = multplierFactor * atr(barsBack)

longStop = hl2 - atr
longStopPrev = nz(longStop[1], longStop)
longStop := close[1] > longStopPrev ? max(longStop, longStopPrev) : longStop

shortStop = hl2 + atr
shortStopPrev = nz(shortStop[1], shortStop)
shortStop := close[1] < shortStopPrev ? min(shortStop, shortStopPrev) : shortStop

direction = 1
direction := nz(direction[1], direction)
direction := direction == -1 and close > shortStopPrev ? 1 : direction == 1 and close < longStopPrev ? -1 : direction

longColor = color.blue
shortColor = color.blue

var valueToPlot = 0.0
var colorToPlot = color.white

if (direction == 1)
    valueToPlot := longStop
    colorToPlot := color.green
else
    valueToPlot := shortStop
    colorToPlot := color.red

//
// ▒▒▒▒▒▒▒▒▒▒▒▒▒▒▒▒▒▒▒▒▒▒▒▒▒▒▒▒▒▒▒▒▒▒▒▒▒▒▒▒▒▒▒▒▒▒▒▒▒▒▒▒▒▒▒▒▒▒▒▒▒▒▒▒▒▒▒▒▒▒▒▒▒▒▒▒▒▒▒▒▒▒▒▒▒▒▒▒▒▒▒▒▒▒▒▒▒▒▒▒▒▒▒▒▒▒▒▒▒▒▒▒▒▒ //
//
// === GLOBAL VARIABLES AND FUNCTIONS TO STORE IMPORTANT CONDITIONALS TO TRAILING STOP
hasEntryLongConditional() => direction == 1
hasCloseLongConditional() => direction == -1

hasEntryShortConditional() => direction == -1
hasCloseShortConditional() => direction == 1

stopLossPercent = positionType == "LONG" ? initialStopLossPercent * -1 : initialStopLossPercent

var entryPrice = 0.0
var updatedEntryPrice = 0.0
var stopLossPrice = 0.0

hasOpenTrade() => strategy.opentrades != 0
notHasOpenTrade() => strategy.opentrades == 0

strategyClose() =>
    if positionType == "LONG"
        strategy.close("LONG", when=true)
    else
        strategy.close("SHORT", when=true)

strategyOpen() =>
    if positionType == "LONG"
        strategy.entry("LONG", strategy.long, when=true)
    else
        strategy.entry("SHORT", strategy.short, when=true)

isLong() => positionType == "LONG" ? true : false
isShort() => positionType == "SHORT" ? true : false


//
// ▒▒▒▒▒▒▒▒▒▒▒▒▒▒▒▒▒▒▒▒▒▒▒▒▒▒▒▒▒▒▒▒▒▒▒▒▒▒▒▒▒▒▒▒▒▒▒▒▒▒▒▒▒▒▒▒▒▒▒▒▒▒▒▒▒▒▒▒▒▒▒▒▒▒▒▒▒▒▒▒▒▒▒▒▒▒▒▒▒▒▒▒▒▒▒▒▒▒▒▒▒▒▒▒▒▒▒▒▒▒▒▒▒▒ //
//
// === LOGIC TO TRAILING STOP IN LONG POSITION

if (isLong() and backTestPeriod())

    crossedStopLoss = close <= stopLossPrice
    terminateOperation = hasOpenTrade() and (crossedStopLoss or hasCloseLongConditional())

    if (terminateOperation)
        entryPrice := 0.0
        updatedEntryPrice := entryPrice
        stopLossPrice := 0.0
        strategyClose()

    startOperation = notHasOpenTrade() and hasEntryLongConditional()

    if(startOperation)
        entryPrice := close
        updatedEntryPrice := entryPrice
        stopLossPrice := entryPrice + (entryPrice * stopLossPercent) / 100
        strategyOpen()

    strategyPercentege = (close - updatedEntryPrice) / updatedEntryPrice * 100.00
    rideUpStopLoss = hasOpenTrade() and strategyPercentege > 1

    if (isLong() and rideUpStopLoss)
        stopLossPercent := stopLossPercent + strategyPercentege - 1.0
        newStopLossPrice = updatedEntryPrice + (updatedEntryPrice * stopLossPercent) / 100
        stopLossPrice := max(stopLossPrice, newStopLossPrice)
        updatedEntryPrice := stopLossPrice

//
// ▒▒▒▒▒▒▒▒▒▒▒▒▒▒▒▒▒▒▒▒▒▒▒▒▒▒▒▒▒▒▒▒▒▒▒▒▒▒▒▒▒▒▒▒▒▒▒▒▒▒▒▒▒▒▒▒▒▒▒▒▒▒▒▒▒▒▒▒▒▒▒▒▒▒▒▒▒▒▒▒▒▒▒▒▒▒▒▒▒▒▒▒▒▒▒▒▒▒▒▒▒▒▒▒▒▒▒▒▒▒▒▒▒▒ //
//
// === LOGIC TO TRAILING STOP IN SHORT POSITION

if (isShort() and backTestPeriod())

    crossedStopLoss = close >= stopLossPrice
    terminateOperation = hasOpenTrade() and (crossedStopLoss or hasCloseShortConditional())

    if (terminateOperation)
        entryPrice := 0.0
        updatedEntryPrice := entryPrice
        stopLossPrice := 0.0
        strategyClose()

    startOperation = notHasOpenTrade() and hasEntryShortConditional()

    if(startOperation)
        entryPrice := close
        updatedEntryPrice := entryPrice
        stopLossPrice := entryPrice + (entryPrice * stopLossPercent) / 100
        strategyOpen()

    strategyPercentege = (close - updatedEntryPrice) / updatedEntryPrice * 100.00
    rideDownStopLoss = hasOpenTrade() and strategyPercentege < -1

    if (rideDownStopLoss)
        stopLossPercent := stopLossPercent + strategyPercentege + 1.0
        newStopLossPrice = updatedEntryPrice + (updatedEntryPrice * stopLossPercent) / 100
        stopLossPrice := min(stopLossPrice, newStopLossPrice)
        updatedEntryPrice := stopLossPrice

//
// ▒▒▒▒▒▒▒▒▒▒▒▒▒▒▒▒▒▒▒▒▒▒▒▒▒▒▒▒▒▒▒▒▒▒▒▒▒▒▒▒▒▒▒▒▒▒▒▒▒▒▒▒▒▒▒▒▒▒▒▒▒▒▒▒▒▒▒▒▒▒▒▒▒▒▒▒▒▒▒▒▒▒▒▒▒▒▒▒▒▒▒▒▒▒▒▒▒▒▒▒▒▒▒▒▒▒▒▒▒▒▒▒▒▒
//
// === DRAWING SHAPES

entryPricePlotConditinal = entryPrice == 0.0 ? na : entryPrice
trailingStopLossPlotConditional = stopLossPrice == 0.0  ? na : stopLossPrice

plotshape(entryPricePlotConditinal, title= "Entry Price", color=color.blue, style=shape.circle, location=location.absolute, size=size.tiny)
plotshape(trailingStopLossPlotConditional, title= "Stop Loss", color=color.red, style=shape.circle, location=location.absolute, size=size.tiny)

plot(valueToPlot == 0.0 ? na : valueToPlot, title="BuyLine", linewidth=2, color=colorToPlot)
plotshape(direction == 1 and direction[1] == -1 ? longStop : na, title="Buy", style=shape.labelup, location=location.absolute, size=size.normal, text="Buy", transp=0, textcolor = color.white, color=color.green, transp=0)
plotshape(direction == -1 and direction[1] == 1 ? shortStop : na, title="Sell", style=shape.labeldown, location=location.absolute, size=size.normal, text="Sell", transp=0, textcolor = color.white, color=color.red, transp=0)

alertcondition(direction == 1 and direction[1] == -1 ? longStop : na, title="Buy", message="Buy!")
alertcondition(direction == -1 and direction[1] == 1 ? shortStop : na, title="Sell", message="Sell!")
Detail
https://www.fmz.com/strategy/433556
Last Modified
2023-11-28 14:56:59