
6.7 KiB
Name
基于风险回报比和技术分析的牛旗突破策略-Risk-Reward-Ratio-and-Technical-Analysis-Based-Bull-Flag-Breakout-Strategy
Author
ChaoZhang
Strategy Description
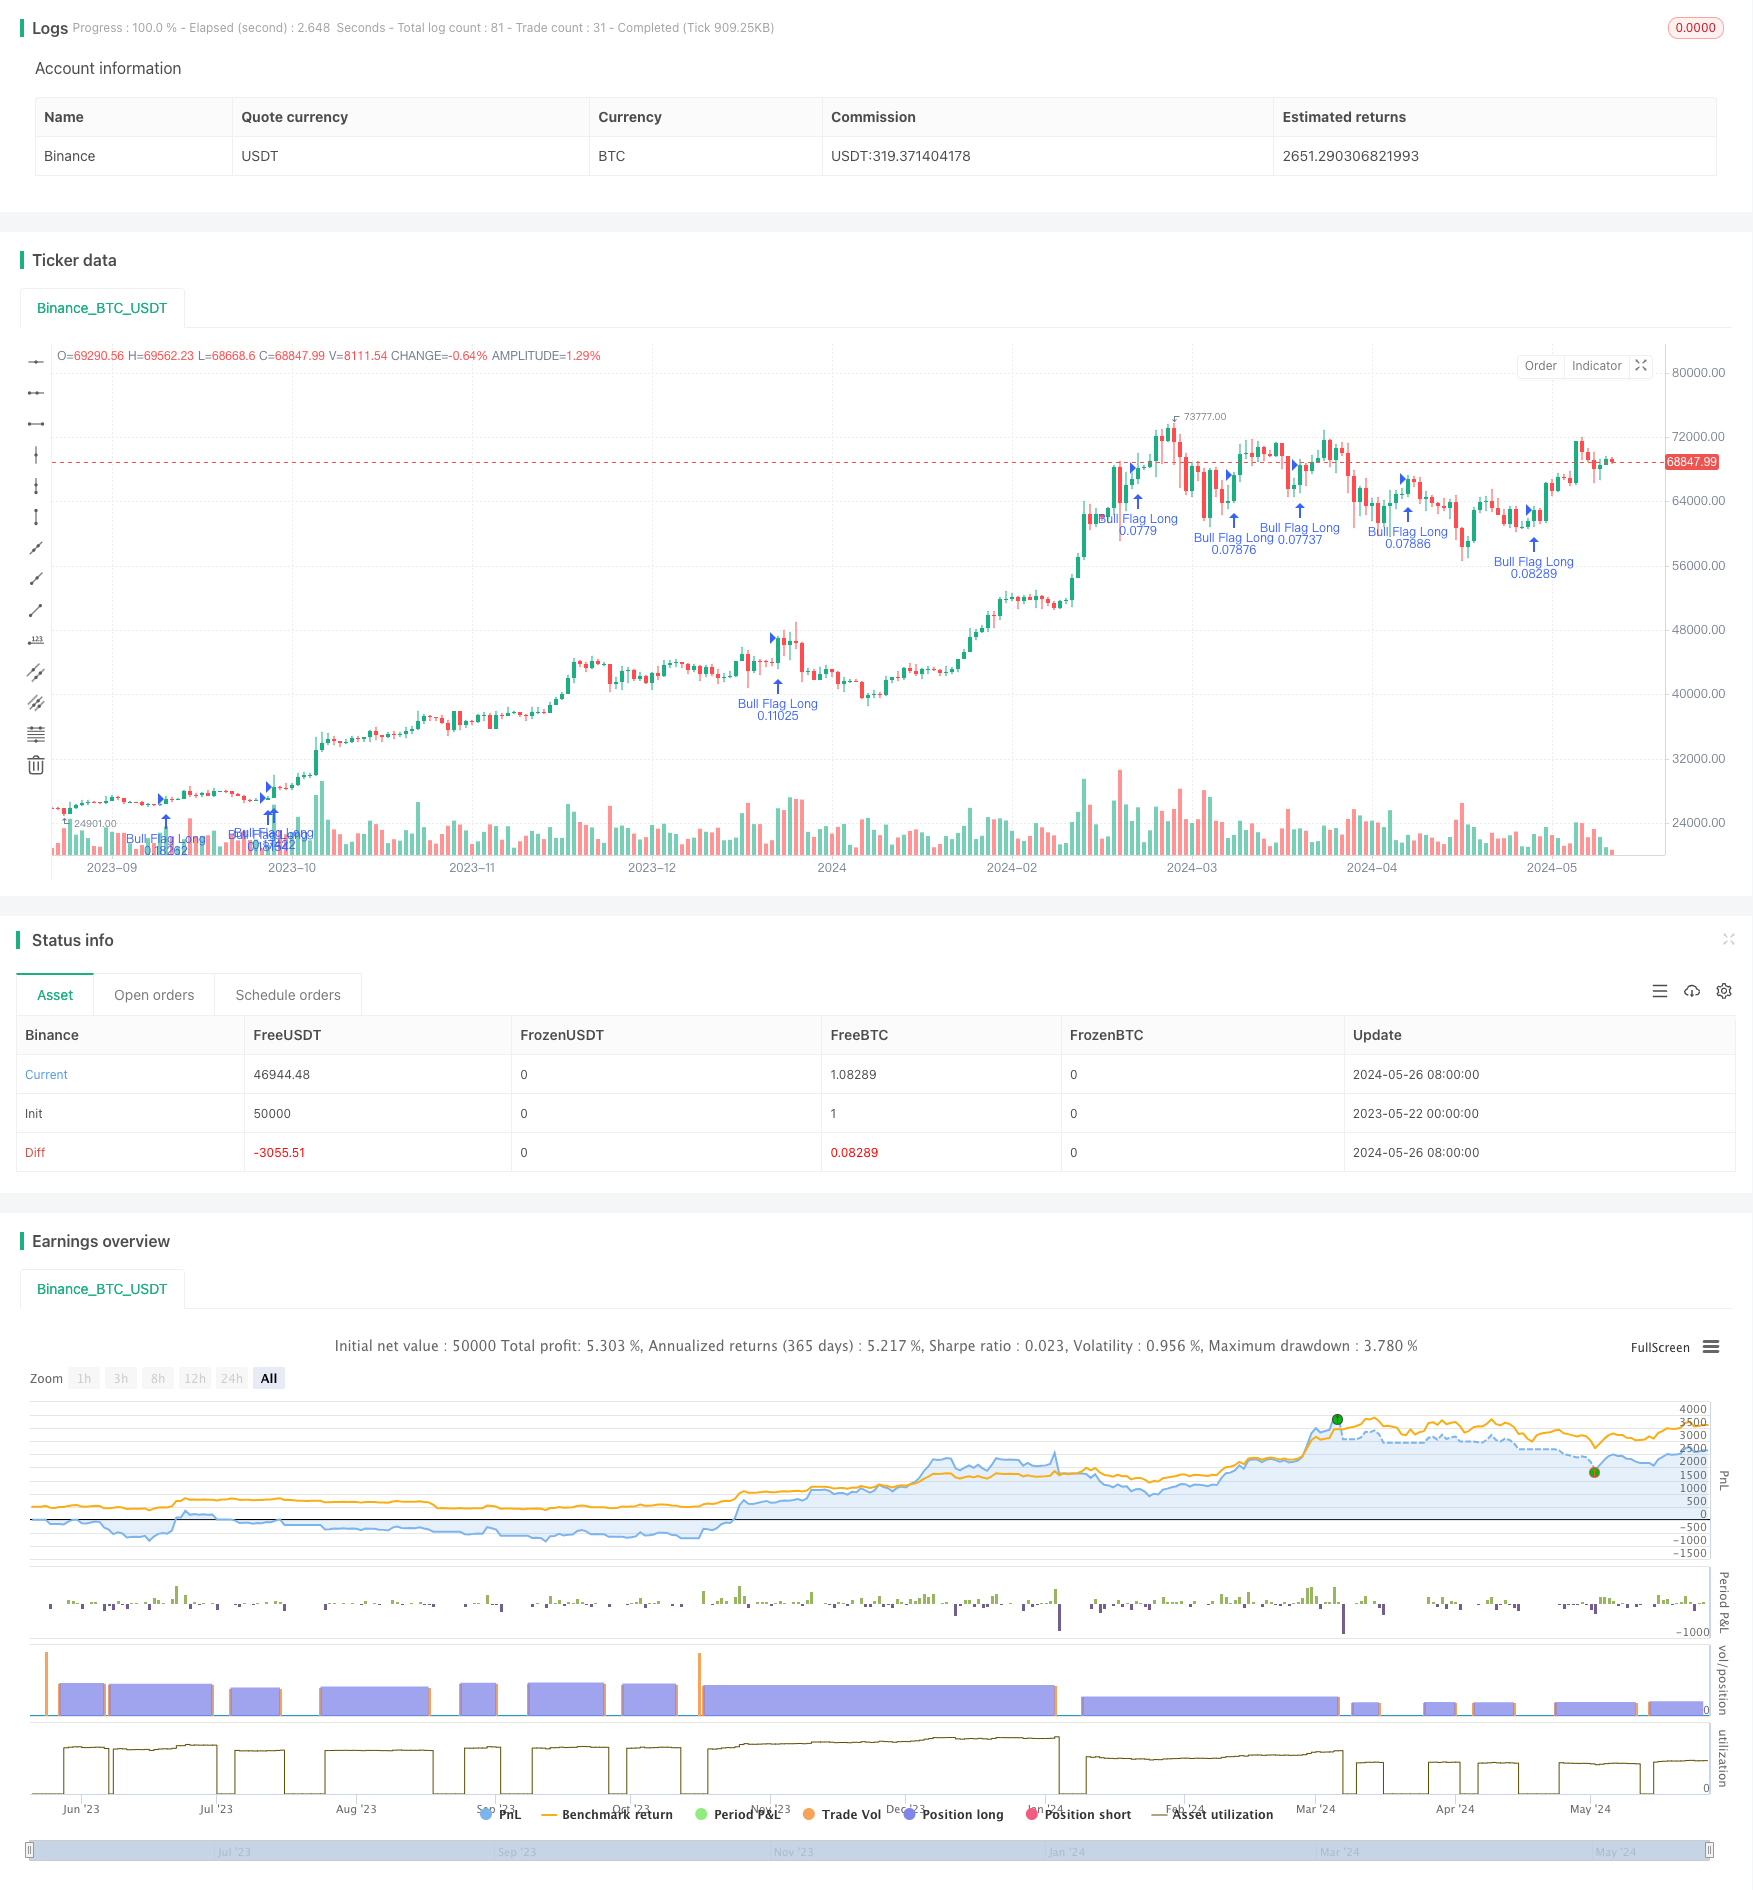
[trans]
概述
该策略基于牛旗形态,在价格突破旗形区间高点后买入,止损位置设在旗形区间低点,目标利润根据风险回报比设置。策略利用最高价和最低价函数识别旗形区间,并通过比较当前收盘价和前一根K线最高价来判断突破。
策略原理
- 识别牛旗形态:用最高价和最低价函数计算旗形区间的高点和低点,并判断当前价格是否突破旗形高点。
- 进场:如果当前收盘价突破前一根K线的最高价,且前一根K线的最高价低于旗形高点,则买入。
- 止损:止损价格设置为旗形低点减去一个缓冲值。
- 止盈:根据风险回报比计算目标价格。目标价格 = 进场价格 + (进场价格 - 止损价格) * 风险回报比
策略优势
- 基于经典的牛旗形态,能捕捉到强势趋势中的回调机会。
- 止损位置设在旗形低点,风险可控。
- 利用风险回报比设置目标价格,博取更高收益。
- 代码逻辑清晰,使用TradingView内置函数,易于理解和修改。
策略风险
- 在震荡市场或趋势不明朗时,旗形突破后价格可能快速反转,带来较大回撤。
- 缓冲值设置不当可能导致过早止损。
- 实际风险回报比可能达不到设定值。
- 对于一些变形的旗形图案,策略可能失效。
策略优化方向
- 可以考虑加入更多条件过滤信号,如交易量变化、均线方向等,提高信号质量。
- 针对不同市场特点,可以对参数进行优化,如旗形区间长度、风险回报比、止损缓冲值等。
- 可以考虑分批建仓和动态止损,降低风险暴露。
- 加入仓位管理,控制总体风险。
总结
该策略是一个基于经典牛旗形态的突破策略,通过识别旗形区间和价格突破来捕捉趋势延续机会。策略优点是逻辑清晰,风险可控,但在震荡市或趋势反转时面临一定风险。后续可以从优化信号、动态参数、仓位管理等方面改进,提高策略稳健性和收益性。
||
Overview
This strategy is based on the bull flag pattern. It buys when the price breaks out above the high of the flag range, sets the stop loss at the low of the flag range, and sets the profit target according to the risk-reward ratio. The strategy uses the highest and lowest price functions to identify the flag range and determines the breakout by comparing the current closing price with the highest price of the previous candle.
Strategy Principle
- Identify the bull flag pattern: Calculate the high and low of the flag range using the highest and lowest price functions, and determine whether the current price breaks out above the flag high.
- Entry: If the current closing price breaks out above the highest price of the previous candle, and the highest price of the previous candle is lower than the flag high, then buy.
- Stop Loss: The stop loss price is set to the flag low minus a buffer value.
- Take Profit: Calculate the target price based on the risk-reward ratio. Target price = Entry price + (Entry price - Stop loss price) * Risk-reward ratio
Strategy Advantages
- Based on the classic bull flag pattern, it can capture pullback opportunities in strong trends.
- The stop loss is set at the flag low, making the risk controllable.
- Utilize the risk-reward ratio to set the target price and seek higher returns.
- The code logic is clear and uses built-in functions of TradingView, making it easy to understand and modify.
Strategy Risks
- In a volatile market or when the trend is unclear, prices may quickly reverse after breaking out of the flag, leading to significant drawdowns.
- Improper setting of the buffer value may lead to premature stop losses.
- The actual risk-reward ratio may not reach the set value.
- The strategy may fail for some deformed flag patterns.
Strategy Optimization Directions
- Consider adding more conditions to filter signals, such as changes in trading volume, moving average direction, etc., to improve signal quality.
- Optimize parameters according to different market characteristics, such as flag range length, risk-reward ratio, stop loss buffer value, etc.
- Consider building positions in batches and using dynamic stop losses to reduce risk exposure.
- Add position management to control overall risk.
Summary
This strategy is a breakout strategy based on the classic bull flag pattern, which captures trend continuation opportunities by identifying the flag range and price breakouts. The strategy's advantages are clear logic and controllable risk, but it faces certain risks in volatile markets or trend reversals. Improvements can be made in terms of optimizing signals, dynamic parameters, position management, etc., to enhance the strategy's robustness and profitability. [/trans]
Source (PineScript)
/*backtest
start: 2023-05-22 00:00:00
end: 2024-05-27 00:00:00
period: 1d
basePeriod: 1h
exchanges: [{"eid":"Binance","currency":"BTC_USDT"}]
*/

//@version=5
strategy("Bull Flag Breakout", overlay=true, default_qty_type=strategy.percent_of_equity, default_qty_value=10)

// Параметры стратегии
riskRewardRatio = 3.0
flagLength = input.int(5, title="Flag Length")
stopLossBuffer = input.float(0.01, title="Stop Loss Buffer", step=0.001)

// Функция для вычисления стоп-лосса и тейк-профита
calcRiskRewardPrice(entryPrice, stopLossPrice, riskRewardRatio) =>
    takeProfitPrice = entryPrice + (entryPrice - stopLossPrice) * riskRewardRatio
    [stopLossPrice, takeProfitPrice]

// Найти минимум и максимум флага
flagLow = ta.lowest(low, flagLength)
flagHigh = ta.highest(high, flagLength)

// Условия для формирования бычьего флага
isBullFlag = high[1] < flagHigh and close > high[1]

// Условия для входа в сделку
if (isBullFlag)
    entryPrice = close
    stopLossPrice = flagLow - stopLossBuffer
    [calculatedStopLoss, calculatedTakeProfit] = calcRiskRewardPrice(entryPrice, stopLossPrice, riskRewardRatio)

    // Открыть длинную позицию
    strategy.entry("Bull Flag Long", strategy.long)
    strategy.exit("Take Profit", "Bull Flag Long", limit=calculatedTakeProfit)
    strategy.exit("Stop Loss", "Bull Flag Long", stop=calculatedStopLoss)
    label.new(bar_index, high, "Buy", color=color.green, textcolor=color.white, style=label.style_label_down)
Detail
https://www.fmz.com/strategy/452685
Last Modified
2024-05-28 10:47:51