
8.4 KiB
Name
基于随机振荡指标的波动区间交易策略-Volatility-Range-Trading-Strategy-Based-on-Stochastic-Oscillator
Author
ChaoZhang
Strategy Description
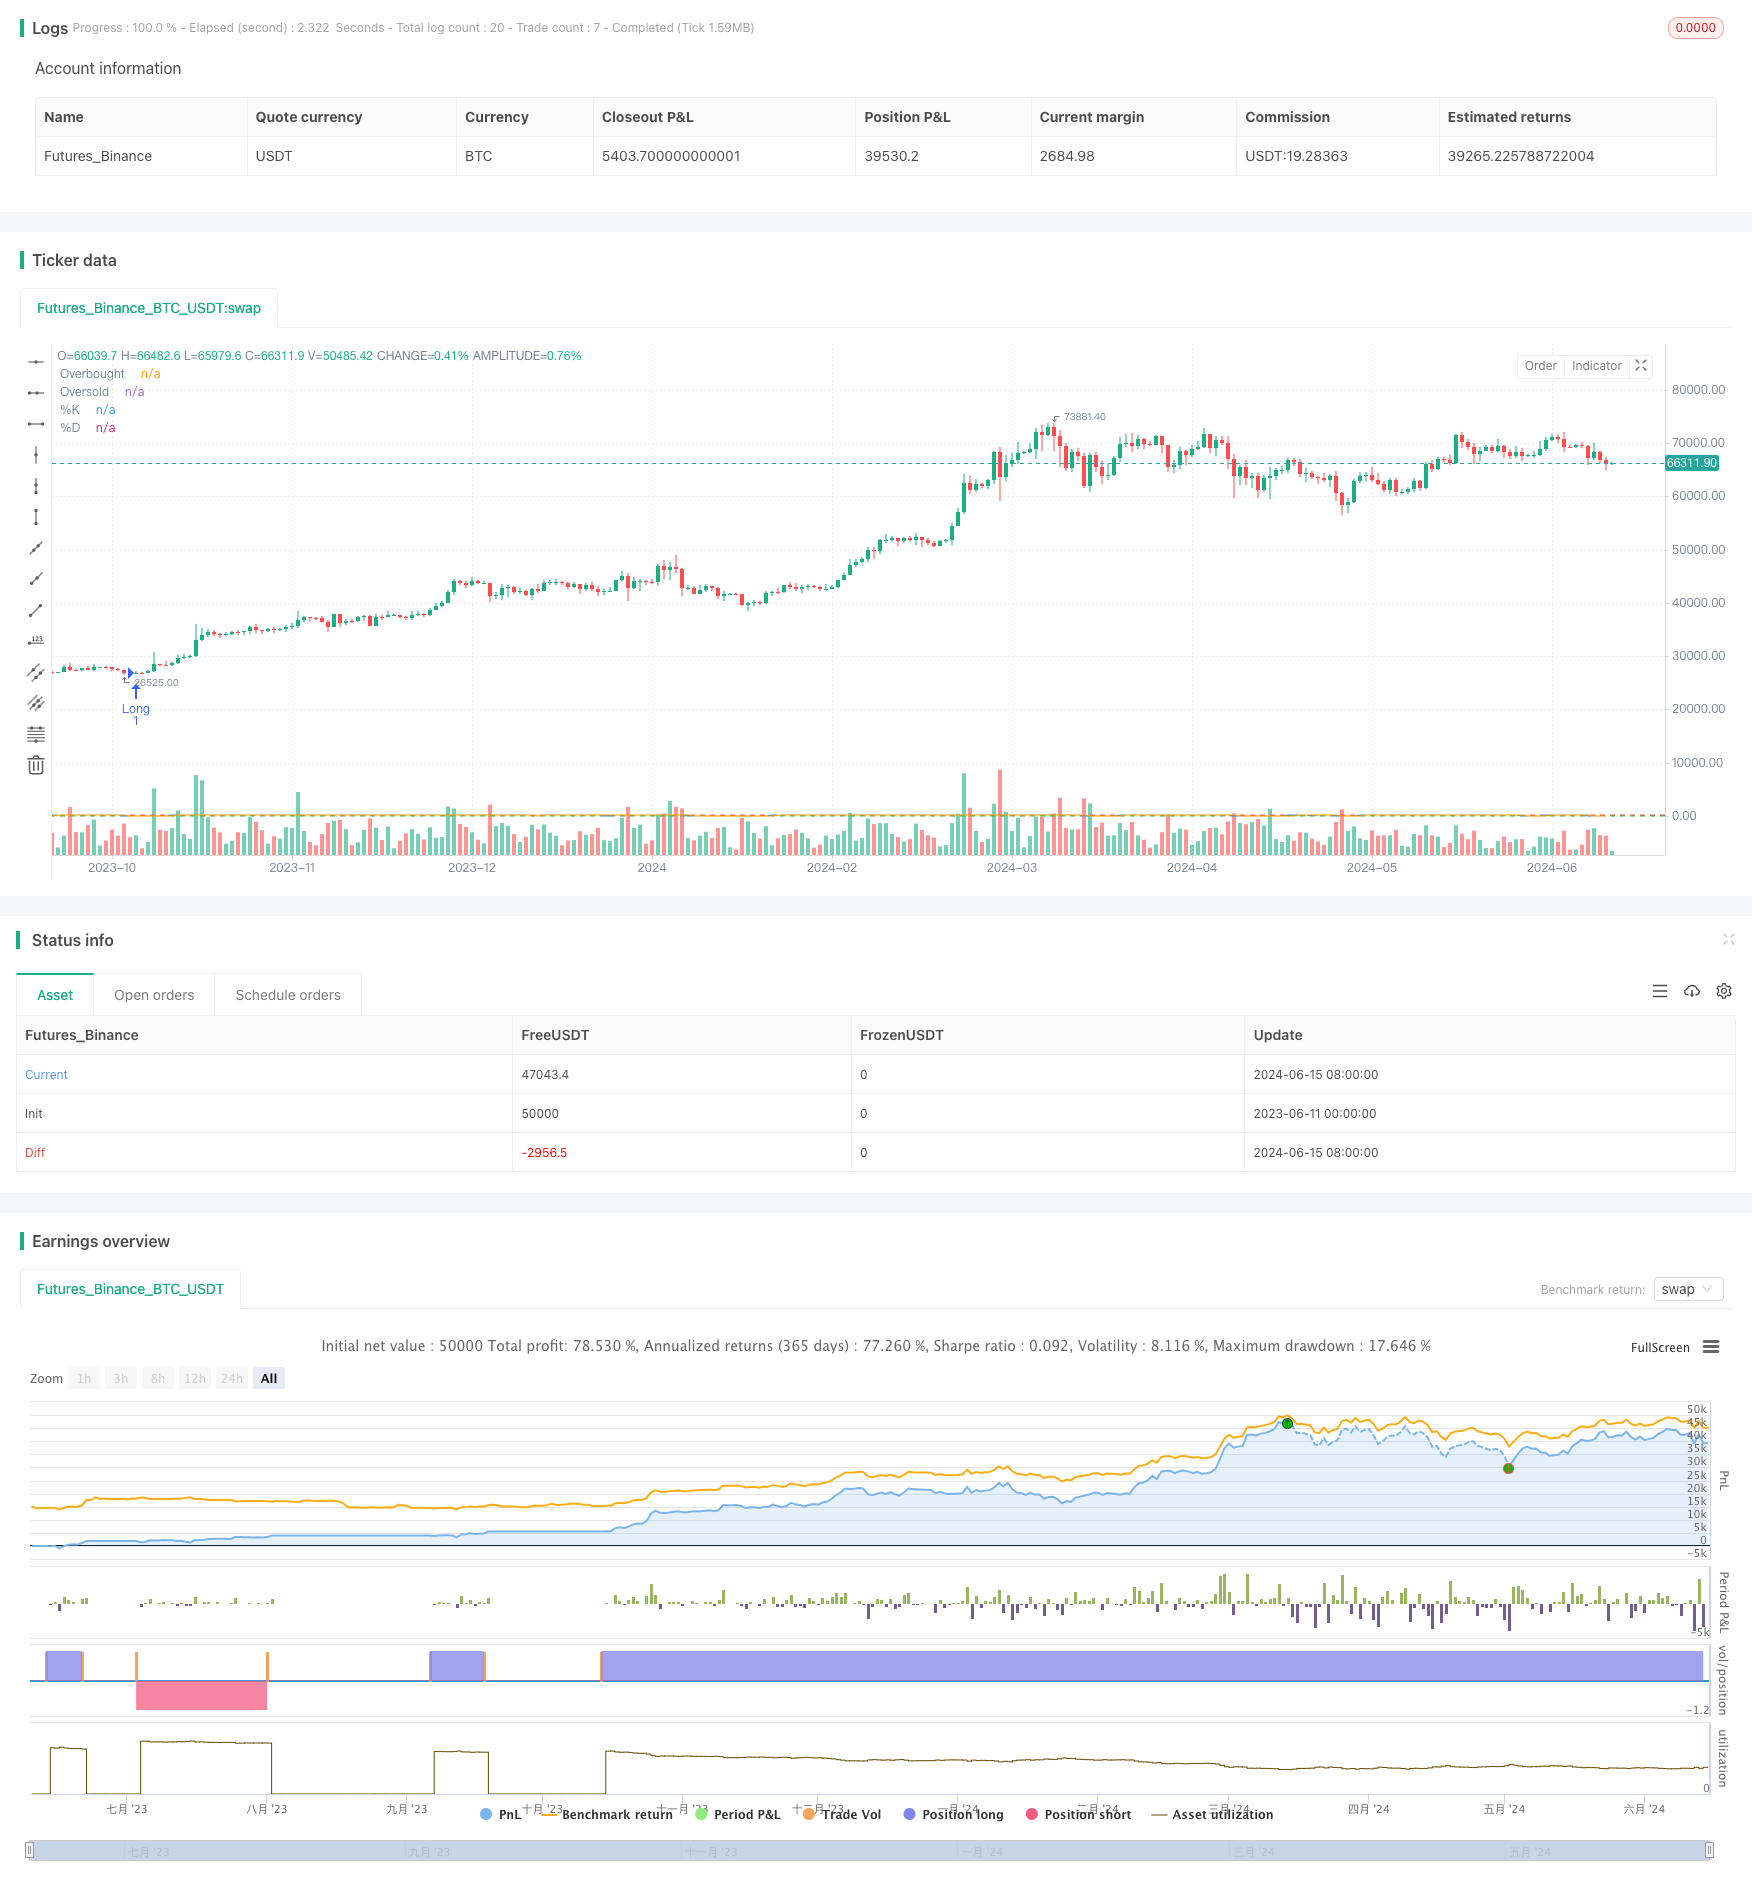
[trans]
概述
该策略利用随机振荡指标(Stochastic Oscillator)来识别市场的超买和超卖状态,在预定义的风险和回报参数下触发交易,以期在波动的交易区间内获利。该策略的主要思路是在交易区间的低点买入,在交易区间的高点卖出,同时严格控制风险。
策略原理
- 当随机振荡指标跌破超卖水平(20)时,策略开仓做多;当随机振荡指标突破超买水平(80)时,策略开仓做空。
- 止损和止盈水平根据平均真实波幅(ATR)的2倍来设置,同时每笔交易的风险控制在账户权益的1%。
- 为了防止过度交易,策略强制每笔交易之间至少间隔20根K线,以留出冷却期并避免波动。
策略优势
- 该策略能够在波动的交易区间内捕捉价格波动,在低点买入,在高点卖出,以期获得利润。
- 策略采用严格的风险管理措施,包括基于ATR的止损和止盈以及每笔交易1%的固定风险,有助于控制回撤和单笔交易损失。
- 通过在交易之间设置最小间隔(20根K线),策略避免了频繁交易和被市场噪音所欺骗。
- 该策略逻辑清晰,易于理解和实施,适合在各种市场环境下应用。
策略风险
- 策略的成功很大程度上取决于正确识别交易区间,如果交易区间识别不准确,可能导致亏损交易。
- 如果市场突破交易区间并形成趋势,该策略可能错失趋势交易机会。
- 尽管策略采取了风险管理措施,但在极端市场条件下,仍可能发生超出预期的损失。
- 策略参数(如超买/超卖水平、ATR倍数等)需要根据不同的市场条件进行优化,不恰当的参数可能导致表现不佳。
策略优化方向
- 考虑结合其他技术指标(如MACD、RSI等)来确认交易信号,提高信号可靠性。
- 引入动态止损和止盈机制,例如随着价格向有利方向移动而调整止损位,以期获得更高的收益率。
- 对于交易区间的识别,可以探索使用更先进的技术,如机器学习算法,以提高准确性。
- 在趋势市场中,可以考虑引入趋势过滤器,以避免在趋势市场中交易。
总结
基于随机振荡指标的波动区间交易策略试图在预先确定的交易区间内,利用随机指标的超买和超卖信号来触发交易。该策略通过严格的风险管理和交易间隔来控制风险。尽管该策略有一定的优势,但其成功很大程度上取决于正确识别交易区间。未来的优化方向包括结合其他技术指标、引入动态止损止盈、使用更先进的区间识别技术以及添加趋势过滤器。在实际应用中,务必根据个人偏好和风险承受能力来调整策略参数和风险管理规则。
||
Overview
This strategy utilizes the Stochastic Oscillator to identify overbought and oversold market conditions, triggering trades with predefined risk and reward parameters to capitalize on price fluctuations within a volatile trading range. The main idea behind this strategy is to buy at the low end of the trading range and sell at the high end, while strictly controlling risk.
Strategy Logic
- When the Stochastic Oscillator crosses below the oversold level (20), the strategy enters a long position; when it crosses above the overbought level (80), the strategy enters a short position.
- Stop-loss and take-profit levels are set based on 2x the Average True Range (ATR), and each trade risks 1% of the account equity.
- To prevent overtrading, the strategy enforces a minimum of 20 bars between each trade, allowing for a cool-down period and avoiding whipsaws.
Strategy Advantages
- The strategy can capture price fluctuations within a volatile trading range, buying at the low points and selling at the high points to potentially profit.
- It employs strict risk management measures, including ATR-based stop-loss and take-profit levels and a fixed 1% risk per trade, which helps control drawdowns and single-trade losses.
- By setting a minimum interval between trades (20 bars), the strategy avoids frequent trading and being fooled by market noise.
- The strategy logic is clear, easy to understand, and implement, making it suitable for application in various market environments.
Strategy Risks
- The success of the strategy largely depends on correctly identifying the trading range; if the range is misidentified, it may lead to losing trades.
- If the market breaks out of the trading range and forms a trend, the strategy may miss out on trend-following opportunities.
- Despite the risk management measures in place, the strategy may still experience losses exceeding expectations under extreme market conditions.
- The strategy parameters (e.g., overbought/oversold levels, ATR multiple) need to be optimized for different market conditions; inappropriate parameters may lead to poor performance.
Strategy Optimization Directions
- Consider combining other technical indicators (e.g., MACD, RSI) to confirm trading signals and improve signal reliability.
- Introduce dynamic stop-loss and take-profit mechanisms, such as adjusting the stop-loss level as the price moves in a favorable direction, to potentially achieve higher returns.
- For trading range identification, explore using more advanced techniques, such as machine learning algorithms, to improve accuracy.
- In trending markets, consider introducing a trend filter to avoid trading against the trend.
Summary
The volatility range trading strategy based on the Stochastic Oscillator attempts to capitalize on the oscillator's overbought and oversold signals within a predefined trading range. The strategy controls risk through strict risk management and trade intervals. While the strategy has certain advantages, its success largely depends on correctly identifying the trading range. Future optimization directions include combining other technical indicators, introducing dynamic stop-loss and take-profit levels, using more advanced range identification techniques, and adding a trend filter. When applying the strategy in practice, be sure to adjust the parameters and risk management rules according to personal preferences and risk tolerance. [/trans]
Source (PineScript)
/*backtest
start: 2023-06-11 00:00:00
end: 2024-06-16 00:00:00
period: 1d
basePeriod: 1h
exchanges: [{"eid":"Futures_Binance","currency":"BTC_USDT"}]
*/

//@version=5
strategy("Range Trading with Stochastic", overlay=true)

// Input Parameters
overboughtLevel = input.int(80, title="Overbought Level", minval=1, maxval=100)
oversoldLevel = input.int(20, title="Oversold Level", minval=1, maxval=100)
stochLength = input.int(14, title="Stochastic Length", minval=1)
riskPerTrade = input.float(0.01, title="Risk per Trade (%)", minval=0.01, maxval=100, step=0.01)
barsBetweenTrades = input.int(20, title="Bars Between Trades", minval=1)

// Calculate Stochastic Oscillator
k = ta.sma(ta.stoch(close, high, low, stochLength), 3)
d = ta.sma(k, 3)

// Variables to Track Time Since Last Trade
var lastTradeBar = 0
barsSinceLastTrade = bar_index - lastTradeBar

// Risk Management
atr = ta.atr(14)
stopLoss = 2 * atr
takeProfit = 2 * atr
riskAmount = strategy.equity * riskPerTrade / 100
positionSize = 1

// Entry Conditions
longCondition = k < oversoldLevel and strategy.position_size == 0 and barsSinceLastTrade >= barsBetweenTrades
shortCondition = k > overboughtLevel and strategy.position_size == 0 and barsSinceLastTrade >= barsBetweenTrades

// Entry/Exit Orders
if longCondition
    strategy.entry("Long", strategy.long, qty=positionSize)
    strategy.exit("Long Exit", "Long", stop=close - stopLoss, limit=close + takeProfit)
    lastTradeBar := bar_index // Update last trade bar
if shortCondition
    strategy.entry("Short", strategy.short, qty=positionSize)
    strategy.exit("Short Exit", "Short", stop=close + stopLoss, limit=close - takeProfit)
    lastTradeBar := bar_index // Update last trade bar

// Plot Stochastic
plot(k, color=color.blue, title="%K")
plot(d, color=color.orange, title="%D")
hline(overboughtLevel, color=color.red, title="Overbought")
hline(oversoldLevel, color=color.green, title="Oversold")
Detail
https://www.fmz.com/strategy/454334
Last Modified
2024-06-17 14:52:10