
9.8 KiB
Name
基于随机力矩指标的量化交易策略Quantitative-Trading-Strategy-Based-on-Stochastics-Momentum-Index
Author
ChaoZhang
Strategy Description
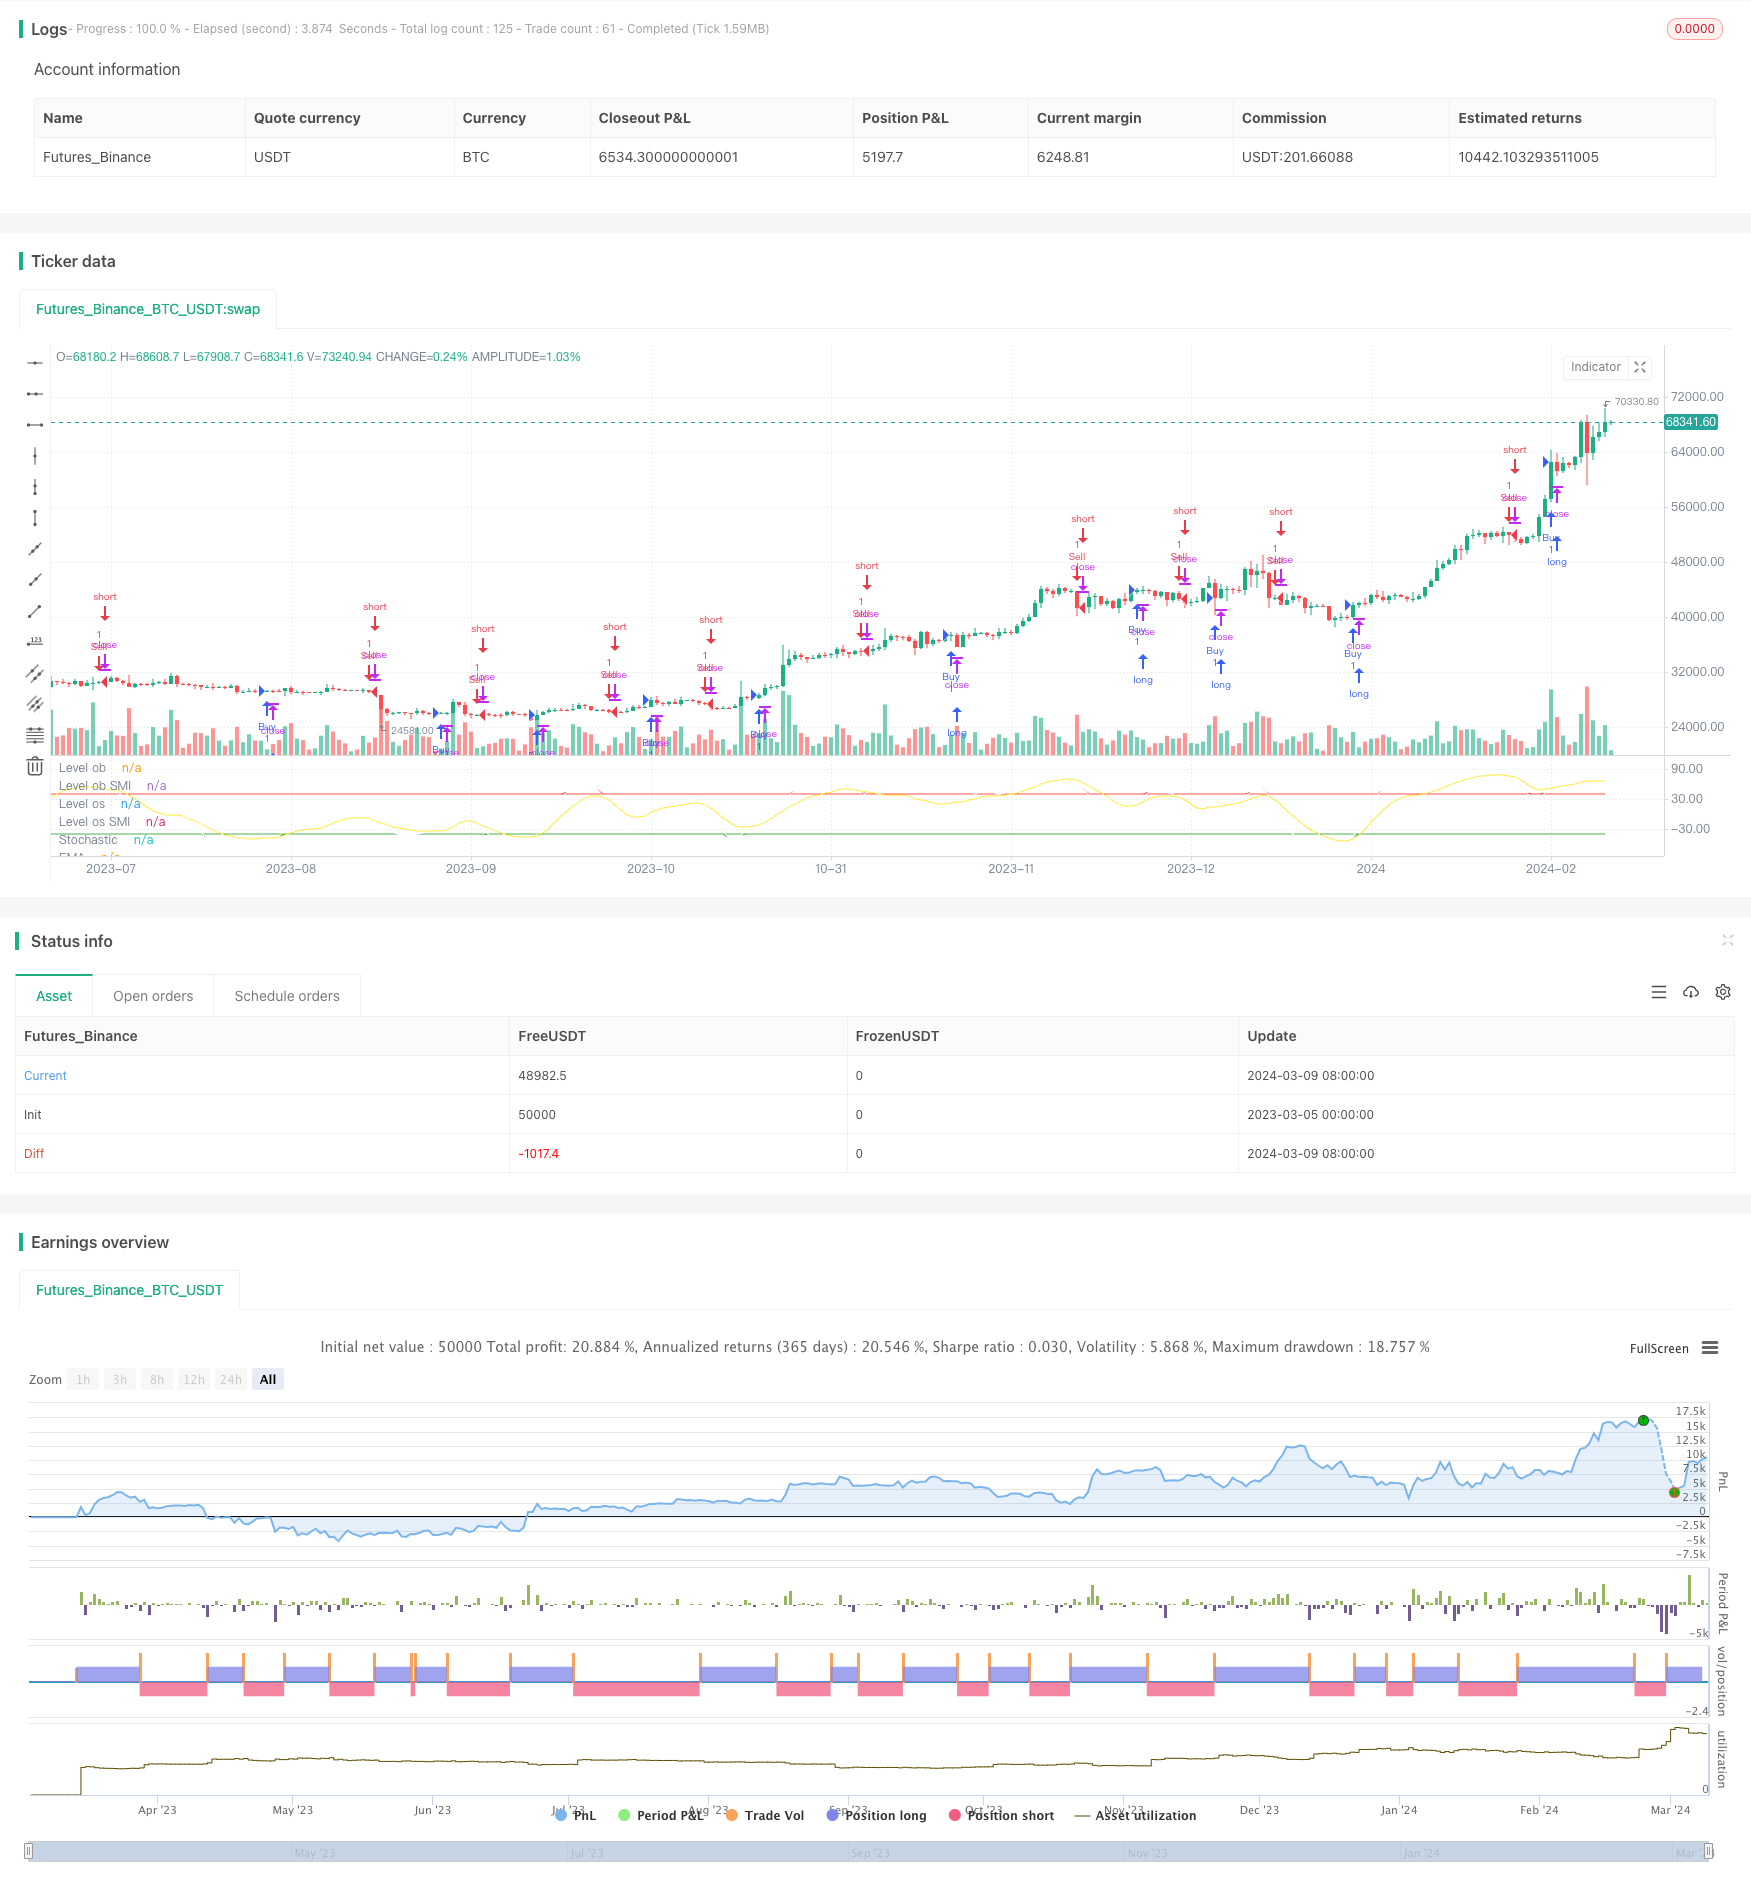 [trans]
策略概述
本文介绍了一种基于随机力矩指标(Stochastics Momentum Index, SMI)的量化交易策略。该策略利用SMI指标和其指数移动平均线(EMA)的交叉信号来识别潜在的买入和卖出机会。当SMI信号线上穿其EMA时,触发买入信号;当SMI信号线下穿其EMA时,触发卖出信号。
策略原理
该策略的核心是随机力矩指标(SMI)。SMI是一种动量震荡指标,用于衡量一段时间内收盘价相对于高低价范围的位置。具体来说,该策略首先计算指定周期内的最高价和最低价,然后计算收盘价与高低价中点的差值,以及最高价和最低价的差值。接下来,策略计算SMI值,即相对差值平均值与绝对差值平均值之比乘以100。最后,策略计算SMI的指数移动平均线作为信号线。
当SMI信号线上穿其EMA时,表明上涨动能增强,触发买入信号;当SMI信号线下穿其EMA时,表明下跌动能增强,触发卖出信号。此外,该策略还通过超买和超卖水平来标记SMI的极端状态。
策略优势
-
该策略基于强大的动量指标SMI,能够有效捕捉市场趋势和动量的变化。
-
策略逻辑清晰,易于理解和实现。
-
通过使用指数移动平均线作为信号线,策略能够平滑价格噪声,提高信号可靠性。
-
超买和超卖水平的标记为策略提供了额外的风险管理工具。
策略风险
-
该策略依赖于单一指标SMI,可能面临指标失效的风险。为了缓解这一风险,可以考虑结合其他技术指标或基本面因素来确认交易信号。
-
策略在震荡市场中可能会产生频繁的交易信号,导致高昂的交易成本。为了解决这一问题,可以通过优化参数或引入过滤机制来减少交易频率。
-
该策略没有明确的止损机制,可能面临单笔交易风险过大的问题。可以通过设置适当的止损位来控制风险。
策略优化方向
-
参数优化:该策略的表现在很大程度上取决于SMI计算中使用的参数,如%K长度、%D长度等。通过对这些参数进行优化,可以提高策略的表现。
-
信号过滤:为了减少交易频率和提高信号质量,可以考虑引入额外的过滤机制,如趋势确认、交易量确认等。
-
风险管理:在策略中加入明确的止损和仓位管理规则,可以更好地控制风险,提高策略的稳健性。
-
多因子结合:将SMI信号与其他技术指标或基本面因素相结合,形成更全面、更可靠的交易决策机制。
总结
本文介绍了一种基于随机力矩指标(SMI)的量化交易策略。该策略利用SMI指标与其指数移动平均线的交叉信号来识别潜在的买卖机会。策略的优势在于基于强大的动量指标、逻辑清晰、易于实现,同时通过使用移动平均线和超买超卖水平来提高信号可靠性和风险管理。然而,该策略也面临着单一指标失效、高频交易和风险控制不足等风险。为了进一步提升策略表现,可以从参数优化、信号过滤、风险管理和多因子结合等方面进行优化。总的来说,该策略为量化交易提供了一种简单而有效的思路,但在实际应用中还需要根据具体情况进行适当调整和优化。
||
Strategy Overview
This article introduces a quantitative trading strategy based on the Stochastics Momentum Index (SMI). The strategy utilizes the crossover signals between the SMI indicator and its exponential moving average (EMA) to identify potential buying and selling opportunities. When the SMI signal line crosses above its EMA, it triggers a buy signal; when the SMI signal line crosses below its EMA, it triggers a sell signal.
Strategy Principle
The core of this strategy is the Stochastics Momentum Index (SMI). SMI is a momentum oscillator that measures the closing price relative to the high-low range over a specified period. Specifically, the strategy first calculates the highest high and lowest low over the specified period, then computes the difference between the closing price and the midpoint of the high-low range, as well as the difference between the highest high and lowest low. Next, the strategy calculates the SMI value, which is the ratio of the average relative difference to the average absolute difference multiplied by 100. Finally, the strategy calculates the exponential moving average of SMI as the signal line.
When the SMI signal line crosses above its EMA, it indicates increasing upward momentum and triggers a buy signal; when the SMI signal line crosses below its EMA, it indicates increasing downward momentum and triggers a sell signal. Additionally, the strategy marks the overbought and oversold levels to identify extreme states of SMI.
Strategy Advantages
-
The strategy is based on the powerful momentum indicator SMI, which can effectively capture changes in market trends and momentum.
-
The strategy logic is clear and easy to understand and implement.
-
By using the exponential moving average as the signal line, the strategy can smooth price noise and improve signal reliability.
-
The marking of overbought and oversold levels provides additional risk management tools for the strategy.
Strategy Risks
-
The strategy relies on a single indicator, SMI, and may face the risk of indicator failure. To mitigate this risk, one can consider combining other technical indicators or fundamental factors to confirm trading signals.
-
The strategy may generate frequent trading signals in choppy markets, leading to high transaction costs. To address this issue, one can reduce trading frequency by optimizing parameters or introducing filtering mechanisms.
-
The strategy lacks an explicit stop-loss mechanism and may face the problem of excessive single-trade risk. This can be addressed by setting appropriate stop-loss levels to control risk.
Strategy Optimization Directions
-
Parameter Optimization: The performance of the strategy largely depends on the parameters used in the SMI calculation, such as %K length, %D length, etc. By optimizing these parameters, the performance of the strategy can be improved.
-
Signal Filtering: To reduce trading frequency and improve signal quality, additional filtering mechanisms such as trend confirmation and volume confirmation can be considered.
-
Risk Management: Incorporating explicit stop-loss and position management rules into the strategy can better control risk and enhance the robustness of the strategy.
-
Multi-Factor Combination: Combining SMI signals with other technical indicators or fundamental factors to form a more comprehensive and reliable trading decision mechanism.
Summary
This article introduces a quantitative trading strategy based on the Stochastics Momentum Index (SMI). The strategy utilizes the crossover signals between the SMI indicator and its exponential moving average to identify potential buying and selling opportunities. The advantages of the strategy lie in its basis on a powerful momentum indicator, clear logic, ease of implementation, and the use of moving averages and overbought/oversold levels to improve signal reliability and risk management. However, the strategy also faces risks such as single indicator failure, high-frequency trading, and insufficient risk control. To further enhance the performance of the strategy, optimization can be made in terms of parameter optimization, signal filtering, risk management, and multi-factor combination. Overall, the strategy provides a simple yet effective approach for quantitative trading, but it requires appropriate adjustments and optimizations based on specific circumstances in practical applications. [/trans]
Strategy Arguments
| Argument | Default | Description |
|---|---|---|
| v_input_int_1 | 10 | Percent K Length |
| v_input_int_2 | 3 | Percent D Length |
| v_input_int_3 | 40 | Overbought |
| v_input_int_4 | -40 | Oversold |
Source (PineScript)
/*backtest
start: 2023-03-05 00:00:00
end: 2024-03-10 00:00:00
period: 1d
basePeriod: 1h
exchanges: [{"eid":"Futures_Binance","currency":"BTC_USDT"}]
*/

//@version=5
strategy("Stochastics Momentum Index Strategy", shorttitle="SMI_BackTest", overlay=false)

// Input parameters
a = input.int(10, "Percent K Length")
b = input.int(3, "Percent D Length")
ob = input.int(40, "Overbought")
os = input.int(-40, "Oversold")

// Range Calculation
ll = ta.lowest(low, a)
hh = ta.highest(high, a)
diff = hh - ll
rdiff = close - (hh+ll)/2

avgrel = ta.ema(ta.ema(rdiff,b),b)
avgdiff = ta.ema(ta.ema(diff,b),b)

// SMI calculations
SMI = avgdiff != 0 ? (avgrel/(avgdiff/2)*100) : 0
SMIsignal = ta.ema(SMI,b)
emasignal = ta.ema(SMI, 10)

// Color Definition for Stochastic Line
col = SMI >= ob ? color.green : SMI <= os ? color.red : color.white

plot(SMIsignal, title="Stochastic", color=color.white)

plot(emasignal, title="EMA", color=color.yellow)

level_40 = ob
level_40smi = SMIsignal > level_40 ? SMIsignal : level_40

level_m40 = os
level_m40smi = SMIsignal < level_m40 ? SMIsignal : level_m40

plot(level_40, "Level ob", color=color.red)
plot(level_40smi, "Level ob SMI", color=color.red, style=plot.style_line)

plot(level_m40, "Level os", color=color.green)
plot(level_m40smi, "Level os SMI", color=color.green, style=plot.style_line)

//fill(level_40, level_40smi, color=color.red, transp=ob, title="OverSold")
//fill(level_m40, level_m40smi, color=color.green, transp=ob, title="OverBought")

// Strategy Tester
longCondition = ta.crossover(SMIsignal, emasignal)
if (longCondition)
    strategy.entry("Buy", strategy.long)

shortCondition = ta.crossunder(SMIsignal, emasignal)
if (shortCondition)
    strategy.entry("Sell", strategy.short)
Detail
https://www.fmz.com/strategy/444334
Last Modified
2024-03-11 10:46:10