
8.7 KiB
Name
基于量价弥长计的波动力量策略VB-Strategy-Based-on-Volume-Balances
Author
ChaoZhang
Strategy Description
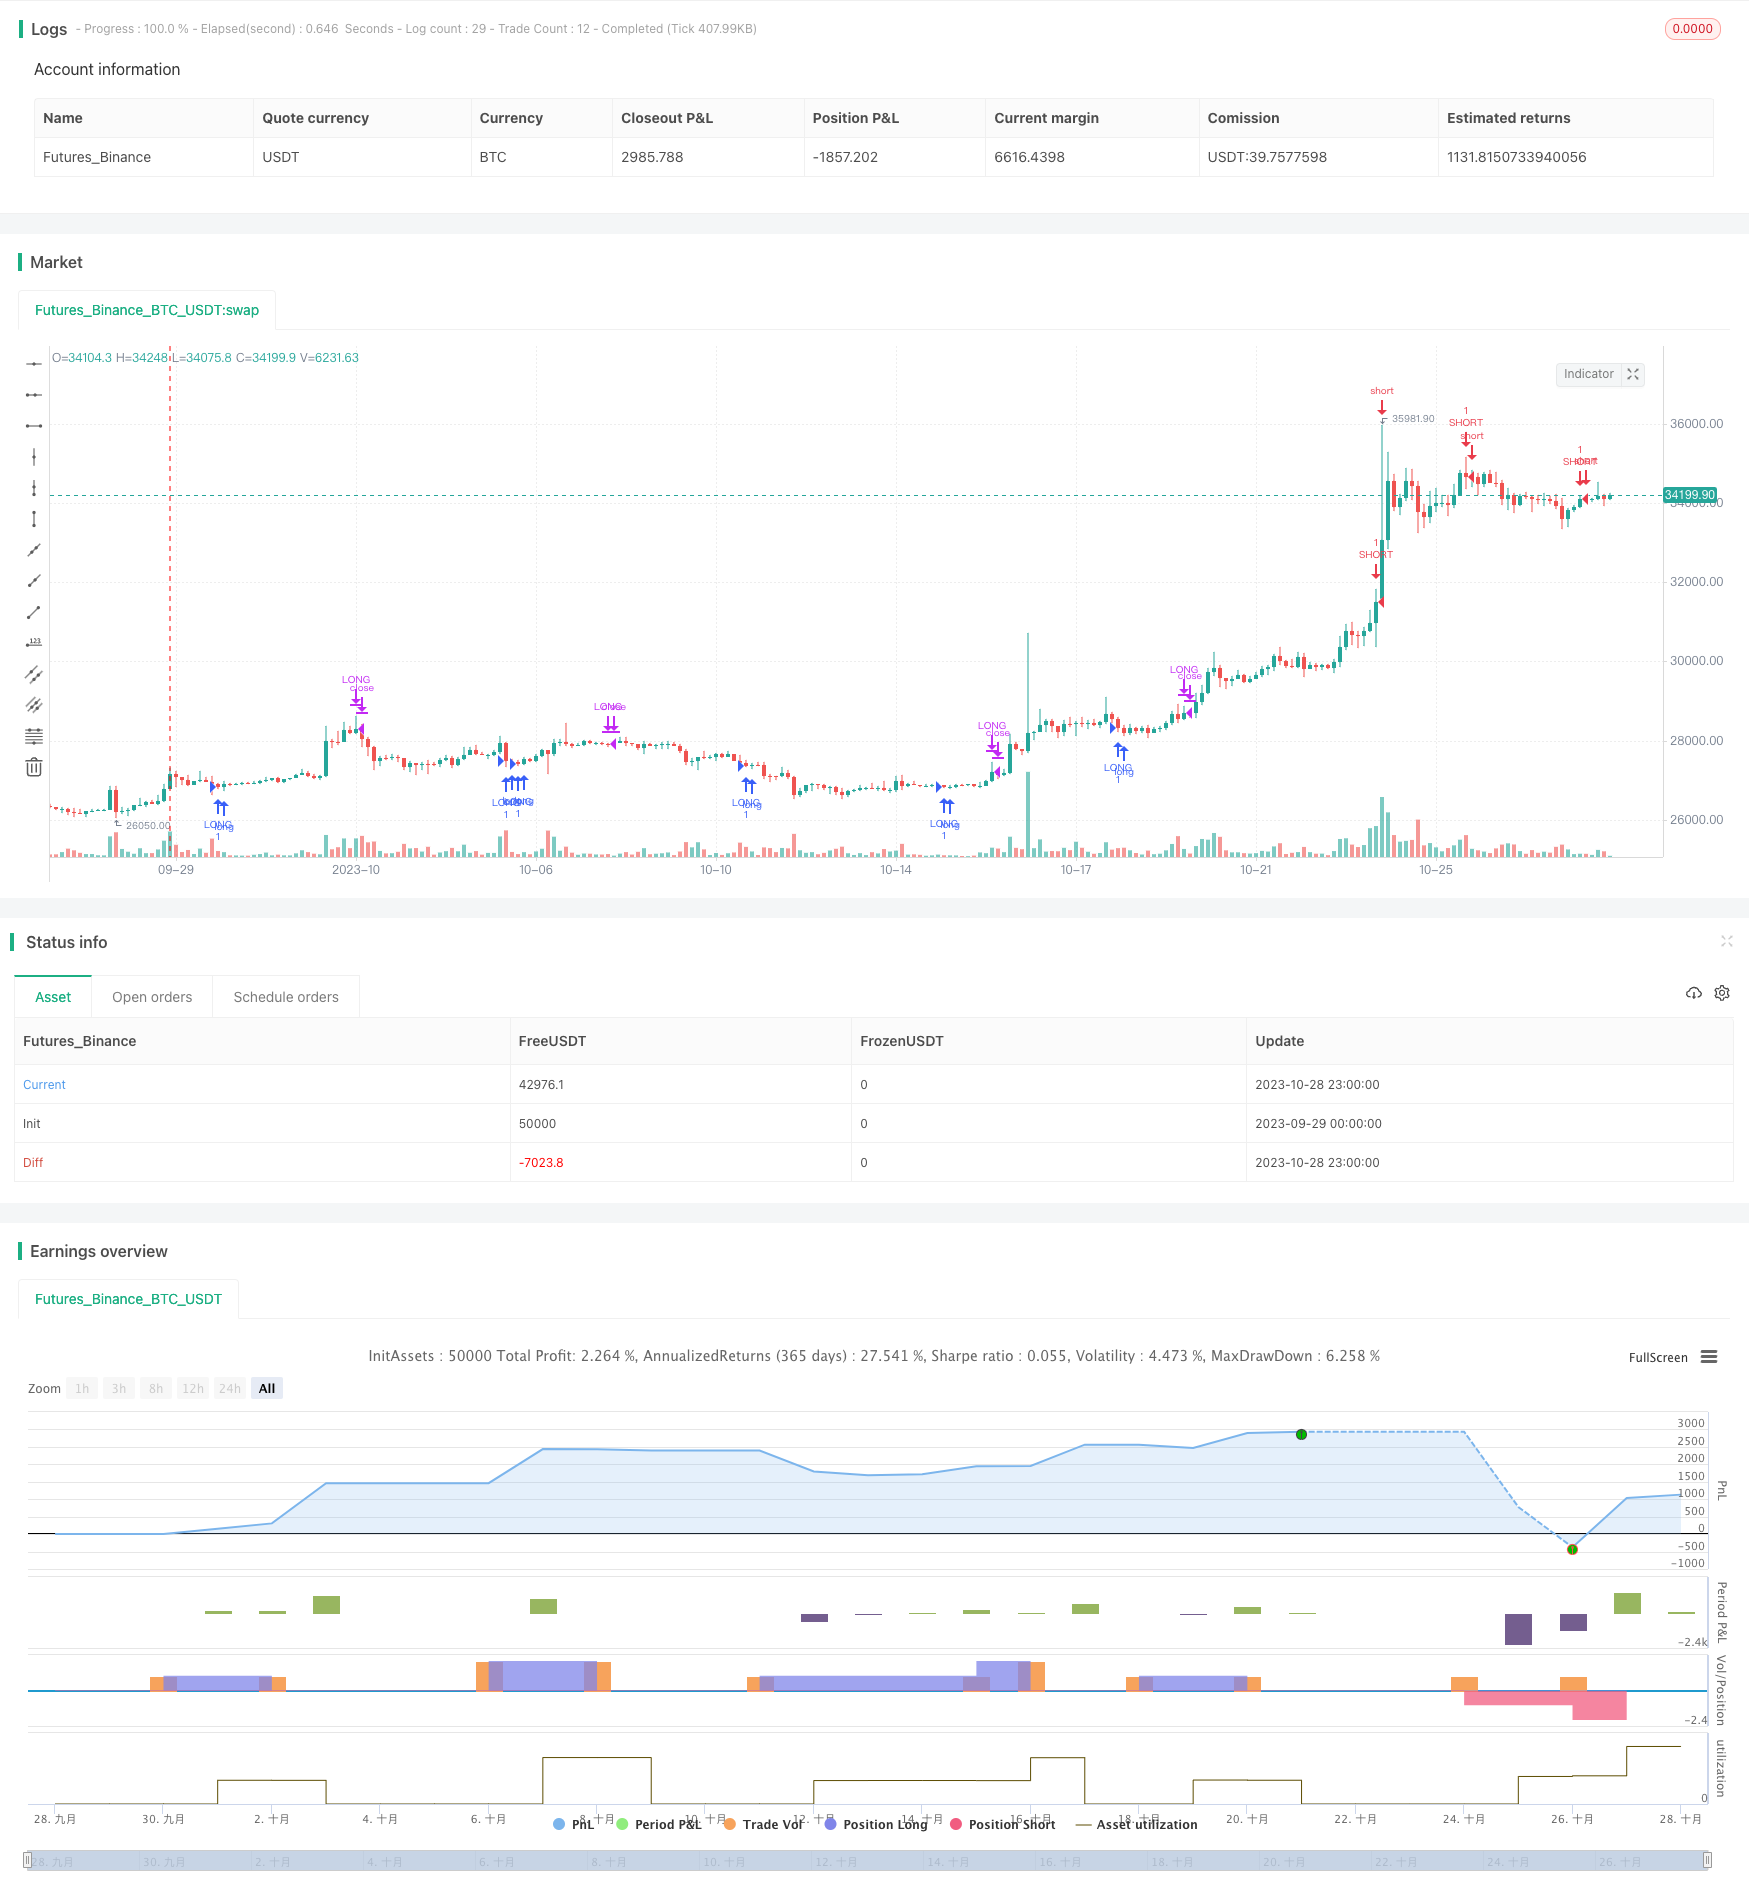
[trans]
该策略基于量价弥长计指标设计交易信号,可实现对市场买卖力量的判断。
策略原理
量价弥长计指标(VB)反映了成交量变化对价格的推动力。它的构造思路是:
-
计算典型价格的日内波动率代表价格变动力量。
-
通过成交量和价格波动力量的乘积,判断收盘时的买卖力量。
-
指标数值在0轴上下波动,多空力量的测量依据是指标数值的正负。
本策略构建VB指标,并设定信号线。当VB指标上穿信号线时产生买入信号;当VB指标下穿信号线时产生卖出信号。
代码主要步骤如下:
-
计算典型价格的日内波动率inter作为价格变动力量。
-
设置波动力量的截断范围coef,超出该范围的波动力量归为coef。
-
计算截断后的量化力量vcp。
-
求和vcp获得量化指标vfi。
-
设置信号线长度signalLength,获得信号线vfima。
-
比较VB指标vfi和信号线vfima,产生交易信号。
策略优势
该策略具有以下优势:
-
利用量价关系判断市场买卖力量,不受价格本身的影响。
-
可设置参数控制量化力量的计算范围,避免异常波动的影响。
-
结合VB指标本身与信号线的比较,可设定合理的入场时机。
-
指标计算方法简单清晰,易于实盘操作。
-
可自定义指标参数和信号线参数,优化策略效果。
策略风险
该策略也存在一些风险:
-
VB指标对价格异常波动敏感,需要适当设置截断参数。
-
股价背离指标信号的概率较大,应避免盲目跟单。
-
需要适当优化指标参数及信号线参数,防止产生假信号。
-
适用于具有明显量价特征的品种,不宜应用于流动性差的品种。
-
需关注指标发散的情况,可能预示着市场反转。
可通过调整参数范围、结合其它指标进行过滤、适当宽松止损来控制风险。
策略优化方向
该策略可以从以下方面进行优化:
-
优化量化力量的计算参数,平衡灵敏度和平稳度。
-
优化信号线参数,平衡延迟和噪音。
-
增加Volume Spread Analysis等指标进行效果验证。
-
增加趋势及支撑阻力指标,避免不利方向交易。
-
设定动态止损机制,根据市场波动程度调整止损点。
-
采用机器学习方法训练最优参数组合。
-
在多品种及不同周期上进行回测,评估策略稳健性。
-
比较不同指标参数对收益曲线的影响,寻找最优参数。
总结
该策略基于量价弥长计指标,对买卖力量进行判断。它具有指标设计简单、参数可调整等优点,也存在一定的假信号风险。通过参数优化、规避不利市场等措施,可以提高策略稳定性。后续可从多角度继续优化和验证该策略,提升实盘效果。
||
This strategy is designed based on the Volume Balances indicator to determine the buying and selling power in the market.
Strategy Logic
The Volume Balances (VB) indicator reflects the driving force of volume changes on prices. Its construction idea is:
-
Calculate the intraday volatility rate of typical price as the price momentum.
-
Judge the buying and selling power at close by the product of volume and price momentum.
-
The indicator fluctuates above and below the 0-axis. The criteria for measuring buying and selling power is the positivity and negativity of the indicator value.
This strategy constructs the VB indicator and sets a signal line. A buy signal is generated when the VB indicator crosses above the signal line. A sell signal is generated when the VB indicator crosses below the signal line.
The main steps of the code are:
-
Calculate the intraday volatility rate of typical price inter as the price momentum.
-
Set the cutoff range coef for the momentum. The excess momentum above the range is taken as coef.
-
Calculate the quantified momentum vcp after cutoff.
-
Sum vcp to obtain the quantified indicator vfi.
-
Set the length of the signal line signalLength and obtain it vfima.
-
Compare the VB indicator vfi with the signal line vfima to generate trading signals.
Advantages
The advantages of this strategy are:
-
Use the volume-price relationship to judge the buying and selling power, unaffected by the price itself.
-
The calculation range of the quantified momentum can be controlled by parameters to avoid the impact of abnormal fluctuations.
-
Combining the comparison between the VB indicator itself and the signal line can set reasonable entry timing.
-
The indicator calculation method is simple and clear, easy to operate in live trading.
-
Customizable indicator parameters and signal line parameters for optimizing strategy performance.
Risks
There are also some risks in this strategy:
-
The VB indicator is sensitive to abnormal price fluctuations. Proper cutoff parameters need to be set.
-
The probability of price divergence from indicator signals is high. Blind following should be avoided.
-
Indicator parameters and signal line parameters need proper optimization to prevent false signals.
-
More suitable for products with obvious volume-price characteristics. Not suitable for low liquidity products.
-
Pay attention to the divergence of the indicator, which may signal a market reversal.
Risks can be controlled by adjusting parameter range, using other filters, allowing proper loose stop loss, etc.
Optimization Directions
The strategy can be optimized in the following aspects:
-
Optimize calculation parameters for quantified momentum to balance sensitivity and stability.
-
Optimize signal line parameters to balance lag and noise.
-
Add other indicators like Volume Spread Analysis for verification.
-
Add trend and support/resistance indicators to avoid unfavorable trades.
-
Set dynamic stop loss based on market volatility.
-
Use machine learning to find the optimal parameter combination.
-
Backtest across variety of products and timeframes to evaluate robustness.
-
Compare indicator parameters' impact on profit curve to find the optimum.
Summary
This strategy judges buying/selling power based on the Volume Balances indicator. It has advantages like simple indicator design and adjustable parameters, and also risks like false signals. Further optimization and verification from multiple aspects can improve live performance.
[/trans]
Strategy Arguments
| Argument | Default | Description |
|---|---|---|
| v_input_1 | 130 | 거래량 길이 |
| v_input_2 | 0.2 | 계수 |
| v_input_3 | 2.5 | 최대 계수 |
| v_input_4 | 5 | signalLength |
| v_input_5 | false | 부드럽게 |
| v_input_6 | 20 | 볼밴 길이 |
Source (PineScript)
/*backtest
start: 2023-09-29 00:00:00
end: 2023-10-29 00:00:00
period: 3h
basePeriod: 15m
exchanges: [{"eid":"Futures_Binance","currency":"BTC_USDT"}]
*/

//@version=3
strategy("VB Strategy", overlay=true)

length = input(130, title="거래량 길이")
coef = input(0.2, title="계수")
vcoef = input(2.5, title="최대 계수")
signalLength=input(5)
smoothVFI=input(false, type=bool, title="부드럽게")
//볼밴
length2 = input(20, minval=1, title="볼밴 길이")

ma(x,y) => smoothVFI ? sma(x,y) : x

typical=hlc3
inter = log( typical ) - log( typical[1] )
vinter = stdev(inter, 30 )
cutoff = coef * vinter * close
vave = sma( volume, length )[1]
vmax = vave * vcoef
vc = iff(volume < vmax, volume, vmax)
mf = typical - typical[1]
vcp = iff( mf > cutoff, vc, iff ( mf < -cutoff, -vc, 0 ) )

vfi = ma(sum( vcp , length )/vave, 3)
vfima=ema( vfi, signalLength )
d=vfi-vfima

upper = vfima + stdev(vfi, length2)
lower = vfima - stdev(vfi, length2)

buysignal = cross(vfi, lower) and crossunder(vfi, lower) == 1 ? vfima : na

sellsignal = cross(vfi, upper) and crossover(vfi, upper) == 1 ? vfima : na

//times = timestamp("GMT+6", 2017, 12, 6, 00, 00)

//if (buysignal and times <= time)
if (buysignal)
    if(strategy.position_size < 0)
        strategy.close("SHORT")

    if(strategy.position_size > 0)
        strategy.order("LONG", true, 1, when = (low+high)/2)

    if(strategy.position_size == 0)
        strategy.entry("LONG", strategy.long, when = (low+high)/2)

//if (sellsignal and times <= time)
if (sellsignal)
    if(strategy.position_size > 0)
        strategy.close("LONG")

    if(strategy.position_size < 0)
        strategy.order("SHORT", false, 1, when = (low+high)/2)

    if(strategy.position_size == 0)
        strategy.entry("SHORT", strategy.short, when = (low+high)/2)
Detail
https://www.fmz.com/strategy/430594
Last Modified
2023-10-30 17:03:02