
9.1 KiB
Name
基于连续三根阴线和双均线的交易策略Trading-Strategy-Based-on-Three-Consecutive-Bearish-Candles-and-Dual-Moving-Averages
Author
ChaoZhang
Strategy Description
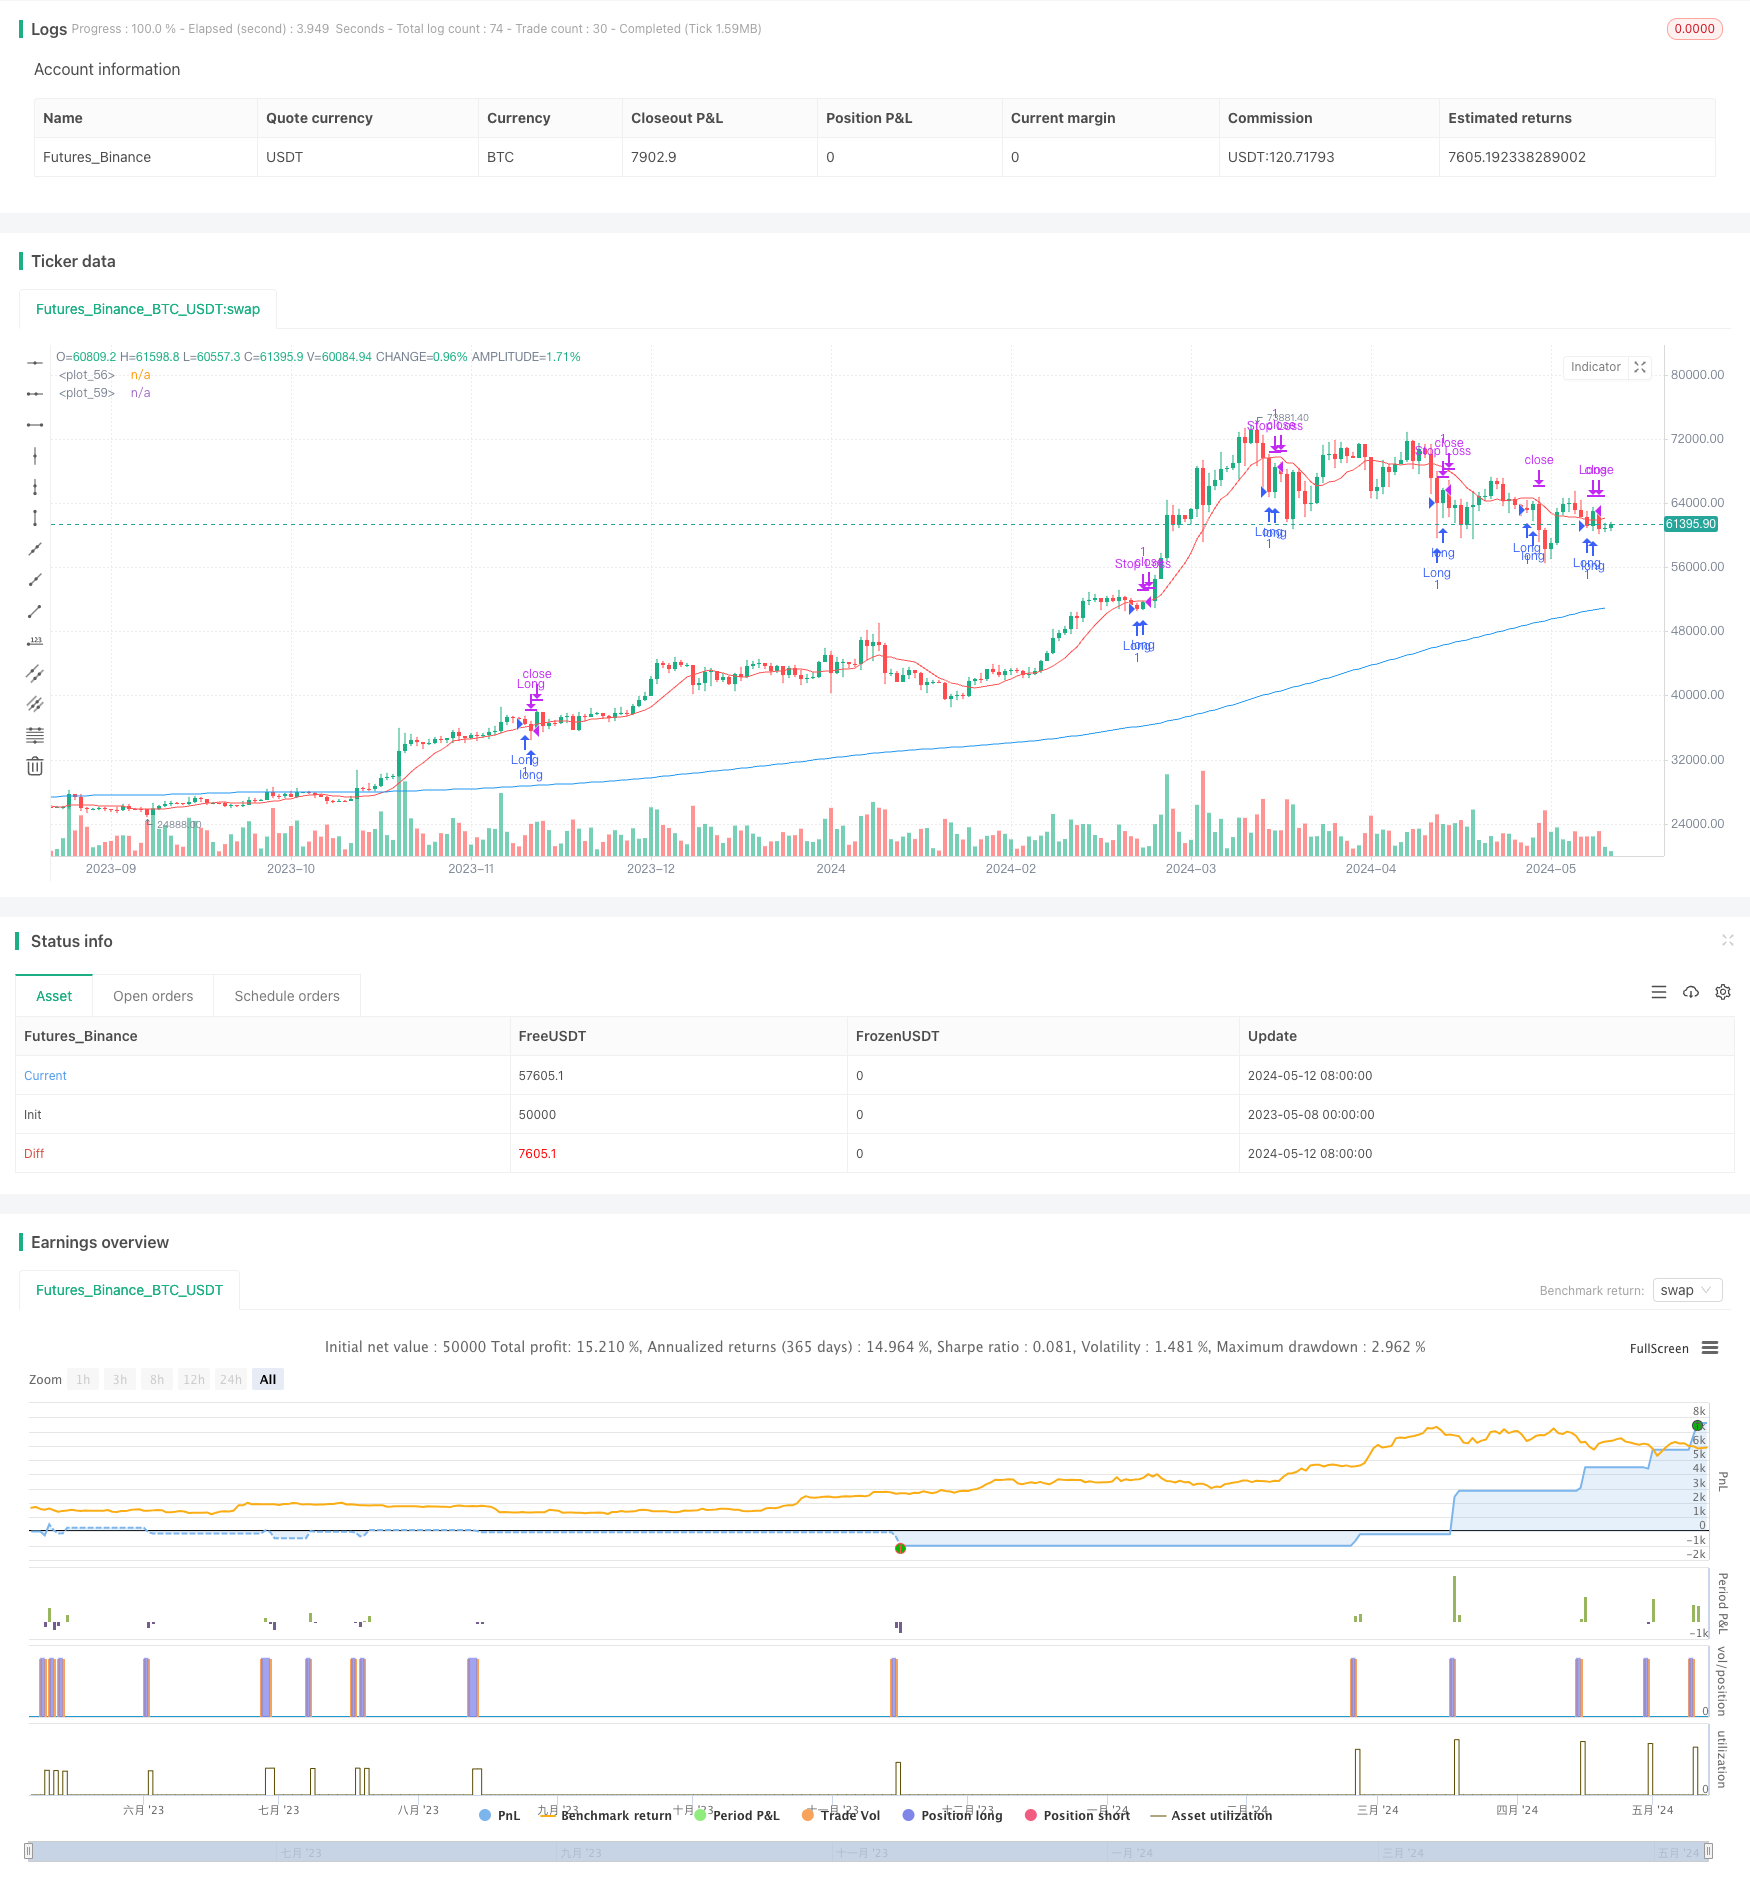
[trans]
概述
该策略是一个基于连续三根阴线和双均线的交易策略。策略的主要思路是:当连续出现三根阴线,并且当前收盘价高于200日均线时,开仓做多;当10日均线与价格发生交叉,或者价格达到止盈或止损点位时,平仓。该策略只在指定的时间范围内运行。
策略原理
- 计算连续阴线的数量。如果收盘价下跌,连续阴线数加1;否则,连续阴线数重置为0。
- 计算10日均线和200日均线。
- 判断当前收盘价是否高于10日均线。
- 判断是否满足进场条件:连续三根阴线、当前时间在指定范围内,且当前收盘价高于200日均线。
- 判断是否满足出场条件:10日均线与价格发生交叉,或者价格达到止盈或止损点位。
- 如果满足进场条件且当前无持仓,则开仓做多。
- 如果满足出场条件且当前有持仓,则平仓。
策略优势
- 考虑了价格走势和均线因素,能够在趋势和震荡行情中把握机会。
- 设置了止盈止损,可以有效控制风险。
- 限定了策略运行的时间范围,可以避免在某些特定时期承担过大风险。
- 代码逻辑清晰,可读性强,便于理解和优化。
策略风险
- 对于连续阴线的判断可能过于简单,容易引发错误信号。
- 止盈止损的设置可能不够灵活,在行情波动较大时,可能导致频繁交易或者错失机会。
- 对于突发事件、重大消息等非常规因素考虑不足,可能承担额外风险。
策略优化方向
- 可以考虑引入更多技术指标,如RSI、MACD等,构建更稳健的信号判断逻辑。
- 可以优化止盈止损的设置,引入动态止盈止损或者基于ATR等波动率指标的止损。
- 可以研究不同参数设置对策略的影响,如连续阴线根数、均线周期等,寻找最优参数组合。
- 可以加入仓位管理,根据不同市场环境动态调整仓位,提高资金利用效率。
总结
该策略通过连续阴线和双均线的组合,构建了一个简单易懂的交易模型。策略在把握趋势性机会的同时,也设置了一定的风控措施。但是,策略在信号判断和风险控制方面还有进一步优化的空间。通过引入更多技术指标、优化参数设置、动态止盈止损和仓位管理等措施,可以进一步提升策略的稳健性和盈利能力。
||
Overview
This strategy is a trading strategy based on three consecutive bearish candles and dual moving averages. The main idea of the strategy is: when there are three consecutive bearish candles and the current closing price is higher than the 200-day moving average, open a long position; when the 10-day moving average crosses with the price, or the price reaches the take-profit or stop-loss level, close the position. The strategy only runs within a specified time range.
Strategy Principle
- Calculate the number of consecutive bearish candles. If the closing price decreases, the number of consecutive bearish candles increases by 1; otherwise, it resets to 0.
- Calculate the 10-day and 200-day moving averages.
- Determine if the current closing price is higher than the 10-day moving average.
- Check if the entry conditions are met: three consecutive bearish candles, the current time is within the specified range, and the current closing price is higher than the 200-day moving average.
- Check if the exit conditions are met: the 10-day moving average crosses with the price, or the price reaches the take-profit or stop-loss level.
- If the entry conditions are met and there is no current position, open a long position.
- If the exit conditions are met and there is a current position, close the position.
Strategy Advantages
- It considers price movement and moving average factors, enabling it to capture opportunities in both trending and oscillating markets.
- It sets take-profit and stop-loss levels, which can effectively control risks.
- It limits the running time range of the strategy, avoiding excessive risks during certain specific periods.
- The code logic is clear and readable, making it easy to understand and optimize.
Strategy Risks
- The judgment of consecutive bearish candles may be too simple, easily triggering false signals.
- The setting of take-profit and stop-loss levels may not be flexible enough, leading to frequent trades or missed opportunities when the market fluctuates greatly.
- It lacks consideration for unexpected events, major news, and other unconventional factors, potentially assuming additional risks.
Strategy Optimization Directions
- Consider introducing more technical indicators, such as RSI and MACD, to build a more robust signal judgment logic.
- Optimize the setting of take-profit and stop-loss levels, introducing dynamic take-profit/stop-loss or stop-loss based on volatility indicators like ATR.
- Study the impact of different parameter settings on the strategy, such as the number of consecutive bearish candles, moving average periods, etc., to find the optimal parameter combination.
- Incorporate position management to dynamically adjust positions based on different market environments, improving capital utilization efficiency.
Summary
This strategy constructs a simple and easy-to-understand trading model through the combination of consecutive bearish candles and dual moving averages. While capturing trending opportunities, the strategy also sets certain risk control measures. However, there is further room for optimization in signal judgment and risk control. By introducing more technical indicators, optimizing parameter settings, implementing dynamic take-profit/stop-loss and position management, the robustness and profitability of the strategy can be further improved. [/trans]
Source (PineScript)
/*backtest
start: 2023-05-08 00:00:00
end: 2024-05-13 00:00:00
period: 1d
basePeriod: 1h
exchanges: [{"eid":"Futures_Binance","currency":"BTC_USDT"}]
*/

//@version=5
strategy("Estrategia de Trading", overlay=true)

// Definir el número de cierres de velas decrecientes consecutivas
var int cierres_decrecientes_consecutivos = 0
num_cierres_decrecientes = input.int(3, title="Número de cierres decrecientes", minval=1)

// Definir el porcentaje de cambio para cerrar la operación
porcentaje_cierre_arriba = input.float(1.5, title="Porcentaje de cierre arriba (%)", step=0.1)
porcentaje_cierre_abajo = input.float(1.0, title="Porcentaje de cierre abajo (%)", step=0.1)

// Definir las medias móviles para el cierre de la operación
periodos_media_movil_cierre = input.int(10, title="Períodos de la media móvil para cierre")
periodos_media_movil_200 = input.int(200, title="Períodos de la media móvil de 200")

// Definir el rango de fechas para la simulación
start_date = timestamp(2024, 1, 1, 0, 0)
end_date = timestamp(2024, 12, 31, 23, 59)

// Calcular la media móvil para el cierre de la operación
sma_cierre = ta.sma(close, periodos_media_movil_cierre)
sma_200 = ta.sma(close, periodos_media_movil_200)

// Calcular si el precio está por encima o por debajo de la media móvil para el cierre de la operación
precio_por_encima_sma_cierre = close > sma_cierre
precio_por_debajo_sma_cierre = close < sma_cierre

// Calcular si se han producido num_cierres_decrecientes consecutivos
if (ta.change(close) < 0)
    cierres_decrecientes_consecutivos := cierres_decrecientes_consecutivos + 1
else
    cierres_decrecientes_consecutivos := 0

es_cierres_consecutivos = cierres_decrecientes_consecutivos >= num_cierres_decrecientes

// Definir condiciones de entrada y salida de la estrategia dentro del rango de fechas y con el precio por encima de la SMA de 200
condicion_entrada = es_cierres_consecutivos and close > sma_200
condicion_cierre_sma = (precio_por_encima_sma_cierre[1] and not precio_por_encima_sma_cierre) or (not precio_por_encima_sma_cierre[1] and precio_por_encima_sma_cierre)

// Calcular precios de salida basados en porcentajes
precio_salida_arriba = strategy.position_avg_price * (1 + porcentaje_cierre_arriba / 100)
precio_salida_abajo = strategy.position_avg_price * (1 - porcentaje_cierre_abajo / 100)

// Ejecutar operación en largo dentro del rango de fechas y con el precio por encima de la SMA de 200
if (condicion_entrada and strategy.opentrades == 0)
    strategy.entry("Long", strategy.long)

// Cerrar operación en largo si se cumple la condición de salida por cambio en el cruce de la media móvil dentro del rango de fechas
if (strategy.position_size > 0 and condicion_cierre_sma)
    strategy.close("Long")

// Cerrar operación en largo si el precio alcanza el porcentaje de cierre arriba o abajo dentro del rango de fechas
strategy.exit("Stop Loss", "Long", limit=precio_salida_arriba, stop=precio_salida_abajo)

// Plot para visualizar la media móvil para el cierre de la operación
plot(sma_cierre, color=color.red)

// Plot para visualizar la SMA de 200
plot(sma_200, color=color.blue)
Detail
https://www.fmz.com/strategy/451412
Last Modified
2024-05-14 17:30:35