
13 KiB
Name
基于转折点的RSI背离策略Pivot-based-RSI-Divergence-Strategy
Author
ChaoZhang
Strategy Description
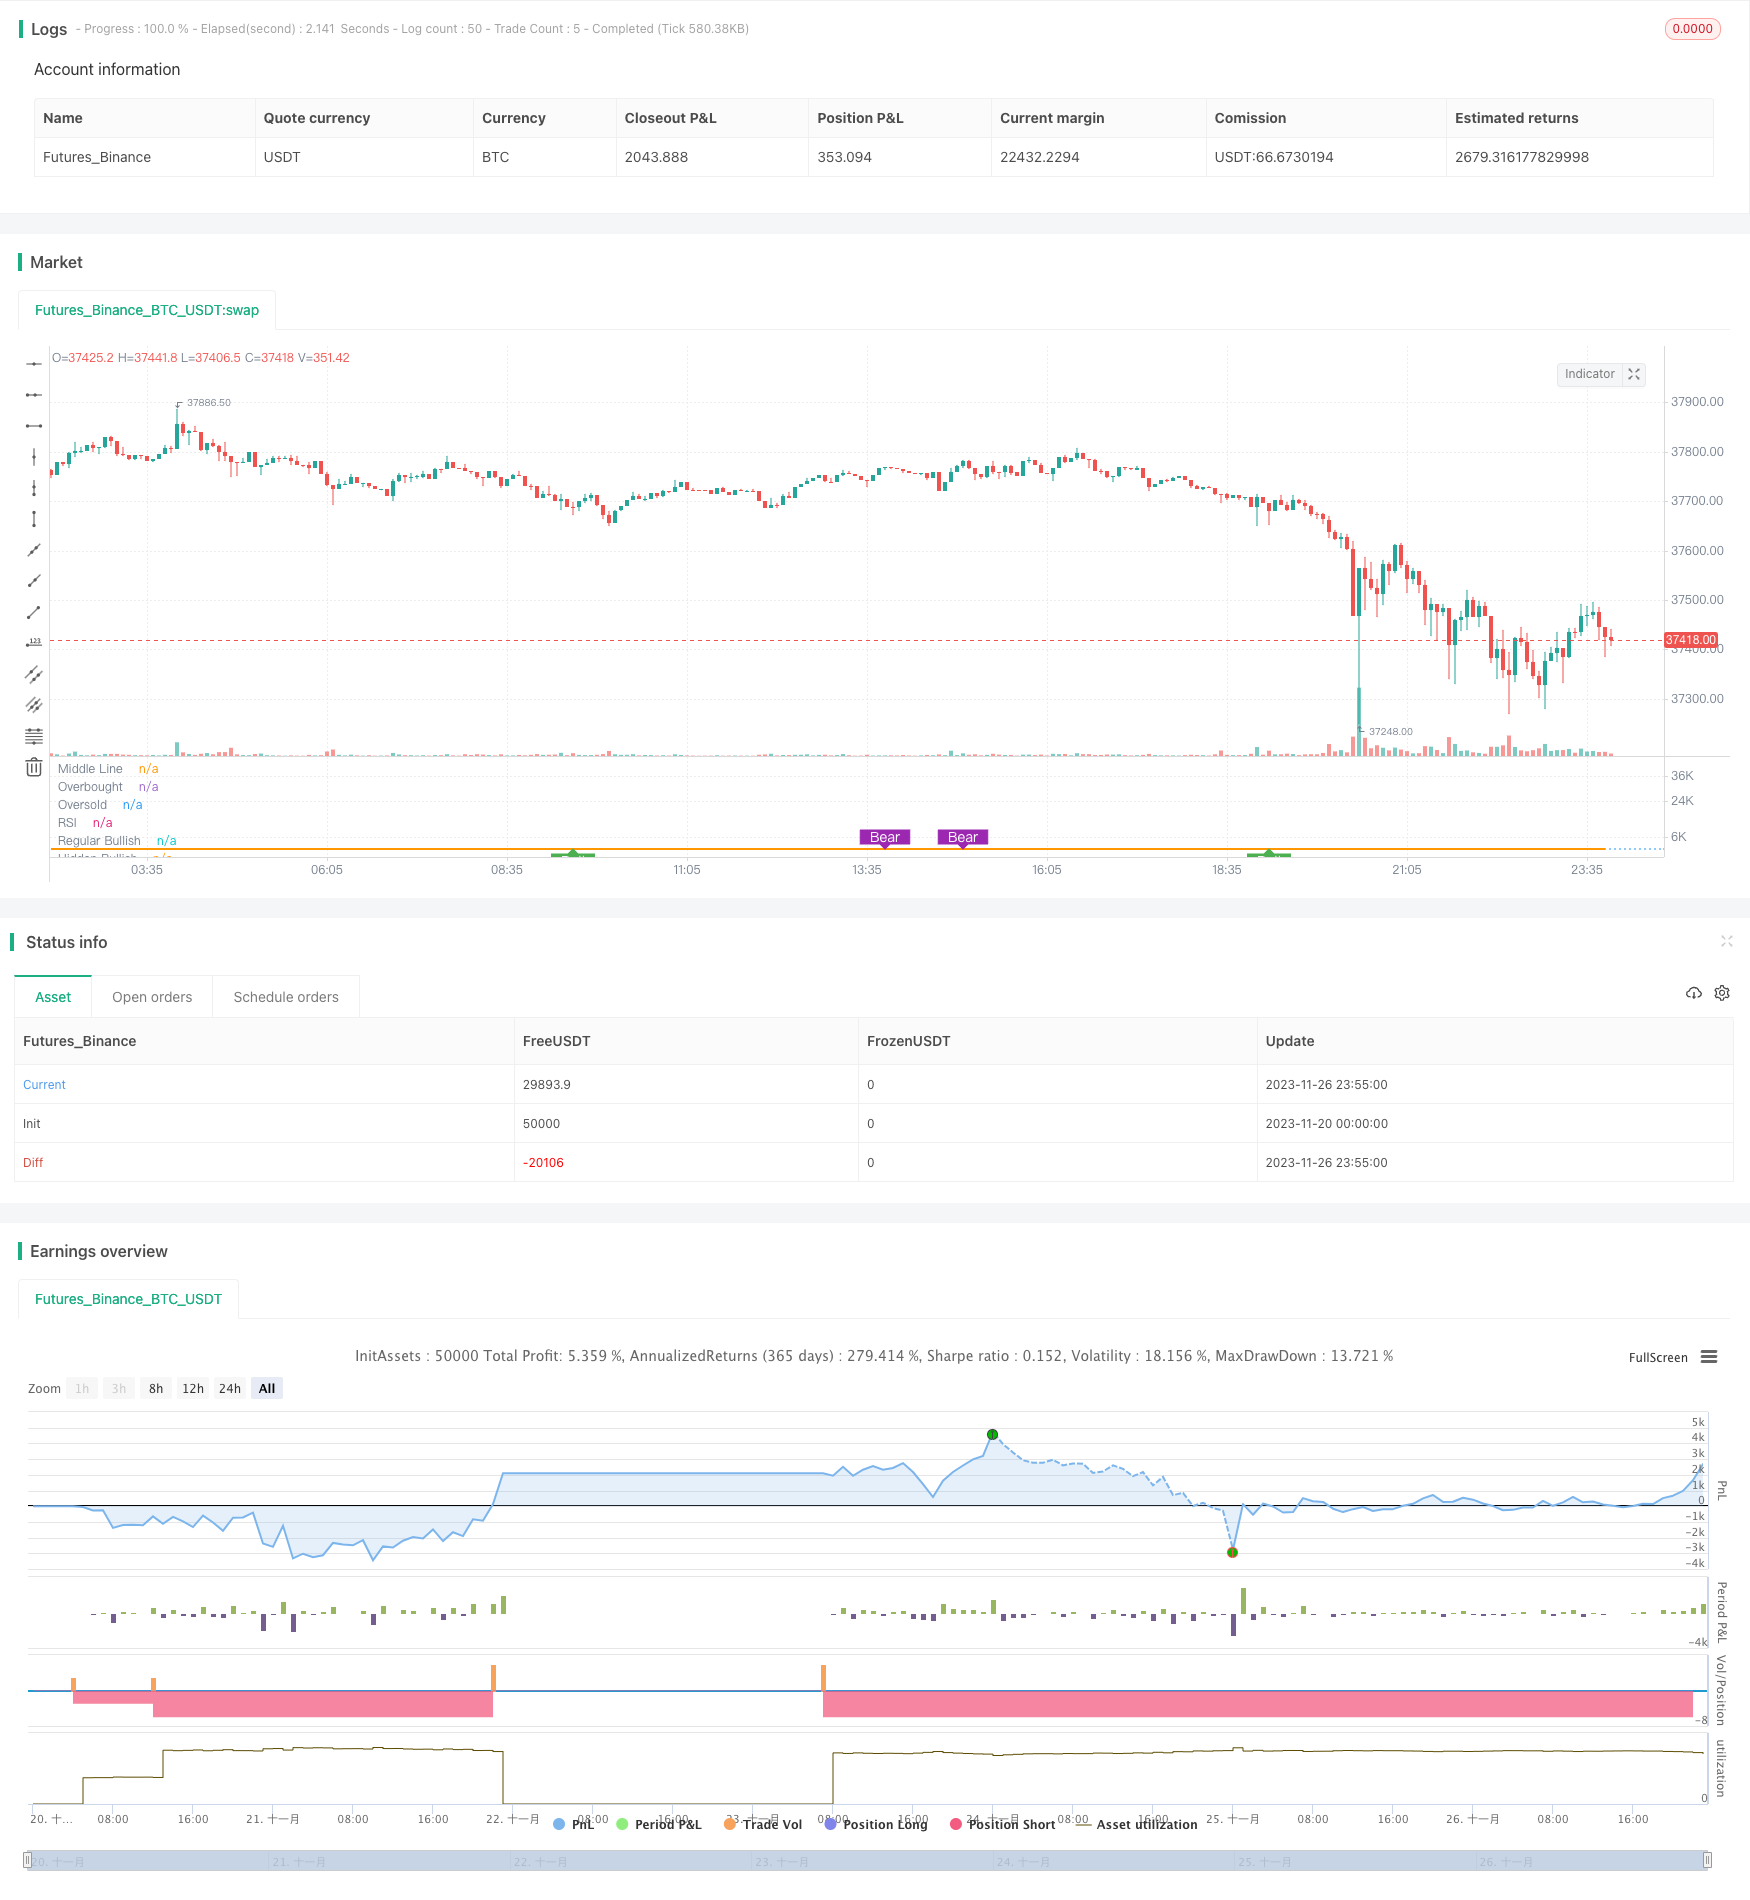 [trans]
概述
该策略名为“基于转折点的RSI背离策略”(Pivot-based RSI Divergence Strategy)。它利用RSI指标在不同周期上的背离来判断买入卖出点,并在此基础上增加了长线RSI作为过滤条件,从而提高策略的稳定性。
策略原理
该策略主要判断短线RSI(如5日RSI)与价格出现“隐藏型多头背离”或“常规型多头背离”时机会买入;出现“隐藏型空头背离”或“常规型空头背离”时机会卖出。
所谓“常规型多头背离”是指:价格创新低而RSI未创新低;“隐藏型多头背离”则相反,价格未创新低而RSI创新低。两者定义中的“新低”和“新高”是相对于一定滚动窗口的历史极值而言的。
此外,策略还引入长线RSI(如50日RSI)作为过滤条件。只有当长RSI大于50时,才考虑买入信号;当长RSI小于30时,考虑止损或止盈退出。
策略优势
该策略最大的优势在于同时利用短线RSI的背离信号和长线RSI的过滤,能够在一定程度上避免被套和错过行情。具体来说,主要具有以下几个优势:
- 短线RSI背离信号能提前判断价格反转机会,及时捕捉行情转折点;
- 长线RSI过滤条件避免在趋势不确定时盲目做多;
- 多种类型的止盈方式,分批止盈有利于减少风险;
- Pyramiding机制允许加仓,进一步提高盈利空间。
策略风险
该策略也存在一些风险需要注意:
- RSI背离并不总是有效,有可能出现假信号;
- 加仓后风险会放大。如果判断错误,亏损会加速扩大;
- 止盈设置不当也可能导致过早止盈或盈利不足。
对应风险管理措施包括:合理设定止损止盈条件、控制每个头寸大小、分批减仓以平滑盈亏曲线等。
优化方向
该策略还存在进一步优化的空间:
- RSI参数可以进一步优化,找到最佳参数组合;
- 可以测试其他指标的背离信号,如MACD、KD等;
- 可以在特定品种(如原油、贵金属等)上专门优化参数,提高适应性。
总结
本策略综合运用短线与长线RSI的多空背离信号,在控制风险的同时,提高盈利效率。它体现了量化交易策略设计的多项原则,包括何时入场、何时离场、分批建仓减仓、设置止损止盈等。这是一个可供参考借鉴的RSI背离策略范例。
||
Overview
This strategy is called "Pivot-based RSI Divergence Strategy". It uses the divergence between RSI indicators at different cycles to determine entry and exit points, and adds long-term RSI as a filter condition to improve the stability of the strategy.
Strategy Logic
The strategy mainly judges the opportunity to buy when there is a "hidden bullish divergence" or "regular bullish divergence" between the short-term RSI (such as 5-day RSI) and price; and to sell when there is a "hidden bearish divergence" or "regular bearish divergence".
A "regular bullish divergence" means that the price makes a new low while the RSI does not make a new low; a "hidden bullish divergence" is the opposite, the price does not make a new low while the RSI makes a new low. The "new lows" and "new highs" referred to in both definitions are relative to historical extremes over a certain rolling window.
In addition, the strategy also introduces long-term RSI (such as 50-day RSI) as a filter condition. It only considers buy signals when the long RSI is greater than 50; and considers stop loss or take profit exit when the long RSI is less than 30.
Advantages
The biggest advantage of this strategy is that it utilizes both the RSI divergence signals on the short-term and the filter of long-term RSI, which can avoid being trapped and missing trends to some extent. Specifically, it has the following main advantages:
- The short-term RSI divergence signal can give early judgment of price reversal opportunities and timely capture turning points;
- The long-term RSI filter avoids going long blindly when the trend is uncertain;
- Multiple types of take profit methods and partial profit-taking help reduce risk;
- The pyramiding mechanism allows adding positions and further expands profit potential.
Risks
The strategy also has some risks to note:
- RSI divergences are not always valid and there could be false signals;
- Risks amplify after pyramiding. Losses could accelerate if the judgment is wrong;
- Improper take profit settings may also lead to premature profit-taking or insufficient profits.
Corresponding risk management measures include: reasonably setting stop loss/take profit conditions, controlling position sizing, partial profit-taking to smooth the equity curve, etc.
Optimization Directions
There is room for further optimization of the strategy:
- RSI parameters can be further optimized to find the best combination;
- Divergence signals of other indicators such as MACD and KD can be tested;
- Parameters can be specifically optimized on certain products (such as crude oil, precious metals, etc.) to improve adaptability.
Summary
This strategy combines the long/short RSI divergence signals of short-term and long-term to improve profitability while controlling risks. It reflects multiple principles in quantitative strategy design, including when to enter, when to exit, partial profit-taking, stop loss/take profit setting, etc. This is an exemplary RSI divergence strategy for reference.
[/trans]
Strategy Arguments
| Argument | Default | Description |
|---|---|---|
| v_input_1 | 5 | RSI Period |
| v_input_2 | 50 | Long RSI Period |
| v_input_3_close | 0 | RSI Source: close |
| v_input_4 | 3 | Pivot Lookback Right |
| v_input_5 | true | Pivot Lookback Left |
| v_input_6 | 75 | Take Profit at RSI Level |
| v_input_7 | false | Stop Loss%(if checked 8% rule applied) |
| v_input_8 | 60 | Max of Lookback Range |
| v_input_9 | 5 | Min of Lookback Range |
| v_input_10 | true | Plot Bullish |
| v_input_11 | true | Plot Hidden Bullish |
| v_input_12 | true | Plot Bearish |
| v_input_13 | false | Plot Hidden Bearish |
Source (PineScript)
/*backtest
start: 2023-11-20 00:00:00
end: 2023-11-27 00:00:00
period: 5m
basePeriod: 1m
exchanges: [{"eid":"Futures_Binance","currency":"BTC_USDT"}]
*/

// This source code is subject to the terms of the Mozilla Public License 2.0 at https://mozilla.org/MPL/2.0/
// © mohanee

//@version=4

//GOOGL setting  5 ,50 close, 3 , 1  profitLevel at 75 and No stop Loss shows win rate 99.03 % profit factor 5830.152

strategy(title="RSI5_50 with Divergence", overlay=false,pyramiding=2, default_qty_type=strategy.fixed, default_qty_value=3,    initial_capital=10000, currency=currency.USD)

len = input(title="RSI Period", minval=1, defval=5)
longRSILen = input(title="Long RSI Period", minval=10, defval=50)
src = input(title="RSI Source", defval=close)
lbR = input(title="Pivot Lookback Right", defval=3)
lbL = input(title="Pivot Lookback Left", defval=1)
takeProfitRSILevel = input(title="Take Profit at RSI Level", minval=50, defval=75)
stopLoss = input(title="Stop Loss%(if checked 8% rule applied)", defval=false)

shortTermRSI = rsi(close,len)
longTermRSI = rsi(close,longRSILen)

rangeUpper = input(title="Max of Lookback Range", defval=60)
rangeLower = input(title="Min of Lookback Range", defval=5)
plotBull = input(title="Plot Bullish", defval=true)
plotHiddenBull = input(title="Plot Hidden Bullish", defval=true)
plotBear = input(title="Plot Bearish", defval=true)
plotHiddenBear = input(title="Plot Hidden Bearish", defval=false)


bearColor = color.purple
bullColor = color.green
hiddenBullColor = color.new(color.green, 80)
hiddenBearColor = color.new(color.red, 80)
textColor = color.white
noneColor = color.new(color.white, 100)


plot(shortTermRSI, title="RSI", linewidth=2, color=#8D1699)
plot(longTermRSI, title="longTermRSI", linewidth=2, color=color.orange)

hline(50, title="Middle Line", linestyle=hline.style_dotted)
obLevel = hline(70, title="Overbought", linestyle=hline.style_dotted)
osLevel = hline(30, title="Oversold", linestyle=hline.style_dotted)
fill(obLevel, osLevel, title="Background", color=longTermRSI >=50 ? color.green:color.purple, transp=65)  // longTermRSI >=50

plFound = na(pivotlow(shortTermRSI, lbL, lbR)) ? false : true
phFound = na(pivothigh(shortTermRSI, lbL, lbR)) ? false : true

_inRange(cond) =>
    bars = barssince(cond == true)
    rangeLower <= bars and bars <= rangeUpper

//------------------------------------------------------------------------------
// Regular Bullish

// shortTermRSI: Higher Low
oscHL = shortTermRSI[lbR] > valuewhen(plFound, shortTermRSI[lbR], 1) and _inRange(plFound[1])

// Price: Lower Low
priceLL = low[lbR] < valuewhen(plFound, low[lbR], 1)

bullCond = plotBull and priceLL and oscHL and plFound

plot(
	 plFound ? shortTermRSI[lbR] : na,
	 offset=-lbR,
	 title="Regular Bullish",
	 linewidth=2,
	 color=(bullCond ? bullColor : noneColor),
	 transp=0
	 )


plotshape(
	 bullCond ? shortTermRSI[lbR] : na,
	 offset=-lbR,
	 title="Regular Bullish Label",
	 text=" Bull ",
	 style=shape.labelup,
	 location=location.absolute,
	 color=bullColor,
	 textcolor=textColor,
	 transp=0
	 )

//------------------------------------------------------------------------------
// Hidden Bullish

// shortTermRSI: Lower Low
oscLL = shortTermRSI[lbR] < valuewhen(plFound, shortTermRSI[lbR], 1) and _inRange(plFound[1])

// Price: Higher Low
priceHL = low[lbR] > valuewhen(plFound, low[lbR], 1)

hiddenBullCond = plotHiddenBull and priceHL and oscLL and plFound

plot(
	 plFound ? shortTermRSI[lbR] : na,
	 offset=-lbR,
	 title="Hidden Bullish",
	 linewidth=2,
	 color=(hiddenBullCond ? hiddenBullColor : noneColor),
	 transp=0
	 )

plotshape(
	 hiddenBullCond ? shortTermRSI[lbR] : na,
	 offset=-lbR,
	 title="Hidden Bullish Label",
	 text=" H Bull ",
	 style=shape.labelup,
	 location=location.absolute,
	 color=bullColor,
	 textcolor=textColor,
	 transp=0
	 )

longCondition= longTermRSI >=50  and ( (bullCond or hiddenBullCond ) )  or  (strategy.position_size>0 and crossover(shortTermRSI,20) )
//last condition above is to leg in if you are already in the Long trade,


strategy.entry(id="RSIDivLE", long=true,  when=longCondition)


//------------------------------------------------------------------------------
// Regular Bearish

// shortTermRSI: Lower High
oscLH = shortTermRSI[lbR] < valuewhen(phFound, shortTermRSI[lbR], 1) and _inRange(phFound[1])

// Price: Higher High
priceHH = high[lbR] > valuewhen(phFound, high[lbR], 1)

bearCond = plotBear and priceHH and oscLH and phFound

plot(
	 phFound ? shortTermRSI[lbR] : na,
	 offset=-lbR,
	 title="Regular Bearish",
	 linewidth=2,
	 color=(bearCond ? bearColor : noneColor),
	 transp=0
	 )

plotshape(
	 bearCond ? shortTermRSI[lbR] : na,
	 offset=-lbR,
	 title="Regular Bearish Label",
	 text=" Bear ",
	 style=shape.labeldown,
	 location=location.absolute,
	 color=bearColor,
	 textcolor=textColor,
	 transp=0
	 )

//------------------------------------------------------------------------------
// Hidden Bearish

// shortTermRSI: Higher High
oscHH = shortTermRSI[lbR] > valuewhen(phFound, shortTermRSI[lbR], 1) and _inRange(phFound[1])

// Price: Lower High
priceLH = high[lbR] < valuewhen(phFound, high[lbR], 1)

hiddenBearCond = plotHiddenBear and priceLH and oscHH and phFound

plot(
	 phFound ? shortTermRSI[lbR] : na,
	 offset=-lbR,
	 title="Hidden Bearish",
	 linewidth=2,
	 color=(hiddenBearCond ? hiddenBearColor : noneColor),
	 transp=0
	 )

plotshape(
	 hiddenBearCond ? shortTermRSI[lbR] : na,
	 offset=-lbR,
	 title="Hidden Bearish Label",
	 text=" H Bear ",
	 style=shape.labeldown,
	 location=location.absolute,
	 color=bearColor,
	 textcolor=textColor,
	 transp=0
	 )


//calculate stop Loss
stopLossVal = stopLoss==true ? ( strategy.position_avg_price -  (strategy.position_avg_price*0.08) ) : 0

//partial profit
strategy.close(id="RSIDivLE", comment="TP1", qty=strategy.position_size*3/4, when=strategy.position_size>0 and (longTermRSI>=takeProfitRSILevel or crossover(longTermRSI,90)))
strategy.close(id="RSIDivLE",comment="TP2",   qty=strategy.position_size*3/4 , when=crossover(longTermRSI,70))
strategy.close(id="RSIDivLE",comment="TP3",   qty=strategy.position_size/2, when=crossover(longTermRSI,65))
strategy.close(id="RSIDivLE",comment="TP4",   qty=strategy.position_size/2 , when=crossover(longTermRSI,60))

//close the whole position when stoploss hits or longTermRSI goes below 30
strategy.close(id="RSIDivLE",comment="Exit",    when=crossunder(longTermRSI,30) or close<stopLossVal)
Detail
https://www.fmz.com/strategy/433539
Last Modified
2023-11-28 13:43:05